10-K: Annual report pursuant to Section 13 and 15(d)
Published on March 7, 2012
Table of Contents
UNITED STATES SECURITIES AND EXCHANGE COMMISSION
Washington, D.C. 20549
Form 10-K
(Mark One)
| þ | ANNUAL REPORT PURSUANT TO SECTION 13 OR 15(d) |
| OF THE SECURITIES EXCHANGE ACT OF 1934 |
| For the fiscal year ended December 31, 2011 |
OR
| ¨ | TRANSITION REPORT PURSUANT TO SECTION 13 OR 15(d) |
| OF THE SECURITIES EXCHANGE ACT OF 1934 |
| For the transition period from to |
Commission file number 814-00733
Triangle Capital Corporation
(Exact name of registrant as specified in its charter)
| Maryland | 06-1798488 | |
| (State or other jurisdiction of incorporation or organization) |
(I.R.S. Employer Identification No.) |
|
| 3700 Glenwood Avenue, Suite 530, Raleigh, North Carolina |
27612 (Zip Code) |
|
| (Address of principal executive offices) | ||
Registrants telephone number, including area code:
(919) 719-4770
Securities registered pursuant to Section 12(b) of the Act:
| Title of Each Class |
Name of Each Exchange on Which Registered |
|
| Common Stock, par value $0.001 per share |
The New York Stock Exchange | |
| 7.00% Senior Notes Due 2019 |
The New York Stock Exchange |
Securities registered pursuant to Section 12(g) of the Act:
None
Indicate by check mark if the registrant is a well-known seasoned issuer, as defined in Rule 405 of the Securities Act. Yes ¨ No þ
Indicate by check mark if the registrant is not required to file reports pursuant to Section 13 or Section 15(d) of the Act. Yes ¨ No þ
Indicate by check mark whether the registrant (1) has filed all reports required to be filed by Section 13 or 15(d) of the Securities Exchange Act of 1934 during the preceding 12 months (or for such shorter period that the registrant was required to file such reports), and (2) has been subject to such filing requirements for the past 90 days. Yes þ No ¨
Indicate by check mark whether the registrant has submitted electronically and posted on its corporate Web site, if any, every Interactive Data File required to be submitted and posted pursuant to Rule 405 of Regulation S-T during the preceding 12 months (or for such shorter period that the registrant was required to submit and post such files). Yes ¨ No ¨
Indicate by check mark if disclosure of delinquent filers pursuant to Item 405 of Regulation S-K is not contained herein, and will not be contained, to the best of registrants knowledge, in definitive proxy or information statements incorporated by reference in Part III of this Form 10-K or any amendment to this Form 10-K. ¨
Indicate by check mark whether the registrant is a large accelerated filer, an accelerated filer, a non-accelerated filer, or a smaller reporting company. See the definitions of large accelerated filer, accelerated filer and smaller reporting company in Rule 12b-2 of the Exchange Act. (Check one):
| Large accelerated filer ¨ |
Accelerated filer þ | Non-accelerated filer ¨ | Smaller reporting company ¨ | |||
| (Do not check if a smaller reporting company) |
Indicate by check mark whether the registrant is a shell company (as defined in Rule 12b-2 of the Exchange Act). Yes ¨ No þ
The aggregate market value of the voting common stock held by non-affiliates of the registrant as of June 30, 2011 was approximately $328,666,197.
The number of shares outstanding of the registrants Common Stock on March 2, 2012 was 27,210,434.
DOCUMENTS INCORPORATED BY REFERENCE
Portions of the Registrants definitive Proxy Statement relating to the 2012 Annual Meeting of Stockholders, to be filed with the Securities and Exchange Commission, are incorporated by reference in Part III of this Annual Report on Form 10-K, and certain exhibits previously filed with the Securities and Exchange commission are incorporated by reference into Part IV of this Annual Report.
Table of Contents
TRIANGLE CAPITAL CORPORATION
ANNUAL REPORT ON FORM 10-K
For the Fiscal Year Ended December 31, 2011
| Page | ||||||
| PART I | ||||||
| Item 1. |
3 | |||||
| Item 1A. |
31 | |||||
| Item 1B. |
54 | |||||
| Item 2. |
54 | |||||
| Item 3. |
54 | |||||
| Item 4. |
54 | |||||
| PART II | ||||||
| Item 5. |
Market for Registrants Common Equity, Related Stockholder Matters and Issuer Purchases |
55 | ||||
| Item 6. |
61 | |||||
| Item 7. |
Managements Discussion and Analysis of Financial Condition and Results of Operations |
63 | ||||
| Item 7A. |
78 | |||||
| Item 8. |
78 | |||||
| Item 9. |
Changes in and Disagreements with Accountants on Accounting and Financial Disclosure |
78 | ||||
| Item 9A. |
78 | |||||
| Item 9B. |
79 | |||||
| PART III | ||||||
| Item 10. |
79 | |||||
| Item 11. |
79 | |||||
| Item 12. |
Security Ownership of Certain Beneficial Owners and Management and Related Stockholder |
80 | ||||
| Item 13. |
Certain Relationships and Related Transactions, and Director Independence |
80 | ||||
| Item 14. |
80 | |||||
| PART IV | ||||||
| Item 15. |
81 | |||||
| 84 | ||||||
| Exhibits |
||||||
1
Table of Contents
FORWARD-LOOKING STATEMENTS
This Annual Report contains forward-looking statements which are subject to the safe harbor provisions of the Private Securities Litigation Reform Act of 1995. Statements that are not historical are forward-looking statements within the meaning of Section 27A of the Securities Act of 1933 and Section 21E of the Securities Exchange Act of 1934. Some of the statements in this Annual Report constitute forward-looking statements because they relate to future events or our future performance or financial condition. Forward-looking statements may include, among other things, statements as to our future operating results, our business prospects and the prospects of our portfolio companies, the impact of the investments that we expect to make, the ability of our portfolio companies to achieve their objectives, our expected financings and investments, the adequacy of our cash resources and working capital, and the timing of cash flows, if any, from the operations of our portfolio companies. Words such as expect, anticipate, target, goals, project, intend, plan, believe, seek, estimate, continue, forecast, may, should, potential, variations of such words, and similar expressions indicate a forward-looking statement, although not all forward-looking statements include these words. Readers are cautioned that the forward-looking statements contained in this Annual Report are only predictions, are not guarantees of future performance, and are subject to risks, events, uncertainties and assumptions that are difficult to predict. Our actual results could differ materially from those implied or expressed in the forward-looking statements for any reason, including the factors discussed in Item 1A entitled Risk Factors in Part I of this Annual Report and elsewhere in this Annual Report. Other factors that could cause actual results to differ materially include changes in the economy, risks associated with possible disruption in our operations or the economy generally due to terrorism, and future changes in laws or regulations and conditions in our operating areas. These statements are based on our current expectations, estimates, forecasts, information and projections about the industry in which we operate and the beliefs and assumptions of our management as of the date of this Annual Report. We assume no obligation to update or revise any forward-looking statements, whether as a result of new information, future events or otherwise, unless we are required to do so by law. Although we undertake no obligation to revise or update any forward-looking statements, whether as a result of new information, future events or otherwise, you are advised to consult any additional disclosures that we may make directly to you or through reports that we in the future may file with the SEC, including annual reports on Form 10-K, quarterly reports on Form 10-Q and current reports on Form 8-K.
2
Table of Contents
PART I
We are a Maryland corporation incorporated on October 10, 2006, for the purposes of acquiring 100% of the equity interests in Triangle Mezzanine Fund LLLP (Triangle SBIC) and its general partner, Triangle Mezzanine LLC (TML), raising capital in our initial public offering, which was completed in February 2007 (the IPO) and thereafter operating as an internally managed business development company (BDC) under the Investment Company Act of 1940 (the 1940 Act). On December 15, 2009, Triangle Mezzanine Fund II, LP (Triangle SBIC II) was organized as a limited partnership under the laws of the State of Delaware. Triangle SBICs Small Business Investment Company (SBIC) license from the United States Small Business Administration (the SBA) became effective on September 11, 2003 and Triangle SBIC IIs SBIC license became effective on May 26, 2010. Unless otherwise noted, the terms we, us, our and Triangle refer to Triangle SBIC prior to the IPO and to Triangle Capital Corporation and its subsidiaries, including Triangle SBIC and Triangle SBIC II, after the IPO. At the time of closing of the IPO, we consummated the following formation transactions (Formation Transactions):
| | We acquired 100% of the limited partnership interests in Triangle SBIC, which became our wholly-owned subsidiary, retained its license by the SBA to operate as an SBIC, continued to hold its existing investments and made new investments with the net proceeds of the IPO. |
| | We acquired 100% of the equity interests in TML. |
The IPO consisted of the sale of 4,770,000 shares of our common stock at a price of $15.00 per share, resulting in net proceeds to us of approximately $64.7 million after deducting offering costs. As a result of the IPO and the Formation Transactions described above, we and Triangle SBIC are closed-end, non-diversified investment companies that have elected to be treated as BDCs under the 1940 Act.
Our headquarters are in Raleigh, North Carolina, and our Internet address is www.tcap.com. We are not including the information contained on our website as a part of, or incorporating it by reference into, this Annual Report on Form 10-K. We make available free of charge through our website our Annual Reports on Form 10-K, Quarterly Reports on Form 10-Q, Current Reports on Form 8-K, and amendments to these reports, as soon as reasonably practicable after we electronically file such material with, or furnish such material to, the Securities and Exchange Commission (the SEC). Copies of this Annual Report and other reports are also available without charge upon written request to us.
Overview of our Business
We are a specialty finance company that provides customized financing to lower middle market companies located throughout the United States. We define lower middle market companies as those having annual revenues between $10.0 and $250.0 million. Our investment objective is to seek attractive returns by generating current income from our debt investments and capital appreciation from our equity related investments. Our investment philosophy is to partner with business owners, management teams and financial sponsors to provide flexible financing solutions to fund growth, changes of control, or other corporate events. We invest primarily in subordinated debt securities secured by second lien security interests in portfolio company assets, coupled with equity interests. On a more limited basis, we also invest in senior debt securities secured by first lien security interests in portfolio companies.
We focus on investments in companies with a history of generating revenues and positive cash flow, an established market position and a proven management team with a strong operating discipline. Our target portfolio company has annual revenues between $20.0 and $200.0 million and annual earnings before interest, taxes, depreciation and amortization (EBITDA) between $3.0 and $20.0 million. We believe that these companies have less access to capital and that the market for such capital is underserved relative to larger companies. Companies of this size are generally privately held and are less well known to traditional capital sources such as commercial and investment banks.
3
Table of Contents
Our investments generally range from $5.0 to $20.0 million per portfolio company. In certain situations, we have partnered with other funds to provide larger financing commitments. We operate Triangle SBIC and Triangle SBIC II as SBICs and utilize the proceeds of the sale of SBA-guaranteed debentures, referred to herein as SBA leverage, to enhance returns to our stockholders. As of December 31, 2011, we had investments in 63 portfolio companies, with an aggregate cost of $498.3 million.
Our Business Strategy
We seek attractive returns by generating current income from our debt investments and capital appreciation from our equity related investments by:
| | Utilizing Long-Standing Relationships to Source Deals. Our senior management team maintains extensive relationships with entrepreneurs, financial sponsors, attorneys, accountants, investment bankers, commercial bankers and other non-bank providers of capital who refer prospective portfolio companies to us. These relationships historically have generated significant investment opportunities. We believe that our network of relationships will continue to produce attractive investment opportunities. |
| | Focusing on Underserved Markets. The lower middle market has traditionally been underserved. We believe that broad-based consolidation in the financial services industry coupled with operating margin and growth pressures have caused financial institutions to de-emphasize services to lower middle market companies in favor of larger corporate clients and capital market transactions. We believe these dynamics have resulted in the financing market for lower middle market companies to be underserved, providing us with greater investment opportunities. |
| | Providing Customized Financing Solutions. We offer a variety of financing structures and have the flexibility to structure our investments to meet the needs of our portfolio companies. Typically we invest in subordinated debt securities, coupled with equity interests. We believe our ability to customize financing arrangements makes us an attractive partner to lower middle market companies. |
| | Leveraging the Experience of Our Management Team. Our senior management team has extensive experience advising, investing in, lending to and operating companies across changing market cycles. The members of our management team have diverse investment backgrounds, with prior experience at investment banks, commercial banks, and privately and publicly held companies in the capacity of executive officers. We believe this diverse experience provides us with an in depth understanding of the strategic, financial and operational challenges and opportunities of lower middle market companies. We believe this understanding allows us to select and structure better investments and to efficiently monitor and provide managerial assistance to our portfolio companies. |
| | Applying Rigorous Underwriting Policies and Active Portfolio Management. Our senior management team has implemented rigorous underwriting policies that are followed in each transaction. These policies include a thorough analysis of each potential portfolio companys competitive position, financial performance, management team operating discipline, growth potential and industry attractiveness, which we believe allows us to better assess the companys prospects. After investing in a company, we monitor the investment closely, typically receiving monthly, quarterly and annual financial statements. We analyze and discuss in detail the companys financial performance with management in addition to participating in regular board of directors meetings. We believe that our initial and ongoing portfolio review process allows us to monitor effectively the performance and prospects of our portfolio companies. |
| | Taking Advantage of Low Cost Debentures Guaranteed by the SBA. Our license to do business as an SBIC allows us to issue fixed-rate, low interest debentures which are guaranteed by the SBA and sold in the capital markets, potentially allowing us to increase our net interest income beyond the levels achievable by other BDCs utilizing traditional leverage. |
| | Maintaining Portfolio Diversification. While we focus our investments in lower middle market companies, we seek to invest across various industries. We monitor our investment portfolio to ensure we |
4
Table of Contents
| have acceptable industry balance, using industry and market metrics as key indicators. By monitoring our investment portfolio for industry balance, we seek to reduce the effects of economic downturns associated with any particular industry or market sector. However, we may from time to time hold securities of a single portfolio company that comprise more than 5.0% of our total assets and/or more than 10.0% of the outstanding voting securities of the portfolio company. For that reason, we are classified as a non-diversified management investment company under the 1940 Act. |
Investments
Debt Investments
We tailor the terms of our debt investments to the facts and circumstances of each transaction and prospective portfolio company, negotiating a structure that seeks to protect our rights and manage our risk while creating incentives for the portfolio company to achieve its business plan. To that end, we typically seek board observation rights with each of our portfolio companies and offer managerial assistance. We also seek to limit the downside risks of our investments by negotiating covenants that are designed to protect our investments while affording our portfolio companies as much flexibility in managing their businesses as possible. Such restrictions may include affirmative and negative covenants, default penalties, lien protection, change of control provisions and put rights. We typically add a prepayment penalty structure to enhance our total return on our investments.
We primarily invest in subordinated notes and invest in senior secured debt on a more limited basis. Subordinated notes are junior to senior secured debt. Our subordinated debt investments and senior secured debt investments generally have terms of three to seven years, do not have scheduled amortization and are due at maturity. Our subordinated debt investments generally provide for fixed interest rates between 12.0% and 17.0% per annum and our senior secured debt investments generally provide for variable interest at rates ranging from LIBOR plus 350 basis points to LIBOR plus 950 basis points per annum. Our subordinated debt investments generally are secured by a second priority security interest in the assets of the borrower and generally include an equity component, such as warrants to purchase common stock in the portfolio company. In addition, certain loan investments may have a form of interest that is not paid currently but is accrued and added to the loan balance and paid at the end of the term, referred to as payment in kind (PIK) interest. In our negotiations with potential portfolio companies, we generally seek to minimize PIK interest as we have to pay out such accrued interest as distributions to our stockholders, and we may have to borrow money or raise additional capital in order to meet the requirement of generally having to pay out at least 90.0% of our taxable income to continue to qualify as a Regulated Investment Company, or RIC, for U.S. federal income tax purposes. At December 31, 2011, the weighted average yield on our outstanding debt investments other than non-accrual debt investments (including PIK interest) was approximately 15.0% , the weighted average yield on all of our outstanding investments (including equity and equity-linked investments but excluding non-accrual debt investments) was approximately 13.9% and the weighted average yield on all of our outstanding investments (including equity and equity-linked investments and non-accrual debt investments) was approximately 13.6%.
An SBIC may make investments in the form of straight loans (Loans), debt with equity features (Debt Securities), or equity securities. Loans and Debt Securities must be issued for a term of not less than one year (except for bridge loans in anticipation of a permanent financing in which the SBIC intends to participate, or to protect its prior investment) and must have amortization not exceeding straight line. The permissible interest rate on Loans is the higher of (i) 19% or (ii) 11% over the higher of the SBICs weighted cost of debenture leverage or the current debenture rate. For Debt Securities, the permitted rate is the higher of (i) 14% or (ii) 6% over the higher of the SBICs weighted cost of debenture leverage or the current debenture rate. If a financing is in default, these maximums may increase by up to 7%. SBA Regulations define an SBICs weighted cost of debenture leverage and describe the permitted rate when more than one SBIC participates in the financing.
Equity Investments
When we provide financing, we often acquire equity interests in the portfolio company. We generally seek to structure our equity investments as non-control investments to provide us with minority rights and
5
Table of Contents
event-driven or time-driven puts. We also seek to obtain registration rights in connection with these investments, which may include demand and piggyback registration rights, board seats and board observation rights. Our investments have in the past and may in the future contain a synthetic equity position pursuant to a formula typically setting forth royalty rights we may exercise in accordance with such formula.
Investment Criteria
We utilize the following criteria and guidelines in evaluating investment opportunities. However, not all of these criteria and guidelines have been, or will be, met in connection with each of our investments.
| | Established Companies With Positive Cash Flow. We seek to invest in established companies with a history of generating revenues and positive cash flows. We typically focus on companies with a history of profitability and minimum trailing twelve month EBITDA of $3.0 million. We do not invest in start-up companies, distressed situations, turn-around situations or companies that we believe have unproven business plans. |
| | Experienced Management Teams With Meaningful Equity Ownership. Based on our prior investment experience, we believe that a management team with significant experience with a portfolio company or relevant industry experience and meaningful equity ownership is more committed to a portfolio company. We believe management teams with these attributes are more likely to manage the companies in a manner that protects our debt investment and enhances the value of our equity investment. |
| | Strong Competitive Position. We seek to invest in companies that have developed strong positions within their respective markets, are well positioned to capitalize on growth opportunities and compete in industries with barriers to entry. We also seek to invest in companies that exhibit a competitive advantage, which may help to protect their market position and profitability. |
| | Varied Customer and Supplier Base. We prefer to invest in companies that have a varied customer and supplier base. Companies with a varied customer and supplier base are generally better able to endure economic downturns, industry consolidation and shifting customer preferences. |
| | Significant Invested Capital. We believe the existence of significant underlying equity value provides important support to investments. We look for portfolio companies that we believe have sufficient value beyond the layer of the capital structure in which we invest. |
Investment Committees
Triangle Capital Corporation has an investment committee that is responsible for all aspects of our investment process relating to investments made by Triangle Capital Corporation or any of its subsidiaries, other than investments made by Triangle SBIC and Triangle SBIC II. The members of the Triangle Capital Corporation investment committee are Messrs. Garland S. Tucker, III, Brent P.W. Burgess, Steven C. Lilly, Jeffrey A. Dombcik, Douglas A. Vaughn, Cary B. Nordan and David F. Parker.
Triangle SBIC has an investment committee that is responsible for all aspects of our investment process relating to investments made by Triangle SBIC. The members of Triangle SBICs investment committee are Messrs. Garland S. Tucker, III, Brent P.W. Burgess, Steven C. Lilly, Jeffrey A. Dombcik, Douglas A. Vaughn, Cary B. Nordan and David F. Parker.
Triangle SBIC II has an investment committee that is responsible for all aspects of our investment process relating to investments made by Triangle SBIC II. The members of Triangle SBIC IIs investment committee are Messrs. Garland S. Tucker, III, Brent P.W. Burgess, Steven C. Lilly, Jeffrey A. Dombcik, Douglas A. Vaughn, and Cary B. Nordan. For purposes of the discussion herein, any reference to the investment committee refers to the investment committee of Triangle Capital Corporation, the investment committee of Triangle SBIC and the investment committee of Triangle SBIC II.
6
Table of Contents
Investment Process
Our investment committee meets once a week and also meets on an as needed basis depending on transaction volume. Our investment committee has organized our investment process into five distinct stages:
| | Origination |
| | Due Diligence and Underwriting |
| | Approval |
| | Documentation and Closing |
| | Portfolio Management and Investment Monitoring |
Our investment process is summarized in the following chart:
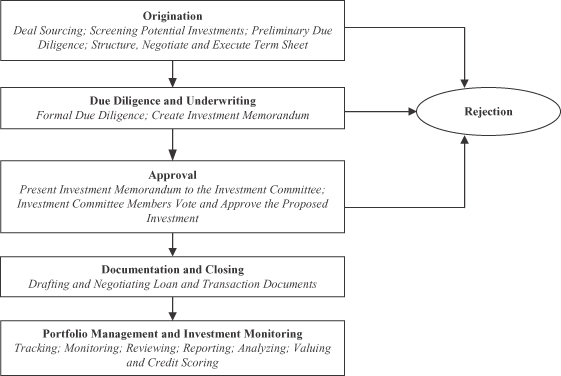
Origination
The origination process for our investments includes sourcing, screening, preliminary due diligence, transaction structuring, and negotiation. Our investment professionals utilize their extensive relationships with various financial sponsors, entrepreneurs, attorneys, accountants, investment bankers and other non-bank providers of capital to source transactions with prospective portfolio companies.
If a transaction meets our investment criteria, we perform preliminary due diligence, taking into consideration some or all of the following factors:
| | A comprehensive financial model that we prepare based on quantitative analysis of historical financial performance, financial projections and pro forma financial ratios assuming investment; |
7
Table of Contents
| | Competitive landscape surrounding the potential investment; |
| | Strengths and weaknesses of the potential investments business strategy and industry; |
| | Results of a broad qualitative analysis of the companys management team, products or services, market position, market dynamics and customers and suppliers; and |
| | Potential investment structures, certain financing ratios and investment pricing terms. |
If the results of our preliminary due diligence are satisfactory, the origination team prepares a Summary Transaction Memorandum, which is presented to our investment committee. If our investment committee recommends moving forward, we issue a non-binding term sheet to the potential portfolio company. Upon execution of a term sheet, we begin our formal due diligence and underwriting process as we move toward investment approval.
Due Diligence and Underwriting
Our due diligence on a prospective investment is completed by a minimum of two investment professionals, which we refer to as the underwriting team. The members of the underwriting team work together to conduct due diligence and to understand the relationships among the prospective portfolio companys business plan, operations and financial performance through various methods, including, among others, on-site visits with management, in-depth review of historical and projected financial data, interviews with customers and suppliers, management background checks, third-party accounting reports and review of any material contracts.
In most circumstances, we utilize outside experts to review the legal affairs, accounting systems, and, where appropriate, we engage specialists to investigate issues like environmental matters and general industry outlooks. During the underwriting process, significant attention is given to sensitivity analyses and how companies might be expected to perform in a protracted downside operating environment. In addition, we analyze key financing ratios and other industry metrics, including total debt to EBITDA, EBITDA to fixed charges, EBITDA to total interest expense, total debt to total capitalization and total senior debt to total capitalization.
Upon completion of a satisfactory due diligence review and as part of our evaluation of a proposed investment, the underwriting team prepares an Investment Memorandum for presentation to our investment committee. The Investment Memorandum includes information about the potential portfolio company such as its history, business strategy, potential strengths and risks involved, analysis of key customers and suppliers, third party consultant findings, expected returns on investment structure, anticipated sources of repayment and exit strategies, analysis of historical financials, and potential capitalization and ownership.
Approval
The underwriting team for the proposed investment presents the Investment Memorandum to our investment committee for consideration and approval. After reviewing the Investment Memorandum, members of the investment committee may request additional due diligence or modify the proposed financing structure or terms of the proposed investment. Before we proceed with any investment, the investment committee must approve the proposed investment. Upon receipt of transaction approval, the underwriting team proceeds to document the transaction.
Documentation and Closing
The underwriting team is responsible for all documentation related to investment closings. In addition, we rely on law firms with whom we have worked on multiple transactions to help us complete the necessary documentation associated with transaction closings. If a transaction changes materially from what was originally approved by the investment committee, the underwriting team requests a formal meeting of the investment committee to communicate the contemplated changes. The investment committee has the right to approve the amended transaction structure, to suggest alternative structures or not to approve the contemplated changes.
8
Table of Contents
Portfolio Management and Investment Monitoring
Our investment professionals generally employ several methods of evaluating and monitoring the performance of our portfolio companies, which, depending on the particular investment, may include the following specific processes, procedures and reports:
| | Monthly and quarterly review of actual financial performance versus the corresponding period of the prior year and financial projections; |
| | Monthly and quarterly monitoring of all financial and other covenants; |
| | Review of senior lender loan compliance certificates, where applicable; |
| | Quarterly review of operating results, and general business performance, including the preparation of a portfolio monitoring report which is distributed to members of our investment committee; |
| | Periodic face-to-face meetings with management teams and financial sponsors of portfolio companies; |
| | Attendance at portfolio company board meetings through board seats or observation rights; and |
| | Application of our investment rating system to each investment. |
In the event that our investment committee determines that an investment is underperforming, or circumstances suggest that the risk associated with a particular investment has significantly increased, we undertake more aggressive monitoring of the affected portfolio company. The level of monitoring of an investment is determined by a number of factors, including, but not limited to, trends in the financial performance of the portfolio company, the investment structure and the type of collateral securing our investment, if any.
Investment Rating System
We monitor a wide variety of key credit statistics that provide information regarding our portfolio companies to help us assess credit quality and portfolio performance. We generally require our portfolio companies to have annual financial audits in addition to monthly and quarterly unaudited financial statements. Using these statements, we calculate and evaluate certain financing ratios. For purposes of analyzing the financial performance of our portfolio companies, we may make certain adjustments to their financial statements to reflect the pro forma results of the portfolio company consistent with a change of control transaction, to reflect anticipated cost savings resulting from a merger or restructuring, costs related to new product development, compensation to previous owners, and other acquisition or restructuring related items.
As part of our valuation procedures we assign an investment rating to all of our investments in debt securities. Our investment rating system uses a scale of 0 to 10, with 10 being the lowest probability of default and principal loss. This system is used to estimate the probability of default on our debt securities and the probability of loss if there is a default. The system is also used to assist us in estimating the fair value of equity related securities. These types of systems are referred to as risk rating systems and are also used by banks and rating agencies. Our risk rating system covers both qualitative and quantitative aspects of the business and the securities we hold.
9
Table of Contents
Each portfolio company debt investment is rated based upon the following numeric investment rating system:
| Investment |
Description |
|
| 10 |
Investment is performing above original expectations and possibly 30.0% or more above original projections provided by the portfolio company. Investment has been positively influenced by an unforeseen external event. Full return of principal and interest is expected. Capital gain is expected. | |
| 9 |
Investment is performing above original expectations and possibly 30.0% or more above original projections provided by the portfolio company. Investment may have been or is soon to be positively influenced by an unforeseen external event. Full return of principal and interest is expected. Capital gain is expected. | |
| 8 |
Investment is performing above original expectations and possibly 21.0% to 30.0% above original projections provided by the portfolio company. Full return of principal and interest is expected. Capital gain is expected. | |
| 7 |
Investment is performing above original expectations and possibly 11.0% to 20.0% above original projections provided by the portfolio company. Full return of principal and interest is expected. Depending on age of transaction, potential for capital gain exists. | |
| 6 |
Investment is performing above original expectations and possibly 5.0% to 10.0% above original projections provided by the portfolio company. Full return of principal and interest is expected. Depending on age of transaction, potential for capital gain exists. | |
| 5 |
Investment is performing in line with original expectations. Full return of principal and interest is expected. Depending on age of transaction, potential for capital gain may be expected. | |
| 4 |
Investment is performing below original expectations, but no covenant defaults have occurred. Full return of principal and interest is expected. Potential for capital gain may still be expected. | |
| 3 |
Investment is in default of transaction covenants but interest payments are current. No loss of principal is expected. | |
| 2 |
Investment is in default of transaction covenants and interest (and possibly principal) payments are not current. A principal loss of between 1.0% and 33.0% is expected. | |
| 1 |
Investment is in default of transaction covenants and interest (and possibly principal) payments are not current. A principal loss of between 34.0% and 67.0% is expected. | |
| 0 |
Investment is in default and a principal loss of between 68.0% and 100.0% is expected. | |
Valuation Process and Determination of Net Asset Value
Valuation Process
The most significant estimate inherent in the preparation of our financial statements is the valuation of investments and the related amounts of unrealized appreciation and depreciation of investments. We have established and documented processes and methodologies for determining the fair values of portfolio company investments on a recurring (quarterly) basis in accordance with Financial Accounting Standards Board (FASB) Accounting Standards Codification (ASC) Topic 820, Fair Value Measurements and Disclosures (ASC Topic 820). ASC Topic 820, defines fair value, establishes a framework for measuring fair value in accordance with generally accepted accounting principles and expands disclosures about fair value measurements. As discussed below, we have engaged an independent valuation firm to assist us in our valuation process.
ASC Topic 820 clarifies that the exchange price is the price in an orderly transaction between market participants to sell an asset or transfer a liability in the market in which the reporting entity would transact for the
10
Table of Contents
asset or liability, that is, the principal or most advantageous market for the asset or liability. The transaction to sell the asset or transfer the liability is a hypothetical transaction at the measurement date, considered from the perspective of a market participant that holds the asset or owes the liability. ASC Topic 820 provides a consistent definition of fair value which focuses on exit price and prioritizes, within a measurement of fair value, the use of market-based inputs over entity-specific inputs. In addition, ASC Topic 820 provides a framework for measuring fair value, and establishes a three-level hierarchy for fair value measurements based upon the transparency of inputs to the valuation of an asset or liability as of the measurement date. The three levels of valuation hierarchy established by ASC Topic 820 are defined as follows:
Level 1 inputs to the valuation methodology are quoted prices (unadjusted) for identical assets or liabilities in active markets.
Level 2 inputs to the valuation methodology include quoted prices for similar assets and liabilities in active markets, and inputs that are observable for the asset or liability, either directly or indirectly, for substantially the full term of the financial instrument.
Level 3 inputs to the valuation methodology are unobservable and significant to the fair value measurement.
A financial instruments categorization within the valuation hierarchy is based upon the lowest level of input that is significant to the fair value measurement. We invest primarily in debt and equity instruments of privately held companies for which quoted prices falling within the categories of Level 1 and Level 2 inputs are not available. Therefore, we value all of our investments at fair value, as determined in good faith by our Board of Directors, using Level 3 inputs, as further described below. Due to the inherent uncertainty in the valuation process, our Board of Directors estimate of fair value may differ significantly from the values that would have been used had a ready market for the securities existed, and the differences could be material. In addition, changes in the market environment and other events that may occur over the life of the investments may cause the gains or losses ultimately realized on these investments to be different than the valuations currently assigned. For a discussion of the risks inherent in determining the value of securities for which readily available market values do not exist, see Risk Factors Risks Relating to Our Business and Structure Our investment portfolio is and will continue to be recorded at fair value as determined in good faith by our Board of Directors and, as a result, there is and will continue to be uncertainty as to the value of our portfolio investments included in Item 1A of Part I of this Annual Report.
Debt and equity securities that are not publicly traded and for which a limited market does not exist are valued at fair value as determined in good faith by our Board of Directors. There is no single standard for determining fair value in good faith, as fair value depends upon circumstances of each individual case. In general, fair value is the amount that we might reasonably expect to receive upon the current sale of the security.
We evaluate the investments in portfolio companies using the most recent portfolio company financial statements and forecasts. We also consult with the portfolio companys senior management to obtain further updates on the portfolio companys performance, including information such as industry trends, new product development and other operational issues. Additionally, we consider some or all of the following factors:
| | financial standing of the issuer of the security; |
| | comparison of the business and financial plan of the issuer with actual results; |
| | the size of the security held; |
| | pending public offering of common stock by the issuer of the security; |
| | pending reorganization activity affecting the issuer, such as merger or debt restructuring; |
| | ability of the issuer to obtain needed financing; |
| | changes in the economy affecting the issuer; |
11
Table of Contents
| | financial statements and reports from portfolio company senior management and ownership; |
| | the type of security, the securitys cost at the date of purchase and any contractual restrictions on the disposition of the security; |
| | special reports prepared by analysts; |
| | information as to any transactions or offers with respect to the security and/or sales to third parties of similar securities; |
| | the issuers ability to make payments and the type of collateral securing the investment; |
| | the current and forecasted earnings of the issuer; |
| | statistical ratios compared to lending standards and to other similar securities; and |
| | other pertinent factors. |
In making the good faith determination of the value of debt securities, we start with the cost basis of the security, which includes any unamortized original issue discount, unamortized loan origination fees, and PIK interest, if any. We also use the risk rating system discussed above under Investment Rating System to estimate the probability of default on the debt securities and the probability of loss if there is a default. The risk rating system covers both qualitative and quantitative aspects of the business and the securities held. In valuing debt securities, we utilize an income approach model that considers factors including, but not limited to, (i) the portfolio investments current risk rating, (ii) the portfolio companys current trailing twelve months (TTM) results of operations as compared to the portfolio companys TTM results of operations as of the date the investment was made and the portfolio companys anticipated results for the next twelve months of operations, (iii) the portfolio companys current leverage as compared to its leverage as of the date the investment was made, (iv) publicly available information regarding current pricing and credit metrics for similar proposed and executed investment transactions of private companies and (v) when management believes a relevant comparison exists, current pricing and credit metrics for similar proposed and executed investment transactions of publicly traded debt.
In valuing equity securities of private companies, we consider valuation methodologies consistent with industry practice, including but not limited to (i) valuation using a valuation model based on original transaction multiples and the portfolio companys recent financial performance, (ii) valuation of the securities based on publicly available information regarding recent sales in comparable transactions of private companies and (iii) when management believes there are comparable companies that are publicly traded, a review of these publicly traded companies and the market multiple of their equity securities.
Unrealized appreciation or depreciation on portfolio investments are recorded as increases or decreases in investments on the balance sheets and are separately reflected on the statements of operations in determining net increase or decrease in net assets resulting from operations.
Determination of the fair value involves subjective judgments and estimates not susceptible to substantiation by auditing procedures. Accordingly, under current auditing standards, the notes to our financial statements will refer to the uncertainty with respect to the possible effect of such valuations, and any change in such valuations, on our financial statements. In addition, the SBA has established certain valuation guidelines for SBICs to follow when valuing portfolio investments.
Duff & Phelps, LLC (Duff & Phelps), an independent valuation firm, provides third party valuation consulting services to us, which consist of certain limited procedures that we identified and requested Duff & Phelps to perform (hereinafter referred to as the procedures). We generally request Duff & Phelps to perform the procedures on each portfolio company at least once in every calendar year and for new portfolio companies, at least once in the twelve-month period subsequent to the initial investment. In addition, we generally request
12
Table of Contents
Duff & Phelps to perform the procedures on a portfolio company when there has been a significant change in the fair value of the investment. In certain instances, we may determine that it is not cost-effective, and as a result is not in our stockholders best interest, to request Duff & Phelps to perform the procedures on one or more portfolio companies. Such instances include, but are not limited to, situations where the fair value of our investment in the portfolio company is determined to be insignificant relative to our total investment portfolio. For a further discussion of Duff & Phelps procedures, see the section entitled Investment Valuation included in Managements Discussion and Analysis of Financial Condition and Results of Operations included in Item 7 of Part II of this Annual Report.
Quarterly Net Asset Value Determination
We determine the net asset value per share of our common stock on at least a quarterly basis, and more frequently if we are required to do so pursuant to an equity offering or pursuant to federal laws and regulations. The net asset value per share is equal to the value of our total assets minus total liabilities and any preferred stock outstanding divided by the total number of shares of common stock outstanding.
Managerial Assistance
As a BDC, we offer, and must provide upon request, managerial assistance to certain of our portfolio companies. This assistance typically involves, among other things, monitoring the operations of our portfolio companies, participating in board and management meetings, consulting with and advising officers of portfolio companies and providing other organizational and financial guidance. Our senior management team provides such services. We believe, based on our management teams combined experience at investment banks, commercial banks, and operating in executive-level capacities in various operating companies, we offer this assistance effectively. We generally receive fees for these services.
Competition
We compete for investments with a number of investment funds (including private equity funds, mezzanine funds and other SBICs) and BDCs, as well as traditional financial services companies such as commercial banks and other sources of financing. Many of these entities have greater financial and managerial resources than we do. We believe we compete with these entities primarily on the basis of our willingness to make smaller investments, the experience and contacts of our management team, our responsive and efficient investment analysis and decision-making processes, our comprehensive suite of customized financing solutions and the investment terms we offer.
We believe that some of our competitors make senior secured loans, junior secured loans and subordinated debt investments with interest rates that are comparable to or lower than the rates we offer. Therefore, we do not seek to compete primarily on the interest rates we offer to potential portfolio companies.
Our competitors also do not always require equity components in their investments. For additional information concerning the competitive risks we face, see Risk Factors Risks Relating to Our Business and Structure We operate in a highly competitive market for investment opportunities included in Item 1A of Part I of this Annual Report.
Brokerage Allocation and Other Practices
We did not pay any brokerage commissions during the years ended December 31, 2011, 2010 or 2009 in connection with the acquisition and/or disposal of our investments. We generally acquire and dispose of our investments in privately negotiated transactions; therefore, we infrequently use brokers in the normal course of our business. Our management team is primarily responsible for the execution of any publicly traded securities portion of our portfolio transactions and the allocation of brokerage commissions. We do not expect to execute
13
Table of Contents
transactions through any particular broker or dealer, but will seek to obtain the best net results for us, taking into account such factors as price (including the applicable brokerage commission or dealer spread), size of order, difficulty of execution, and operational facilities of the firm and the firms risk and skill in positioning blocks of securities. While we will generally seek reasonably competitive trade execution costs, we will not necessarily pay the lowest spread or commission available. Subject to applicable legal requirements, we may select a broker based partly upon brokerage or research services provided to us. In return for such services, we may pay a higher commission than other brokers would charge if we determine in good faith that such commission is reasonable in relation to the services provided.
Dividend Reinvestment Plan
We have adopted a dividend reinvestment plan that provides for reinvestment of our distributions on behalf of our common stockholders, unless a common stockholder elects to receive cash as provided below. As a result, if our Board of Directors authorizes, and we declare, a cash dividend, then our common stockholders who have not opted out of our dividend reinvestment plan will have their cash dividends automatically reinvested in additional shares of our common stock, rather than receiving the cash dividends.
No action will be required on the part of a registered common stockholder to have his or her cash dividend reinvested in shares of our common stock. A registered common stockholder may elect to receive an entire dividend in cash by notifying Computershare Shareowner Services, LLC, the Plan Administrator and our transfer agent and registrar, in writing so that such notice is received by the Plan Administrator no later than the record date for dividends to common stockholders. The Plan Administrator will set up an account for shares acquired through the plan for each common stockholder who has not elected to receive dividends in cash and hold such shares in non-certificated form. Upon request by a common stockholder participating in the plan, received in writing not less than 10 days prior to the record date, the Plan Administrator will, instead of crediting shares to the participants account, issue a certificate registered in the participants name for the number of whole shares of our common stock and a check for any fractional share. Those common stockholders whose shares are held by a broker or other financial intermediary may receive dividends in cash by notifying their broker or other financial intermediary of their election.
We intend to use primarily newly issued shares to implement the plan, so long as our shares are trading at or above net asset value. If our shares are trading below net asset value, we intend to purchase shares in the open market in connection with our implementation of the plan. If we use newly issued shares to implement the plan, the number of shares to be issued to a common stockholder is determined by dividing the total dollar amount of the dividend payable to such common stockholder by the market price per share of our common stock at the close of regular trading on the New York Stock Exchange, or the NYSE, on the dividend payment date. Market price per share on that date will be the closing price for such shares on the NYSE or, if no sale is reported for such day, at the average of their reported bid and asked prices. If we purchase shares in the open market to implement the plan, the number of shares to be issued to a common stockholder is determined by dividing the total dollar amount of the dividend payable to such common stockholder by the average price per share for all shares purchased by the Plan Administrator in the open market in connection with the dividend. The number of shares of our common stock to be outstanding after giving effect to payment of the dividend cannot be established until the value per share at which additional shares will be issued has been determined and elections of our common stockholders have been tabulated.
There will be no brokerage charges or other charges to common stockholders who participate in the plan. However, certain brokerage firms may charge brokerage charges or other charges to their customers. We will pay the Plan Administrators fees under the plan. If a participant elects by written notice to the Plan Administrator to have the Plan Administrator sell part or all of the shares held by the Plan Administrator in the participants account and remit the proceeds to the participant, the Plan Administrator is authorized to deduct a $15.00 transaction fee plus a $0.10 per share brokerage commissions from the proceeds.
14
Table of Contents
Common stockholders who receive dividends in the form of stock generally are subject to the same federal, state and local tax consequences as are common stockholders who elect to receive their dividends in cash. A common stockholders basis for determining gain or loss upon the sale of stock received in a dividend from us will be equal to the total dollar amount of the dividend payable to the common stockholder. Any stock received in a dividend will have a holding period for tax purposes commencing on the day following the day on which the shares are credited to the U.S. common stockholders account.
Participants may terminate their accounts under the plan by notifying the Plan Administrator via its website at https://www.bnymellon.com/shareowner/equityaccess, by filling out the transaction request form located at the bottom of their statement and sending it to the Plan Administrator at Computershare Shareowner Services LLC, P.O. Box 358035, Pittsburgh, Pennsylvania 15252-8015, or by calling the Plan Administrator at (866) 228-7201.
We may terminate the plan upon notice in writing mailed to each participant at least 30 days prior to any record date for the payment of any dividend by us. All correspondence concerning the plan should be directed to the Plan Administrator by mail at Computershare Shareowner Services LLC, P.O. Box 358035, Pittsburgh, Pennsylvania 15252-8015.
Employees
As of December 31, 2011, we employed nineteen individuals, including investment and portfolio management professionals, operations professionals and administrative staff. We expect to expand our management team and administrative staff in the future in proportion to our growth.
Election to be Regulated as a Business Development Company and Regulated Investment Company
We and Triangle SBIC are closed-end, non-diversified management investment companies that have elected to be treated as BDCs under the 1940 Act. In addition, we have elected to be treated as a RIC under Subchapter M of the Internal Revenue Code of 1986, as amended (the Code). Our election to be regulated as a BDC and our election to be treated as a RIC for federal income tax purposes have a significant impact on our operations. Some of the most important effects on our operations of our election to be regulated as a BDC and our election to be treated as a RIC are outlined below.
| | We report our investments at market value or fair value with changes in value reported through our statements of operations. |
In accordance with the requirements of Article 6 of Regulation S-X, we report all of our investments, including debt investments, at market value or, for investments that do not have a readily available market value, at their fair value as determined in good faith by our Board of Directors. Changes in these values are reported through our statements of operations under the caption of net unrealized appreciation (depreciation) of investments. See Valuation Process and Determination of Net Asset Value above.
| | We intend to distribute substantially all of our income to our stockholders. We generally will be required to pay income taxes only on the portion of our taxable income we do not distribute to stockholders (actually or constructively). |
As a RIC, so long as we meet certain minimum distribution, source-of-income and asset diversification requirements, we generally are required to pay U.S. federal income taxes only on the portion of our taxable income and gains we do not distribute (actually or constructively) and certain built-in gains. We intend to distribute to our stockholders substantially all of our income. We may, however, make deemed distributions to our stockholders of any retained net long-term capital gains. If this happens, our stockholders will be treated as if they received an actual distribution of the net capital gains and reinvested the net after-tax proceeds in us. Our stockholders also may be eligible to claim a tax credit (or, in certain circumstances, a tax refund) equal to their allocable share of the corporate-level U.S. federal income tax we pay on the deemed distribution. See Material U.S. Federal Income Tax Considerations. We met the minimum distribution requirements for 2009, 2010 and 2011 and continually monitor our distribution requirements with the goal of ensuring compliance with the Code.
15
Table of Contents
In addition, we have certain wholly-owned taxable subsidiaries (the Taxable Subsidiaries), each of which holds a portion of one or more of our portfolio investments that are listed on the Consolidated Schedule of Investments. The Taxable Subsidiaries are consolidated for financial reporting purposes in accordance with GAAP, so that our consolidated financial statements reflect our investments in the portfolio companies owned by the Taxable Subsidiaries. The purpose of the Taxable Subsidiaries is to permit us to hold certain interests in portfolio companies that are organized as limited liability companies (LLCs) (or other forms of pass through entities) and still satisfy the RIC tax requirement that at least 90.0% of the RICs gross income for federal income tax purposes must consist of qualifying investment income. Absent the Taxable Subsidiaries, a proportionate amount of any gross income of an LLC (or other pass through entity) portfolio investment would flow through directly to the RIC. To the extent that such income did not consist of investment income, it could jeopardize our ability to qualify as a RIC and therefore cause us to incur significant amounts of corporate-level U.S. federal income taxes. Where interests in LLCs (or other pass-through entities) are owned by the Taxable Subsidiaries, however, the income from such interests is taxed to the Taxable Subsidiaries and does not flow through to the RIC, thereby helping us preserve our RIC status and resultant tax advantages. The Taxable Subsidiaries are not consolidated for U.S. federal income tax purposes and may generate income tax expense as a result of their ownership of the portfolio companies. This income tax expense, if any, is reflected in our Statement of Operations.
| | Our ability to use leverage as a means of financing our portfolio of investments is limited. |
As a BDC, we are required to meet a coverage ratio of total assets to total senior securities of at least 200.0%. For this purpose, senior securities include all borrowings (other than SBA leverage and certain other short-term borrowings) and any preferred stock we may issue in the future. Additionally, our ability to continue to utilize leverage as a means of financing our portfolio of investments may be limited by this asset coverage test.
| | We are required to comply with the provisions of the 1940 Act applicable to business development companies. |
As a BDC, we are required to have a majority of directors who are not interested persons under the 1940 Act. In addition, we are required to comply with other applicable provisions of the 1940 Act, including those requiring the adoption of a code of ethics, fidelity bonding and investment custody arrangements. See Regulation of Business Development Companies below.
Exemptive Relief
The 1940 Act prohibits certain transactions between us, Triangle SBIC, and Triangle SBIC II, as well as our and their affiliates, without first obtaining an exemptive order from the SEC. We and Triangle SBIC initially filed a joint exemptive application with the SEC in 2007 and then received exemptive relief to our amended exemptive application in 2008. In 2010, we jointly filed with Triangle SBIC and Triangle SBIC II another amendment to the exemptive application requesting relief under various sections of the 1940 Act to permit us, as the BDC parent, Triangle SBIC, as a BDC and our SBIC subsidiary, and Triangle SBIC II, as our SBIC subsidiary, to operate effectively as one company for 1940 Act regulatory purposes. Specifically, the application requested relief for us, Triangle SBIC and Triangle SBIC II to (a) engage in certain transactions with each other, (b) invest in securities in which the other is an investor and engage in transactions with portfolio companies that would not otherwise be prohibited if we, Triangle SBIC and Triangle SBIC II were one company, (c) be subject to modified consolidated asset coverage requirements for senior securities issued by Triangle Capital Corporation, Triangle SBIC and Triangle SBIC II as SBIC subsidiaries and (d) allow Triangle SBIC and Triangle SBIC II to file reports under the Securities Exchange Act of 1934 (the Exchange Act) on a consolidated basis with Triangle Capital Corporation, the parent BDC. On October 22, 2010, the SEC issued an exemptive relief order approving our requests.
In addition, under current SEC rules and regulations, BDCs may not grant options or restricted stock to directors who are not officers or employees of the BDC. Similarly, under the 1940 Act, BDCs cannot issue stock
16
Table of Contents
for services to their executive officers and employees other than options, warrants and rights to acquire capital stock. In March 2008, we received an exemptive relief order from the SEC that (a) permits us to grant restricted stock to our independent directors as a part of their compensation for service on our Board and (b) permits us to grant restricted stock in exchange for or in recognition of services by our executive officers and employees.
Regulation of Business Development Companies
The following is a general summary of the material regulatory provisions affecting BDCs. It does not purport to be a complete description of all of the laws and regulations affecting BDCs.
Both we and Triangle SBIC have elected to be regulated as BDCs under the 1940 Act. The 1940 Act contains prohibitions and restrictions relating to transactions between BDCs and their affiliates, principal underwriters and affiliates of those affiliates or underwriters. The 1940 Act requires that a majority of the directors be persons other than interested persons, as that term is defined in the 1940 Act. In addition, the 1940 Act provides that we may not change the nature of our business so as to cease to be, or to withdraw our election as, a BDC unless approved by a majority of our outstanding voting securities.
In addition, the 1940 Act defines a majority of the outstanding voting securities as the lesser of (i) 67.0% or more of the voting securities present at a meeting if the holders of more than 50.0% of our outstanding voting securities are present or represented by proxy, or (ii) 50.0% of our voting securities.
Qualifying Assets
Under the 1940 Act, a BDC may not acquire any asset other than assets of the type listed in Section 55(a) of the 1940 Act, which are referred to as qualifying assets, unless, at the time the acquisition is made, qualifying assets represent at least 70.0% of the companys total assets. The principal categories of qualifying assets relevant to our business are any of the following:
(1) Securities purchased in transactions not involving any public offering from the issuer of such securities, which issuer (subject to certain limited exceptions) is an eligible portfolio company, or from any person who is, or has been during the preceding 13 months, an affiliated person of an eligible portfolio company, or from any other person, subject to such rules as may be prescribed by the SEC. An eligible portfolio company is defined in the 1940 Act and rules adopted pursuant thereto as any issuer which:
(a) is organized under the laws of, and has its principal place of business in, the United States;
(b) is not an investment company (other than an SBIC wholly-owned by the BDC) or a company that would be an investment company but for exclusions under the 1940 Act for certain financial companies such as banks, brokers, commercial finance companies, mortgage companies and insurance companies; and
(c) satisfies any of the following:
(i) does not have any class of securities with respect to which a broker or dealer may extend margin credit;
(ii) is controlled by a BDC or a group of companies including a BDC and the BDC has an affiliated person who is a director of the eligible portfolio company;
(iii) is a small and solvent company having total assets of not more than $4.0 million and capital and surplus of not less than $2.0 million;
(iv) does not have any class of securities listed on a national securities exchange; or
(v) has a class of securities listed on a national securities exchange, but has an aggregate market value of outstanding voting and non-voting common equity of less than $250.0 million.
(2) Securities in companies that were eligible portfolio companies when we made our initial investment if certain other requirements are satisfied.
17
Table of Contents
(3) Securities of any eligible portfolio company that we control.
(4) Securities purchased in a private transaction from a U.S. issuer that is not an investment company or from an affiliated person of the issuer, or in transactions incident thereto, if the issuer is in bankruptcy and subject to reorganization or if the issuer, immediately prior to the purchase of its securities, was unable to meet its obligations as they came due without material assistance (other than conventional lending or financing arrangements).
(5) Securities of an eligible portfolio company purchased from any person in a private transaction if there is no ready market for such securities and we already own 60.0% of the outstanding equity of the eligible portfolio company.
(6) Securities received in exchange for or distributed on or with respect to securities described in (1) through (5) above, or pursuant to the exercise of warrants or rights relating to such securities.
(7) Cash, cash equivalents, U.S. government securities or high-quality debt securities maturing in one year or less from the time of investment.
In addition, a BDC must have been organized and have its principal place of business in the United States and must be operated for the purpose of making investments in the types of securities described in (1), (2), (3), or (4) above.
Managerial Assistance to Portfolio Companies
In order to count portfolio securities as qualifying assets for the purpose of the 70.0% test, we must either control the issuer of the securities or must offer to make available to the issuer of the securities (other than small and solvent companies described above) significant managerial assistance; except that, where we purchase such securities in conjunction with one or more other persons acting together, one of the other persons in the group may make available such managerial assistance. Making available significant managerial assistance means, among other things, any arrangement whereby we, through our directors, officers or employees, offer to provide, and, if accepted, do so provide, significant guidance and counsel concerning the management, operations or business objectives and policies of a portfolio company.
Temporary Investments
Pending investment in other types of qualifying assets, as described above, our investments may consist of cash, cash equivalents, U.S. government securities or high-quality debt securities maturing in one year or less from the time of investment, which we refer to, collectively, as temporary investments, so that 70.0% of our assets are qualifying assets. We may invest in U.S. Treasury bills or in repurchase agreements, provided that such agreements are fully collateralized by cash or securities issued by the U.S. Government or its agencies. A repurchase agreement involves the purchase by an investor, such as us, of a specified security and the simultaneous agreement by the seller to repurchase it at an agreed-upon future date and at a price that is greater than the purchase price by an amount that reflects an agreed-upon interest rate. There is no percentage restriction on the proportion of our assets that may be invested in such repurchase agreements. However, if more than 25.0% of our total assets constitute repurchase agreements from a single counterparty, we would not meet the Diversification Tests (as defined below in Material U.S. Federal Income Tax Considerations-Taxation as a RIC) in order to qualify as a RIC for federal income tax purposes. Thus, we do not intend to enter into repurchase agreements with a single counterparty in excess of this limit. Our management team will monitor the creditworthiness of the counterparties with which we enter into repurchase agreement transactions.
Senior Securities
We are permitted, under specified conditions, to issue multiple classes of debt and one class of stock senior to our common stock if our asset coverage, as defined in the 1940 Act, is at least equal to 200.0% immediately
18
Table of Contents
after each such issuance. In addition, while any senior securities remain outstanding, we must make provisions to prohibit any distribution to our stockholders or the repurchase of such securities or shares unless we meet the applicable asset coverage ratios at the time of the distribution or repurchase. We may also borrow amounts up to 5.0% of the value of our total assets for temporary or emergency purposes without regard to asset coverage. For a discussion of the risks associated with leverage, see Risk Factors Risks Relating to Our Business and Structure Because we intend to distribute substantially all of our income to our stockholders to maintain our status as a regulated investment company, we will continue to need additional capital to finance our growth, and regulations governing our operation as a business development company will affect our ability to, and the way in which we, raise additional capital included in Item 1A of Part I of this Annual Report.
Code of Business Conduct and Ethics and Corporate Governance Guidelines
We have adopted a code of ethics, which we call our Code of Business Conduct and Ethics, and corporate governance guidelines, which collectively cover ethics and business conduct. These documents apply to our directors, officers and employees. Our Code of Business Conduct and Ethics and corporate governance guidelines are available on the Investor Relations section of our website at the following URL: http://ir.tcap.com/governance.cfm. We will report any amendments to or waivers of a required provision of our Code of Business Conduct and Ethics and corporate governance guidelines on our website or in a Current Report on Form 8-K.
Compliance Policies and Procedures
We have adopted and implemented written policies and procedures reasonably designed to prevent violation of the U.S. federal securities laws, and are required to review these compliance policies and procedures annually for their adequacy and the effectiveness of their implementation, and to designate a chief compliance officer to be responsible for administering such policies and procedures. Steven C. Lilly serves as our Chief Compliance Officer.
Proxy Voting Policies and Procedures
We vote proxies relating to our portfolio securities in a manner which we believe will be in the best interest of our stockholders. We review on a case-by-case basis each proposal submitted to a stockholder vote to determine its impact on the portfolio securities held by us. Although we generally vote against proposals that may have a negative impact on our portfolio securities, we may vote for such a proposal if there exists compelling long-term reasons to do so.
Our proxy voting decisions are made by the investment professionals who are responsible for monitoring each of our investments. To ensure that our vote is not the product of a conflict of interest, we require that: (i) anyone involved in the decision making process disclose to our chief compliance officer any potential conflict that he or she is aware of and any contact that he or she has had with any interested party regarding a proxy vote; and (ii) employees involved in the decision making process or vote administration are prohibited from revealing how we intend to vote on a proposal in order to reduce any attempted influence from interested parties.
Stockholders may, without charge, obtain information regarding how we voted proxies with respect to our portfolio securities by making a written request for proxy voting information to: Chief Compliance Officer, 3700 Glenwood Avenue, Suite 530, Raleigh, North Carolina 27612.
Other
We may also be prohibited under the 1940 Act from knowingly participating in certain transactions with our affiliates without the prior approval of our Board of Directors who are not interested persons and, in some cases, prior approval by the SEC.
We are periodically examined by the SEC for compliance with the 1940 Act.
19
Table of Contents
We are required to provide and maintain a bond issued by a reputable fidelity insurance company to protect us against larceny and embezzlement. Furthermore, as a BDC, we are prohibited from protecting any director or officer against any liability to us or our stockholders arising from willful misfeasance, bad faith, gross negligence or reckless disregard of the duties involved in the conduct of such persons office.
Small Business Administration Regulations
Triangle SBIC and Triangle SBIC II are licensed by the Small Business Administration, or SBA, to operate as Small Business Investment Companies, or SBICs, under Section 301(c) of the Small Business Investment Act of 1958. Triangle SBICs SBIC license became effective on September 11, 2003 and Triangle SBIC IIs SBIC license became effective on May 26, 2010.
SBICs are designed to stimulate the flow of private equity capital to eligible small businesses. Under SBA regulations, SBICs may make loans to eligible small businesses, invest in the equity securities of such businesses and provide them with consulting and advisory services. Triangle SBIC and Triangle SBIC II have typically invested in senior and subordinated debt, acquired warrants and/or made equity investments in qualifying small businesses.
Under current SBA regulations, eligible small businesses generally include businesses that (together with their affiliates) have a tangible net worth not exceeding $18.0 million and have average annual net income after federal income taxes not exceeding $6.0 million (average net income to be computed without benefit of any carryover loss) for the two most recent fiscal years. In addition, an SBIC must devote between 20.0% and 25.0% of its investment activity to smaller concerns as defined by the SBA. The exact percentage depends upon, among other factors, the date that the SBIC was licensed, when it obtained leverage commitments, the amount of leverage drawn and when financings occur. A smaller concern generally includes businesses that have a tangible net worth not exceeding $6.0 million and have average annual net income after federal income taxes not exceeding $2.0 million (average net income to be computed without benefit of any net carryover loss) for the two most recent fiscal years. SBA regulations also provide alternative size standard criteria to determine eligibility for designation as an eligible small business or smaller concern, which criteria depend on the industry in which the business is engaged and are based on such factors as the number of employees and gross revenue. However, once an SBIC has invested in a company, it may continue to make follow-on investments in the company, regardless of the size of the portfolio company at the time of the follow-on investment, up to the time of the portfolio companys initial public offering.
The SBA prohibits an SBIC from providing funds to small businesses for certain purposes, such as relending and investment outside the United States, to businesses engaged in a few prohibited industries, and to certain passive (non-operating) companies. In addition, without prior SBA approval, an SBIC may not invest an amount equal to more than 30.0% of the SBICs regulatory capital in any one portfolio company.
The SBA places certain limitations on the financing terms of investments by SBICs in portfolio companies (such as limiting the permissible interest rate on debt securities held by an SBIC in a portfolio company). Although prior regulations prohibited an SBIC from controlling a small business concern except in limited circumstances, regulations adopted by the SBA in 2002 now allow an SBIC to exercise control over a small business for a period of seven years from the date on which the SBIC initially acquires its control position. This control period may be extended for an additional period of time with the SBAs prior written approval.
The SBA restricts the ability of an SBIC to lend money to any of its officers, directors and employees or to invest in affiliates thereof. The SBA also prohibits, without prior SBA approval, a change of control of an SBIC or transfers that would result in any person (or a group of persons acting in concert) owning 10.0% or more of a class of capital stock of a licensed SBIC. A change of control is any event which would result in the transfer of the power, direct or indirect, to direct the management and policies of an SBIC, whether through ownership, contractual arrangements or otherwise.
20
Table of Contents
An SBIC (or group of SBICs under common control) may generally have outstanding debentures guaranteed by the SBA in amounts up to two times (and in certain cases, up to three times) the amount of the regulatory capital of the SBIC(s). Debentures guaranteed by the SBA have a maturity of ten years, require semi-annual payments of interest, do not require any principal payments prior to maturity, and, historically, were subject to certain prepayment penalties. Those prepayment penalties no longer apply as of September 2006. As of December 31, 2011, the maximum statutory limit on the dollar amount of outstanding SBA-guaranteed debentures that may be issued by a single SBIC was $150.0 million and $225.0 million for a group of SBICs under common control. As of December 31, 2011, Triangle SBIC has issued the maximum $150.0 million of SBA-guaranteed debentures and Triangle SBIC II has issued the maximum $75.0 million in face amount of SBA-guaranteed debentures. The weighted average interest rates for all SBA-guaranteed debentures as of December 31, 2011 was 4.83%. As of December 31, 2011, all SBA debentures have been pooled.
SBICs must invest idle funds that are not being used to make loans in investments permitted under SBA regulations in the following limited types of securities: (i) direct obligations of, or obligations guaranteed as to principal and interest by, the United States government, which mature within 15 months from the date of the investment; (ii) repurchase agreements with federally insured institutions with a maturity of seven days or less (and the securities underlying the repurchase obligations must be direct obligations of or guaranteed by the federal government); (iii) certificates of deposit with a maturity of one year or less, issued by a federally insured institution; (iv) a deposit account in a federally insured institution that is subject to a withdrawal restriction of one year or less; (v) a checking account in a federally insured institution; or (vi) a reasonable petty cash fund.
SBICs are periodically examined and audited by the SBAs staff to determine their compliance with SBIC regulations and are periodically required to file certain forms with the SBA. Triangle SBIC and Triangle SBIC II were audited by the SBA during 2011, and no findings were disclosed as a result of the audit.
Neither the SBA nor the U.S. government or any of its agencies or officers has approved any ownership interest to be issued by us or any obligation that we or any of our subsidiaries may incur.
Securities Exchange Act of 1934 and Sarbanes-Oxley Act Compliance
We are subject to the reporting and disclosure requirements of the Exchange Act, including the filing of quarterly, annual and current reports, proxy statements and other required items. In addition, we are subject to the Sarbanes-Oxley Act of 2002, which imposes a wide variety of regulatory requirements on publicly-held companies and their insiders. For example:
| | pursuant to Rule 13a-14 of the Exchange Act, our Chief Executive Officer and Chief Financial Officer are required to certify the accuracy of the financial statements contained in our periodic reports; |
| | pursuant to Item 307 of Regulation S-K, our periodic reports are required to disclose our conclusions about the effectiveness of our disclosure controls and procedures; |
| | pursuant to Rule 13a-15 of the Exchange Act, our management is required to prepare a report regarding its assessment of our internal control over financial reporting, and separately, our independent registered public accounting firm audits our internal controls over financial reporting; and |
| | pursuant to Item 308 of Regulation S-K and Rule 13a-15 of the Exchange Act, our periodic reports must disclose whether there were significant changes in our internal control over financial reporting or in other factors that could significantly affect these controls subsequent to the date of their evaluation, including any corrective actions with regard to significant deficiencies and material weaknesses. |
The New York Stock Exchange Corporate Governance Regulations
The NYSE has adopted corporate governance regulations that listed companies must comply with. We believe we are in compliance with such corporate governance listing standards. We intend to monitor our compliance with all future listing standards and to take all necessary actions to ensure that we stay in compliance.
21
Table of Contents
Material U.S. Federal Income Tax Considerations
The following discussion is a general summary of the material U.S. federal income tax considerations applicable to us and to an investment in our shares. This summary does not purport to be a complete description of the income tax considerations applicable to us or to investors with respect to an investment in shares of our common stock. For example, we have not described tax consequences that we assume to be generally known by investors or certain considerations that may be relevant to certain types of holders subject to special treatment under U.S. federal income tax laws, including stockholders subject to the alternative minimum tax, tax-exempt organizations, insurance companies, dealers in securities, pension plans and trusts, financial institutions, U.S. stockholders (as defined below) whose functional currency is not the U.S. dollar, persons who mark-to-market our shares and persons who hold our shares as part of a straddle, hedge or conversion transaction. This summary assumes that investors hold shares of our common stock as capital assets (within the meaning of the Code). The discussion is based upon the Code, Treasury regulations, and administrative and judicial interpretations, each as of the date of this Annual Report on Form 10-K and all of which are subject to change, possibly retroactively, which could affect the continuing validity of this discussion. This summary does not discuss any aspects of U.S. estate or gift tax or foreign, state or local tax. It does not discuss the special treatment under U.S. federal income tax laws that could result if we invested in tax-exempt securities or certain other investment assets.
For purposes of our discussion, a U.S. stockholder means a beneficial owner of shares of our common stock that is for U.S. federal income tax purposes:
| | a citizen or individual resident of the United States; |
| | a corporation, or other entity treated as a corporation for U.S. federal income tax purposes, created or organized in or under the laws of the United States or any state thereof or the District of Columbia; |
| | an estate, the income of which is subject to U.S. federal income taxation regardless of its source; or |
| | a trust if (1) a U.S. court is able to exercise primary supervision over the administration of such trust and one or more U.S. persons have the authority to control all substantial decisions of the trust or (2) it has a valid election in place to be treated as a U.S. person. |
For purposes of our discussion, a Non-U.S. stockholder means a beneficial owner of shares of our common stock that is neither a U.S. stockholder nor a partnership (including an entity treated as a partnership for U.S. federal income tax purposes).
If a partnership (including an entity treated as a partnership for U.S. federal income tax purposes) holds shares of our common stock, the tax treatment of a partner or member of the partnership will generally depend upon the status of the partner and the activities of the partnership. A prospective stockholder that is a partner in a partnership holding shares of our common stock should consult his, her or its tax advisors with respect to the purchase, ownership and disposition of shares of our common stock.
Tax matters are very complicated and the tax consequences to an investor of an investment in our shares will depend on the facts of his, her or its particular situation. We encourage investors to consult their own tax advisors regarding the specific consequences of such an investment, including tax reporting requirements, the applicability of U.S. federal, state, local and foreign tax laws, eligibility for the benefits of any applicable tax treaty and the effect of any possible changes in the tax laws.
Election to be Taxed as a RIC
We have qualified and elected to be treated as a RIC under Subchapter M of the Code commencing with our taxable year ended December 31, 2007. As a RIC, we generally are not subject to corporate-level U.S. federal income taxes on any income that we distribute to our stockholders from our tax earnings and profits. To qualify
22
Table of Contents
as a RIC, we must, among other things, meet certain source-of-income and asset diversification requirements (as described below). In addition, in order to obtain RIC tax treatment, we must distribute to our stockholders, for each taxable year, at least 90% of our investment company taxable income, which is generally our net ordinary income plus the excess, if any, of realized net short-term capital gain over realized net long-term capital loss, or the Annual Distribution Requirement. Depending on the level of taxable income earned in a tax year, we may choose to carry forward taxable income in excess of current year distributions into the next tax year and pay a 4% excise tax on such income. Any such carryover taxable income must be distributed through a dividend declared prior to filing the final tax return related to the year which generated such taxable income. Even if we qualify as a RIC, we generally will be subject to corporate-level U.S. federal income tax on our undistributed taxable income and could be subject to U.S. federal excise, state, local and foreign taxes.
Taxation as a RIC
Provided that we qualify as a RIC and satisfy the Annual Distribution Requirement, we will not be subject to U.S. federal income tax on the portion of our investment company taxable income and net capital gain (which we define as net long-term capital gain in excess of net short-term capital loss) that we timely distribute to stockholders. We will be subject to U.S. federal income tax at the regular corporate rates on any income or capital gain not distributed (or deemed distributed) to our stockholders.
We will be subject to a 4% nondeductible U.S. federal excise tax on certain undistributed income of RICs unless we distribute in a timely manner an amount at least equal to the sum of (1) 98.0% of our ordinary income for each calendar year, (2) 98.2% of our capital gain net income for the calendar year and (3) any income recognized, but not distributed, in preceding years and on which we paid no U.S. federal income tax.
In order to qualify as a RIC for U.S. federal income tax purposes, we must, among other things:
| | elect to be treated as a RIC; |
| | meet the Annual Distribution Requirement; |
| | qualify to be treated as a BDC or be registered as a management investment company under the 1940 Act at all times during each taxable year; |
| | derive in each taxable year at least 90% of our gross income from dividends, interest, payments with respect to certain securities loans, gains from the sale or other disposition of stock or other securities or foreign currencies or other income derived with respect to our business of investing in such stock, securities or currencies and net income derived from an interest in a qualified publicly traded partnership (as defined in the Code), or the 90% Income Test; and |
| | diversify our holdings so that at the end of each quarter of the taxable year: |
| | at least 50% of the value of our assets consists of cash, cash equivalents, U.S. Government securities, securities of other RICs, and other securities if such other securities of any one issuer do not represent more than 5% of the value of our assets or more than 10% of the outstanding voting securities of the issuer (which for these purposes includes the equity securities of a qualified publicly traded partnership); and |
| | no more than 25% of the value of our assets is invested in the securities, other than U.S. Government securities or securities of other RICs, (i) of one issuer (ii) of two or more issuers that are controlled, as determined under applicable tax rules, by us and that are engaged in the same or similar or related trades or businesses or (iii) of one or more qualified publicly traded partnerships, or the Diversification Tests. |
To the extent that we invest in entities treated as partnerships for U.S. federal income tax purposes (other than a qualified publicly traded partnership), we generally must include the items of gross income derived by
23
Table of Contents
the partnerships for purposes of the 90% Income Test, and the income that is derived from a partnership (other than a qualified publicly traded partnership) will be treated as qualifying income for purposes of the 90% Income Test only to the extent that such income is attributable to items of income of the partnership which would be qualifying income if realized by us directly. In addition, we generally must take into account our proportionate share of the assets held by partnerships (other than a qualified publicly traded partnership) in which we are a partner for purposes of the Diversification Tests.
In order to meet the 90% Income Test, we have established several special purpose corporations (any such corporation, a Taxable Subsidiary) and may, in the future establish additional Taxable Subsidiaries to hold assets from which we do not anticipate earning dividend, interest or other qualifying income under the 90% Income Test. Any investments held through a Taxable Subsidiary generally are subject to U.S. federal income and other taxes, and therefore we can expect to achieve a reduced after-tax yield on such investments.
We may be required to recognize taxable income in circumstances in which we do not receive a corresponding payment in cash. For example, if we hold debt obligations that are treated under applicable tax rules as having original issue discount (such as debt instruments with payment-in-kind interest or, in certain cases, increasing interest rates or issued with warrants), we must include in income each year a portion of the original issue discount that accrues over the life of the obligation, regardless of whether cash representing such income is received by us in the same taxable year. We may also have to include in income other amounts that we have not yet received in cash, such as deferred loan origination fees that are paid after origination of the loan or are paid in non-cash compensation such as warrants or stock. We anticipate that a portion of our income may constitute original issue discount or other income required to be included in taxable income prior to receipt of cash.
Because any original issue discount or other amounts accrued will be included in our investment company taxable income for the year of the accrual, we may be required to make a distribution to our stockholders in order to satisfy the Annual Distribution Requirement, even though we will not have received any corresponding cash amount. As a result, we may have difficulty meeting the annual distribution requirement necessary to obtain and maintain RIC tax treatment under the Code. We may have to sell some of our investments at times and/or at prices we would not consider advantageous, raise additional debt or equity capital or forgo new investment opportunities for this purpose. If we are not able to obtain cash from other sources, we may fail to qualify for RIC tax treatment and thus become subject to corporate-level income tax.
Furthermore, a portfolio company in which we invest may face financial difficulty that requires us to work-out, modify or otherwise restructure our investment in the portfolio company. Any such restructuring may result in unusable capital losses and future non-cash income. Any restructuring may also result in our recognition of a substantial amount of non-qualifying income for purposes of the 90% Income Test, such as cancellation of indebtedness income in connection with the work-out of a leveraged investment (which, while not free from doubt, may be treated as non-qualifying income) or the receipt of other non-qualifying income.
Gain or loss realized by us from warrants acquired by us as well as any loss attributable to the lapse of such warrants generally will be treated as capital gain or loss. Such gain or loss generally will be long-term or short-term, depending on how long we held a particular warrant.
Investments by us in non-U.S. securities may be subject to non-U.S. income, withholding and other taxes, and therefore, our yield on any such securities may be reduced by such non-U.S. taxes. Stockholders will generally not be entitled to claim a credit or deduction with respect to non-U.S. taxes paid by us.
If we purchase shares in a passive foreign investment company, or PFIC, we may be subject to U.S. federal income tax on a portion of any excess distribution or gain from the disposition of such shares even if such income is distributed as a taxable dividend by us to our stockholders. Additional charges in the nature of interest may be imposed on us in respect of deferred taxes arising from such distributions or gains. If we invest in
24
Table of Contents
a PFIC and elect to treat the PFIC as a qualified electing fund under the Code, or QEF, in lieu of the foregoing requirements, we will be required to include in income each year a portion of the ordinary earnings and net capital gain of the QEF, even if such income is not distributed to it. Alternatively, we can elect to mark-to-market at the end of each taxable year our shares in a PFIC; in this case, we will recognize as ordinary income any increase in the value of such shares and as ordinary loss any decrease in such value to the extent it does not exceed prior increases included in income. Under either election, we may be required to recognize in a year income in excess of our distributions from PFICs and our proceeds from dispositions of PFIC stock during that year, and such income will nevertheless be subject to the Annual Distribution Requirement and will be taken into account for purposes of the 4% excise tax.
Under Section 988 of the Code, gain or loss attributable to fluctuations in exchange rates between the time we accrue income, expenses, or other liabilities denominated in a foreign currency and the time we actually collect such income or pay such expenses or liabilities are generally treated as ordinary income or loss. Similarly, gain or loss on foreign currency forward contracts and the disposition of debt denominated in a foreign currency, to the extent attributable to fluctuations in exchange rates between the acquisition and disposition dates, are also treated as ordinary income or loss.
Although we do not presently expect to do so, we are authorized to borrow funds and to sell assets in order to satisfy distribution requirements. However, under the 1940 Act, we are not permitted to make distributions to our stockholders while our debt obligations and other senior securities are outstanding unless certain asset coverage tests are met. See Regulation of Business Development Companies Qualifying Assets and Regulation of Business Development Companies Senior Securities. Moreover, our ability to dispose of assets to meet our distribution requirements may be limited by (1) the illiquid nature of our portfolio and/or (2) other requirements relating to our status as a RIC, including the Diversification Tests. If we dispose of assets in order to meet the Annual Distribution Requirement or to avoid the excise tax, we may make such dispositions at times that, from an investment standpoint, are not advantageous.
If we fail to satisfy the Annual Distribution Requirement or otherwise fail to qualify as a RIC in any taxable year, we will be subject to tax in that year on all of our taxable income, regardless of whether we make any distributions to our stockholders. In that case, all of such income will be subject to corporate-level U.S. federal income tax, reducing the amount available to be distributed to our stockholders. See Failure To Obtain RIC Tax Treatment.
As a RIC, we are not allowed to carry forward or carry back a net operating loss for purposes of computing our investment company taxable income in other taxable years. U.S. federal income tax law generally permits a RIC to carry forward (i) the excess of its net short-term capital loss over its net long-term capital gain for a given year as a short-term capital loss arising on the first day of the following year and (ii) the excess of its net long-term capital loss over its net short-term capital gain for a given year as a long-term capital loss arising on the first day of the following year. However, future transactions we engage in may cause our ability to use any capital loss carryforwards, and unrealized losses once realized, to be limited under Section 382 of the Code. Certain of our investment practices may be subject to special and complex U.S. federal income tax provisions that may, among other things, (i) disallow, suspend or otherwise limit the allowance of certain losses or deductions, (ii) convert lower taxed long-term capital gain and qualified dividend income into higher taxed short-term capital gain or ordinary income, (iii) convert an ordinary loss or a deduction into a capital loss (the deductibility of which is more limited), (iv) cause us to recognize income or gain without a corresponding receipt of cash, (v) adversely affect the time as to when a purchase or sale of stock or securities is deemed to occur, (vi) adversely alter the characterization of certain complex financial transactions, and (vii) produce income that will not be qualifying income for purposes of the 90% Income Test. We will monitor our transactions and may make certain tax elections in order to mitigate the effect of these provisions.
As described above, to the extent that we invest in equity securities of entities that are treated as partnerships for U.S. federal income tax purposes, the effect of such investments for purposes of the 90% Income
25
Table of Contents
Test and the Diversification Tests will depend on whether or not the partnership is a qualified publicly traded partnership (as defined in the Code). If the partnership is a qualified publicly traded partnership, the net income derived from such investments will be qualifying income for purposes of the 90% Income Test and will be securities for purposes of the Diversification Tests. If the partnership, however, is not treated as a qualified publicly traded partnership, then the consequences of an investment in the partnership will depend upon the amount and type of income and assets of the partnership allocable to us. The income derived from such investments may not be qualifying income for purposes of the 90% Income Test and, therefore, could adversely affect our qualification as a RIC. We intend to monitor our investments in equity securities of entities that are treated as partnerships for U.S. federal income tax purposes to prevent our disqualification as a RIC.
We may invest in preferred securities or other securities the U.S. federal income tax treatment of which may not be clear or may be subject to recharacterization by the IRS. To the extent the tax treatment of such securities or the income from such securities differs from the expected tax treatment, it could affect the timing or character of income recognized, requiring us to purchase or sell securities, or otherwise change our portfolio, in order to comply with the tax rules applicable to RICs under the Code.
Failure to Obtain RIC Tax Treatment
If we fail to satisfy the 90% Income Test or the Diversification Tests for any taxable year, we may nevertheless continue to qualify as a RIC for such year if certain relief provisions are applicable (which may, among other things, require us to pay certain corporate-level federal taxes or to dispose of certain assets).
If we were unable to obtain tax treatment as a RIC, we would be subject to tax on all of our taxable income at regular corporate rates. We would not be able to deduct distributions to stockholders, nor would they be required to be made. Distributions would generally be taxable to our stockholders as dividend income to the extent of our current and accumulated earnings and profits (in the case of non-corporate U.S. stockholders, at a maximum rate applicable to qualified dividend income of 15% through 2012). Subject to certain limitations under the Code, corporate recipients would be eligible for the dividends-received deduction. Distributions in excess of our current and accumulated earnings and profits would be treated first as a return of capital to the extent of the stockholders tax basis, and any remaining distributions would be treated as a capital gain.
If we fail to meet the RIC requirements for more than two consecutive years and then, seek to re-qualify as a RIC, we would be subject to corporate-level taxation on any built-in gain recognized during the succeeding 10-year period unless we made a special election to recognize all such built-in gain upon our re-qualification as a RIC and to pay the corporate-level tax on such built-in gain.
Taxation of U.S. Stockholders
Whether an investment in shares of our common stock is appropriate for a U.S. stockholder will depend upon that persons particular circumstances. An investment in shares of our common stock by a U.S. stockholder may have adverse tax consequences. The following summary generally describes certain U.S. federal income tax consequences of an investment in shares of our common stock by taxable U.S. stockholders and not by U.S. stockholders that are generally exempt from U.S. federal income taxation. U.S. stockholders should consult their own tax advisors before making an investment in our common stock.
Distributions by us generally are taxable to U.S. stockholders as ordinary income or capital gain. Distributions of our investment company taxable income (which is, generally, our ordinary income excluding net capital gain) will be taxable as ordinary income to U.S. stockholders to the extent of our current or accumulated earnings and profits, whether paid in cash or reinvested in additional common stock. To the extent such distributions paid by us to non-corporate U.S. stockholders (including individuals) are attributable to dividends from U.S. corporations and certain qualified foreign corporations, such distributions generally will be eligible for taxation at rates applicable to qualifying dividends (at a maximum tax rate of 15% through 2012)
26
Table of Contents
provided that we properly report such distribution as qualified dividend income in a written statement furnished to our stockholders and certain holding period and other requirements are satisfied. In this regard, it is not anticipated that a significant portion of distributions paid by us will be attributable to qualifying dividends; therefore, our distributions generally will not qualify for the preferential rates applicable to qualified dividend income. Distributions of our net capital gain (which is generally our net long-term capital gain in excess of net short-term capital loss) properly designated by us as capital gain dividends will be taxable to a U.S. stockholder as long-term capital gain (at a maximum rate of 15% through 2012 in the case of individuals, trusts or estates), regardless of the U.S. stockholders holding period for his, her or its common stock and regardless of whether paid in cash or reinvested in additional common stock. Distributions in excess of our current and accumulated earnings and profits first will reduce a U.S. stockholders adjusted tax basis in such stockholders common stock and, after the adjusted basis is reduced to zero, will constitute capital gain to such U.S. stockholder.
Although we currently intend to distribute any long-term capital gain at least annually, we may in the future decide to retain some or all of our long-term capital gain, but designate the retained amount as a deemed distribution. In that case, among other consequences, we will pay tax on the retained amount, each U.S. stockholder will be required to include his, her or its proportionate share of the deemed distribution in income as if it had been actually distributed to the U.S. stockholder, and the U.S. stockholder will be entitled to claim a credit equal to his, her or its allocable share of the tax paid thereon by us. The amount of the deemed distribution net of such tax will be added to the U.S. stockholders tax basis for his, her or its common stock. Since we expect to pay tax on any retained capital gain at our regular corporate tax rate, and since that rate is in excess of the maximum rate currently payable by individuals on net capital gain, the amount of tax that individual stockholders will be treated as having paid and for which they will receive a credit will exceed the tax they owe on the retained net capital gain. Such excess generally may be claimed as a credit against the U.S. stockholders other U.S. federal income tax obligations or may be refunded to the extent it exceeds a stockholders liability for U.S. federal income tax. A stockholder that is not subject to U.S. federal income tax or otherwise required to file a U.S. federal income tax return would be required to file a U.S. federal income tax return on the appropriate form in order to claim a refund for the taxes we paid. In order to utilize the deemed distribution approach, we must provide written notice to our stockholders prior to the expiration of 60 days after the close of the relevant taxable year. We cannot treat any of our investment company taxable income as a deemed distribution.
We could be subject to the alternative minimum tax, or the AMT, but any items that are treated differently for AMT purposes must be apportioned between us and our stockholders and this may affect U.S. stockholders AMT liabilities. Although regulations explaining the precise method of apportionment have not yet been issued, such items will generally be apportioned in the same proportion that distributions paid to each stockholder bear to our taxable income (determined without regard to the dividends paid deduction), unless a different method for a particular item is warranted under the circumstances.
For purposes of determining (1) whether the Annual Distribution Requirement is satisfied for any year and (2) the amount of capital gain dividends paid for that year, we may, under certain circumstances, elect to treat a dividend that is paid during the following taxable year as if it had been paid during the taxable year in question. If we make such an election, the U.S. stockholder will still be treated as receiving the dividend in the taxable year in which the distribution is made. However, any dividend declared by us in October, November or December of any calendar year, payable to stockholders of record on a specified date in any such month and actually paid during January of the following year, will be treated as if it had been received by our U.S. stockholders on December 31 of the year in which the dividend was declared.
If an investor purchases shares of our common stock shortly before the record date of a distribution, the price of the shares will include the value of the distribution, and the investor will be subject to tax on the distribution even though it represents a return of his, her or its investment.
A U.S. stockholder generally will recognize taxable gain or loss if the stockholder sells or otherwise disposes of his, her or its shares of our common stock. The amount of gain or loss will be measured by the
27
Table of Contents
difference between such stockholders adjusted tax basis in the common stock sold and the amount of the proceeds received in exchange. Any gain arising from such sale or disposition generally will be treated as long-term capital gain or loss if the stockholder has held his, her or its shares for more than one year. Otherwise, it will be classified as short-term capital gain or loss. However, any capital loss arising from the sale or disposition of shares of our common stock held for six months or less will be treated as long-term capital loss to the extent of the amount of capital gain dividends received, or undistributed capital gain deemed received, with respect to such shares. In addition, all or a portion of any loss recognized upon a disposition of shares of our common stock may be disallowed if other substantially identical shares are purchased (whether through reinvestment of distributions or otherwise) within 30 days before or after the disposition. The ability to otherwise deduct capital loss may be subject to other limitations under the Code.
In general, non-corporate U.S. stockholders, including individuals, trusts and estates, are subject to U.S. federal income tax (at a maximum rate of 15% through 2012) on their net capital gain, or the excess of realized net long-term capital gain over realized net short-term capital loss for a taxable year, including a long-term capital gain derived from an investment in our shares. Such rate is lower than the maximum rate on ordinary income currently payable by individuals. Corporate U.S. stockholders currently are subject to U.S. federal income tax on net capital gain at the maximum 35% rate also applied to ordinary income. Non-corporate stockholders with net capital loss for a year (which we define as capital loss in excess of capital gain) generally may deduct up to $3,000 of such losses against their ordinary income each year; any net capital loss of a non-corporate stockholder in excess of $3,000 generally may be carried forward and used in subsequent years as provided in the Code. Corporate stockholders generally may not deduct any net capital loss for a year, but may carry back such losses for three years or carry forward such losses for five years.
For taxable years beginning after December 31, 2012, certain U.S. stockholders who are individuals, estates or trusts generally will be subject to a 3.8% Medicare tax on, among other things, dividends on, and capital gain from the sale or other disposition of, shares of our common stock.
A publicly offered RIC is a RIC whose shares are either (i) continuously offered pursuant to a public offering, (ii) regularly traded on an established securities market or (iii) held by at least 500 persons at all times during the taxable year. If we are not a publicly offered RIC for any period, a non-corporate stockholders pro rata portion of our affected expenses, including our management fees, will be treated as an additional dividend to the stockholder and will be deductible by such stockholder only to the extent permitted under the limitations described below. For non-corporate stockholders, including individuals, trusts, and estates, significant limitations generally apply to the deductibility of certain expenses of a non-publicly offered RIC, including advisory fees. In particular, these expenses, referred to as miscellaneous itemized deductions, are deductible only to individuals to the extent they exceed 2% of such a stockholders adjusted gross income, and are not deductible for AMT purposes. While we anticipate that we will constitute a publicly offered RIC after our first tax year, there can be no assurance that we will in fact so qualify for any of our taxable years.
We will send to each of our U.S. stockholders, as promptly as possible after the end of each calendar year, a written statement detailing, on a per share and per distribution basis, the amounts includible in such U.S. stockholders taxable income for such year as ordinary income and as long-term capital gain. In addition, the U.S. federal tax status of each years distributions generally will be reported to the IRS (including the amount of dividends, if any, eligible for the current 15% maximum rate). Distributions paid by us generally will not be eligible for the dividends-received deduction or the preferential tax rate applicable to qualifying dividends. Distributions may also be subject to additional state, local and foreign taxes depending on a U.S. stockholders particular situation.
We may be required to withhold U.S. federal income tax, or backup withholding (at a rate of 28% through 2012), from all taxable distributions to any non-corporate U.S. stockholder (1) who fails to furnish us with a correct taxpayer identification number or a certificate that such stockholder is exempt from backup withholding or (2) with respect to whom the IRS notifies us that such stockholder has failed to properly report certain interest
28
Table of Contents
and dividend income to the IRS and to respond to notices to that effect. An individuals taxpayer identification number is his or her social security number. Backup withholding tax is not an additional tax, and any amount withheld may be refunded or credited against the U.S. stockholders U.S. federal income tax liability, provided that proper information is timely provided to the IRS.
For taxable years beginning after December 31, 2013, if certain disclosure requirements related to U.S. accounts or ownership are not satisfied, a U.S. federal withholding tax at a 30% rate will be imposed on dividends received by U.S. stockholders that own their stock through foreign accounts or foreign intermediaries. In addition, for taxable years beginning after December 31, 2014, if certain disclosure requirements related to U.S. accounts or ownership are not satisfied, a U.S. federal withholding tax at a 30% rate will be imposed on proceeds of sale in respect of our stock received by U.S. stockholders that own their stock through foreign accounts or foreign intermediaries. We will not pay any additional amounts in respect of any amounts withheld.
Under U.S. Treasury regulations, if a stockholder recognizes a loss with respect to shares of our stock of $2 million or more for an individual, S corporation, trust, or a partnership with at least one non-corporate partner or $10 million or more for a stockholder that is either a corporation or a partnership with only corporate partners in any single taxable year (or a greater loss over a combination of years), the stockholder must file with the IRS a disclosure statement on IRS Form 8886 (or successor form). Direct stockholders of portfolio securities in many cases are exempted from this reporting requirement, but under current guidance, stockholders of a RIC are not exempted. Future guidance may extend the current exception from this reporting requirement to stockholders of most or all RICs. The fact that a loss is reportable under these regulations does not affect the legal determination of whether the taxpayers treatment of the loss is proper. Significant monetary penalties apply to a failure to comply with this reporting requirement. States may also have a similar reporting requirement. Stockholders should consult their own tax advisors to determine the applicability of these regulations in light of their individual circumstances.
Taxation of Non-U.S. Stockholders
Whether an investment in the shares is appropriate for a Non-U.S. stockholder will depend upon that persons particular circumstances. An investment in the shares by a Non-U.S. stockholder may have adverse tax consequences. Non-U.S. stockholders should consult their tax advisers before investing in our common stock.
Distributions of our investment company taxable income to Non-U.S. stockholders that are not effectively connected with a U.S. trade or business carried on by the Non-U.S. stockholder, will generally be subject to withholding of U.S. federal income tax at a rate of 30% (or lower rate provided by an applicable treaty) to the extent of our current and accumulated earnings and profits, unless an applicable exception applies. For taxable years beginning before 2012, however, we generally will not be required to withhold any amounts with respect to distributions of (i) U.S.-source interest income that would not have been subject to withholding of U.S. federal income tax if they had been earned directly by a Non-U.S. stockholder, and (ii) net short-term capital gains in excess of net long-term capital losses that would not have been subject to withholding of U.S. federal income tax if they had been earned directly by a Non-U.S. stockholder, in each case only to the extent that such distributions are properly reported by us as interest-related dividends or short-term capital gain dividends, as the case may be, and certain other requirements are met.
Actual or deemed distributions of our net capital gain to a Non-U.S. stockholder, and gains realized by a Non-U.S. stockholder upon the sale of our common stock, that are not effectively connected with a U.S. trade or business carried on by the Non-U.S. stockholder, will generally not be subject to U.S. federal withholding tax and generally will not be subject to U.S. federal income tax unless the Non-U.S. stockholder is a nonresident alien individual and is physically present in the United States for more than 182 days during the taxable year and meets certain other requirements. However, withholding of U.S. federal income tax at a rate of 30% on capital gain of nonresident alien individuals who are physically present in the United States for more than the 182 day period only applies in exceptional cases because any individual present in the United States for more than 182 days during the
29
Table of Contents
taxable year is generally treated as a resident for U.S. income tax purposes; in that case, he or she would be subject to U.S. income tax on his or her worldwide income at the graduated rates applicable to U.S. citizens, rather than the 30% U.S. federal withholding tax.
If we distribute our net capital gain in the form of deemed rather than actual distributions (which we may do in the future), a Non-U.S. stockholder will be entitled to a U.S. federal income tax credit or tax refund equal to the stockholders allocable share of the tax we pay on the capital gain deemed to have been distributed. In order to obtain the refund, the Non-U.S. stockholder must obtain a U.S. taxpayer identification number and file a U.S. federal income tax return even if the Non-U.S. stockholder would not otherwise be required to obtain a U.S. taxpayer identification number or file a U.S. federal income tax return. Accordingly, investment in the shares may not be appropriate for a Non-U.S. stockholder.
Distributions of our investment company taxable income and net capital gain (including deemed distributions) to Non-U.S. stockholders, and gain realized by Non-U.S. stockholders upon the sale of our common stock that is effectively connected with a U.S. trade or business carried on by the Non-U.S. stockholder (or if an income tax treaty applies, attributable to a permanent establishment in the United States), will be subject to U.S. federal income tax at the graduated rates applicable to U.S. citizens, residents and domestic corporations. Corporate Non-U.S. stockholders may also be subject to an additional branch profits tax at a rate of 30% imposed by the Code (or lower rate provided by an applicable treaty). In the case of a non-corporate Non-U.S. stockholder, we may be required to withhold U.S. federal income tax from distributions that are otherwise exempt from withholding tax (or taxable at a reduced rate) unless the Non-U.S. stockholder certifies his or her foreign status under penalties of perjury or otherwise establishes an exemption.
The tax consequences to a Non-U.S. stockholder entitled to claim the benefits of an applicable tax treaty may differ from those described herein. Non-U.S. stockholders are advised to consult their own tax advisers with respect to the particular tax consequences to them of an investment in our shares.
A Non-U.S. stockholder who is a nonresident alien individual may be subject to information reporting and backup withholding of U.S. federal income tax on dividends unless the Non-U.S. stockholder provides us or the dividend paying agent with an IRS Form W-8BEN (or an acceptable substitute form) or otherwise meets documentary evidence requirements for establishing that it is a Non-U.S. stockholder or otherwise establishes an exemption from backup withholding.
For taxable years beginning after December 31, 2013, if certain disclosure requirements related to U.S. accounts or ownership are not satisfied, a U.S. federal withholding tax at a 30% rate will be imposed on dividends received by certain Non-U.S. stockholders. In addition, for taxable years beginning after December 31, 2014, if certain disclosure requirements related to U.S. accounts or ownership are not satisfied, a U.S. federal withholding tax at a 30% rate will be imposed on proceeds of sale in respect of shares of our common stock received by certain Non-U.S. stockholders. If payment of withholding taxes is required, Non-U.S. stockholders that are otherwise eligible for an exemption from, or reduction of, U.S. federal withholding taxes with respect to such dividends and proceeds will be required to seek a refund from the IRS to obtain the benefit of such exemption or reduction. We will not pay any additional amounts in respect of any amounts withheld.
Non-U.S. persons should consult their own tax advisors with respect to the U.S. federal income tax and withholding tax, and state, local and foreign tax consequences of an investment in the shares.
Sunset of Reduced Tax Rate Provisions
Certain tax laws providing for certain reduced tax rates described herein are subject to sunset provisions. The sunset provisions generally provide that for taxable years beginning after December 31, 2012, certain provisions that are currently in the Code will revert back to a prior version of those provisions. Such provisions include those related to the reduced maximum income tax rates generally applicable to ordinary income, long-term capital gain and qualified dividend income recognized by certain non-corporate taxpayers and certain other
30
Table of Contents
tax rate provisions described herein. The impact of this reversion is not discussed herein. Consequently, prospective stockholders should consult their own tax advisors regarding the effect of these sunset provisions on an investment in our common stock.
Possible Legislative or Other Actions Affecting Tax Considerations
Prospective investors should recognize that the present U.S. federal income tax treatment of an investment in our stock may be modified by legislative, judicial or administrative action at any time, and that any such action may affect investments and commitments previously made. The rules dealing with U.S. federal income taxation are constantly under review by persons involved in the legislative process any by the IRS and the U.S. Treasury Department, resulting in revisions of regulations and revised interpretations of established concepts as well as statutory changes. Revisions in U.S. federal tax laws and interpretations thereof could adversely affect the tax consequences of an investment in our stock.
State and Local Tax Treatment
The state and local treatment may differ from federal income tax treatment.
The discussion set forth herein does not constitute tax advice, and potential investors should consult their own tax advisors concerning the tax considerations relevant to their particular situation.
Available Information
We intend to make this Annual Report, as well as our quarterly reports on Form 10-Q, our current reports on Form 8-K and, if applicable, amendments to those reports filed or furnished pursuant to Section 13(a) of the Exchange Act, publicly available on our website (www.tcap.com) without charge as soon as reasonably practicable following our filing of such reports with the Securities and Exchange Commission (SEC). Our SEC reports can be accessed through the investor relations section of our website. The information found on our website is not part of this or any other report we file with or furnish to the SEC. We assume no obligation to update or revise any forward looking statements in this Annual Report or in other reports filed with the SEC, whether as a result of new information, future events or otherwise, unless we are required to do so by law. A copy of this Annual Report and our other reports is available without charge upon written request to Investor Relations, Triangle Capital Corporation, 3700 Glenwood Avenue, Suite 530, Raleigh, North Carolina 27612.
Further, a copy of this Annual Report is obtainable from the SECs Public Reference Room at 100 F Street, N.E., Washington, D.C. 20549. Information on the operation of the Public Reference Room can be obtained by calling the SEC at 1-800-SEC-0330. The SEC maintains an internet site that contains reports, proxy and information statements and our other filings at www.sec.gov.
We have adopted a code of ethics, which we call our Code of Business Conduct and Ethics, which every director, officer and employee is expected to observe. Our Code of Business Conduct and Ethics is publicly available on our website under Corporate Governance at the following URL: http://ir.tcap.com/governance.cfm and is referenced in this Annual Report as Exhibit 14.1.
| Item 1A. | Risk Factors. |
As indicated above in this Annual Report under Forward-Looking Statements, those statements in this Annual Report that are not historical facts may be forward-looking statements within the meaning of the Private Securities Litigation Reform Act of 1995. The risks set out below are not the only risks we face. Additional risks and uncertainties not presently known to us or not presently deemed material by us might also impair our operations and performance. If any of the following events occur, our business, financial condition and results of operations could be materially and adversely affected. In such case, our net asset value and the trading price of our securities could decline, and you may lose all or part of your investment.
31
Table of Contents
Risks Relating to Our Business and Structure
Our financial condition and results of operations will depend on our ability to manage and deploy capital effectively.
Our ability to continue to achieve our investment objectives will depend on our ability to effectively manage and deploy our capital, which will depend, in turn, on our management teams ability to continue to identify, evaluate, invest in, and monitor companies that meet our investment criteria. We cannot assure you that we will continue to achieve our investment objectives.
Accomplishing this result on a cost-effective basis will be largely a function of our management teams handling of the investment process, its ability to provide competent, attentive and efficient services and our access to investments offering acceptable terms. In addition to monitoring the performance of our existing investments, members of our management team and our investment professionals may also be called upon to provide managerial assistance to our portfolio companies. These demands on their time may distract them or slow the rate of investment.
Even if we are able to grow and build upon our investment operations in a manner commensurate with the increased capital available to us as a result of recent offerings of our securities, any failure to manage our growth effectively could have a material adverse effect on our business, financial condition, results of operations and prospects. The results of our operations will depend on many factors, including the availability of opportunities for investment, readily accessible short and long-term funding alternatives in the financial markets and economic conditions. Furthermore, if we cannot successfully operate our business or implement our investment policies and strategies as described in this Annual Report, it could negatively impact our ability to pay distributions and cause you to lose part or all of your investment.
Recent market conditions have impacted debt and equity capital markets in the United States, and we do not know if these conditions will improve in the near future.
Beginning in the third quarter of 2007, global credit and other financial markets began to suffer substantial stress, volatility, illiquidity and disruption. These forces reached extraordinary levels in late 2008, resulting in the bankruptcy of, the acquisition of, or government intervention in the affairs of several major domestic and international financial institutions. In particular, the financial services sector was negatively impacted by significant write-offs as the value of the assets held by financial firms declined, impairing their capital positions and abilities to lend and invest. We believe that such value declines were exacerbated by widespread forced liquidations as leveraged holders of financial assets, faced with declining prices, were compelled to sell to meet margin requirements and maintain compliance with applicable capital standards. Such forced liquidations also impaired or eliminated many investors and investment vehicles, leading to a decline in the supply of capital for investment and depressed pricing levels for many assets. These events significantly diminished overall confidence in the debt and equity markets, engendered unprecedented declines in the values of certain assets, and caused extreme economic uncertainty.
Further, recent U.S. debt ceiling and budget deficit concerns, together with signs of deteriorating sovereign debt conditions in Europe, have increased the possibility of additional credit-rating downgrades and economic slowdowns. Although U.S. lawmakers passed legislation to raise the federal debt ceiling, Standard & Poors Ratings Services lowered its long-term sovereign credit rating on the U.S. from AAA to AA+ in August 2011. The impact of this or any further downgrades to the U.S. governments sovereign credit rating, or its perceived creditworthiness, and the impact of the current crisis in Europe with respect to the ability of certain European Union countries to continue to service their sovereign debt obligations is inherently unpredictable and could adversely affect the U.S. and global financial markets and economic conditions. There can be no assurance that governmental or other measures to aid economic recovery will be effective. These developments and the governments credit concerns in general, could cause interest rates and borrowing costs to rise, which may negatively impact our ability to access the debt markets on favorable terms. In addition, the decreased credit rating could create broader financial turmoil and uncertainty, which may weigh heavily on our stock price.
32
Table of Contents
Nonetheless, since March 2009, there have been signs that the global credit and other financial market conditions have improved as stability has increased throughout the international financial system and many public market indices have experienced positive total returns. Concentrated policy initiatives undertaken by central banks and governments appear to have curtailed the incidence of large-scale failures within the global financial system. Concurrently, investor confidence, financial indicators, capital markets activity and asset prices have shown signs of marked improvement since the second quarter of 2009. However, while financial conditions have improved, domestic unemployment rates remain high, and economic activity remains subdued. In addition, there are early signs that many businesses and industries are experiencing inflationary pressures, both internationally and domestically. These conditions could increase our funding costs, limit our access to the capital markets, decrease our ability to borrow under our line of credit or result in a decision by other lenders not to extend credit to us. These events could prevent us from increasing our investment originations and negatively impact our operating results.
Our investment portfolio is and will continue to be recorded at fair value as determined in good faith by our Board of Directors and, as a result, there is and will continue to be uncertainty as to the value of our portfolio investments.
Under the 1940 Act, we are required to carry our portfolio investments at market value or, if there is no readily available market value, at fair value as determined by our Board of Directors. Typically there is not a public market for the securities of the privately held companies in which we have invested and will generally continue to invest. As a result, we value these securities quarterly at fair value as determined in good faith by our Board of Directors based on input from management, a nationally recognized independent advisor (on a rotational basis) and our audit committee.
The determination of fair value and consequently, the amount of unrealized gains and losses in our portfolio, is to a certain degree subjective and dependent on the judgment of our Board. Certain factors that may be considered in determining the fair value of our investments include the nature and realizable value of any collateral, the portfolio companys earnings and its ability to make payments on its indebtedness, the markets in which the portfolio company does business, comparison to comparable publicly-traded companies, discounted cash flows and other relevant factors. Because such valuations, and particularly valuations of private securities and private companies, are inherently uncertain, may fluctuate over short periods of time and may be based on estimates, our determinations of fair value may differ materially from the values that would have been used if a ready market for these securities existed. Due to this uncertainty, our fair value determinations may cause our net asset value on a given date to materially understate or overstate the value that we may ultimately realize upon the sale or disposition of one or more of our investments. As a result, investors purchasing our securities based on an overstated net asset value would pay a higher price than the value of our investments might warrant. Conversely, investors selling shares during a period in which the net asset value understates the value of our investments will receive a lower price for their shares than the value of our investments might warrant.
Volatility or a prolonged disruption in the credit markets could materially damage our business.
We are required to record our assets at fair value, as determined in good faith by our Board of Directors in accordance with our valuation policy. As a result, volatility in the capital markets may adversely affect our valuations and our net asset value, even if we intend to hold investments to maturity. Volatility or dislocation in the capital markets may depress our stock price below our net asset value per share and create a challenging environment in which to raise debt and equity capital. As a business development company, we are generally not able to issue additional shares of our common stock at a price less than net asset value without first obtaining approval for such issuance from our stockholders and our independent directors. Additionally, our ability to incur indebtedness (including by issuing preferred stock) is limited by applicable regulations such that our asset coverage under the 1940 Act must equal at least 200% of total indebtedness immediately after each time we incur indebtedness exclusive of the SBA debentures pursuant to our SEC exemptive relief. Shrinking portfolio values negatively impact our ability to borrow additional funds under our Credit Facility because our net asset value is
33
Table of Contents
reduced for purposes of the 200% asset leverage test. If the fair value of our assets declines substantially, we may fail to maintain the asset coverage ratio stipulated by the 1940 Act, which could, in turn, cause us to lose our status as a business development company and materially impair our business operations. A protracted disruption in the credit markets could also materially decrease demand for our investments.
The significant disruption in the capital markets experienced in the past had and may in the future have a negative effect on the valuations of our investments, and on the potential for liquidity events involving our investments. The debt capital that will be available to us in the future, if at all, is likely to have a higher cost and less favorable terms and conditions. If our financing costs increase and we have no increase in interest income, then our net investment income will decrease. A prolonged inability to raise capital will require us to reduce the volume of loans we originate and could have a material adverse impact on our business, financial condition or results of operations. This may also increase the probability that other structural risks negatively impact us. These situations may arise due to circumstances that we may be unable to control, such as a protracted disruption in the credit markets, a severe decline in the value of the U.S. dollar, a sharp economic downturn or an operational problem that affects third parties or us, and could materially damage our business.
We operate in a highly competitive market for investment opportunities.
A large number of entities compete with us to make the types of investments that we make in target companies. We compete for investments with other BDCs and investment funds (including private equity funds and mezzanine funds), as well as traditional financial services companies such as commercial and investment banks and other sources of funding. Moreover, alternative investment vehicles, such as hedge funds, also invest in lower middle market companies. As a result, competition for investment opportunities in lower middle market companies is intense. Many of our competitors are substantially larger and have considerably greater financial, technical and marketing resources than we do. For example, some competitors may have a lower cost of capital and access to funding sources that are not available to us. In addition, some of our competitors may have higher risk tolerances or different risk assessments than we have. These characteristics could allow our competitors to consider a wider variety of investments, establish more relationships and offer better pricing and more flexible structuring than we are able to do. We may lose investment opportunities if we do not match our competitors pricing, terms and structure. If we are forced to match our competitors pricing, terms and structure, we may not be able to achieve acceptable returns on our investments or may bear substantial risk of capital loss. A significant part of our competitive advantage stems from the fact that the market for investments in lower middle market companies is underserved by traditional commercial banks and other financing sources. A significant increase in the number and/or the size of our competitors in this target market could force us to accept less attractive investment terms. Furthermore, many of our competitors have greater experience operating under, or are not subject to, the regulatory restrictions that the 1940 Act imposes on us as a BDC.
We are dependent upon our executives for our future success.
We depend on the members of our senior management team, particularly executive officers Garland S. Tucker, III, Brent P.W. Burgess and Steven C. Lilly, for the final selection, structuring, closing and monitoring of our investments. These executive officers have critical industry experience and relationships that we rely on to implement our business plan. If we lose the services of these individuals, we may not be able to operate our business as we expect, and our ability to compete could be harmed, which could cause our operating results to suffer.
Our success depends on attracting and retaining qualified personnel in a competitive environment.
We experience competition in attracting and retaining qualified personnel, particularly investment professionals, and we may be unable to maintain or grow our business if we cannot attract and retain such personnel. Our ability to attract and retain personnel with the requisite credentials, experience and skills depends on several factors including, but not limited to, our ability to offer competitive wages, benefits and professional
34
Table of Contents
growth opportunities. Many of the entities, including investment funds (such as private equity funds and mezzanine funds) and traditional financial services companies, with which we compete for experienced personnel have greater resources than we have.
The competitive environment for qualified personnel may require us to take certain measures to ensure that we are able to attract and retain experienced personnel. Such measures may include increasing the attractiveness of our overall compensation packages, altering the structure of our compensation packages through the use of additional forms of compensation, or other steps. The inability to attract and retain experienced personnel could have a material adverse effect on our business.
Our business model depends to a significant extent upon strong referral relationships, and our inability to maintain or develop these relationships, as well as the failure of these relationships to generate investment opportunities, could adversely affect our business.
We expect that members of our management team will maintain their relationships with financial institutions, private equity and other non-bank investors, investment bankers, commercial bankers, attorneys, accountants and consultants, and we will rely to a significant extent upon these relationships to provide us with potential investment opportunities. If our management and investment team fails to maintain its existing relationships or develop new relationships with other sponsors or sources of investment opportunities, we will not be able to grow our investment portfolio. In addition, individuals with whom members of our management and investment team have relationships are not obligated to provide us with investment opportunities, and, therefore, there is no assurance that such relationships will generate investment opportunities for us.
We have limited operating history as a business development company and as a regulated investment company, which may impair your ability to assess our prospects.
The 1940 Act imposes numerous constraints on the operations of BDCs. Prior to the consummation of our initial public offering in February 2007, we had not operated, and our management team had no experience operating, as a BDC under the 1940 Act or as a RIC under Subchapter M of the Code. As a result, we have limited operating results under these regulatory frameworks that can demonstrate to you either their effect on our business or our ability to manage our business under these frameworks. Our management teams limited experience in managing a portfolio of assets under such constraints may hinder our ability to take advantage of attractive investment opportunities and, as a result, achieve our investment objective. Furthermore, any failure to comply with the requirements imposed on BDCs by the 1940 Act could cause the SEC to bring an enforcement action against us. If we do not remain a BDC, we might be regulated as a closed-end investment company under the 1940 Act, which would further decrease our operating flexibility.
Because of the limited amount of committed funding under our credit facility, we will have limited ability to fund new investments if we are unable to expand the facility.
On May 9, 2011, we entered into a credit agreement providing for a revolving line of credit, which we refer to as the Credit Facility. Committed funding under the Credit Facility was $75.0 million as of December 31, 2011. The Facility has an accordion feature which allows for an increase in the total loan size up to $90.0 million. However, if we are unable to meet the terms of the accordion feature, we will be unable to expand the facility and thus will continue to have limited availability to finance new investments under our line of credit. The Credit Facility matures on May 8, 2014, with two one-year extension options bringing the total potential commitment and funding period to five years from the time we closed on the Credit Facility. If the facility is not renewed or extended, all principal and interest will be due and payable.
There can be no guarantee that we will be able to renew, extend or replace the Credit Facility upon its maturity on terms that are favorable to us, if at all. Our ability to expand the Credit Facility, and to obtain replacement financing at the time of maturity, will be constrained by then-current economic conditions affecting
35
Table of Contents
the credit markets. In the event that we are not able to expand the Credit Facility, or to renew, extend or refinance the Credit Facility at the time of its maturity, this could have a material adverse effect on our liquidity and ability to fund new investments, our ability to make distributions to our stockholders and our ability to qualify as a RIC under the Code.
Regulations governing our operation as a business development company will affect our ability to, and the way in which we raise additional capital.
Our business will require capital to operate and grow. We may acquire such additional capital from the following sources:
Senior Securities. Currently we, through our SBIC subsidiaries, issue debt securities guaranteed by the SBA. In the future, we may issue debt securities or preferred stock and/or borrow money from banks or other financial institutions (including borrowings under our line of credit), which we refer to collectively as senior securities. As a result of issuing senior securities, we will be exposed to additional risks, including, but not limited to, the following:
| | Under the provisions of the 1940 Act, we are permitted, as a BDC, to issue senior securities only in amounts such that our asset coverage, as defined in the 1940 Act, equals at least 200% after each issuance of senior securities. If the value of our assets declines, we may be unable to satisfy this test. If that happens, we may be required to sell a portion of our investments and, depending on the nature of our leverage, repay a portion of our debt at a time when such sales and/or repayments may be disadvantageous. |
| | Any amounts that we use to service our debt or make payments on preferred stock will not be available for distributions to our common stockholders. |
| | It is likely that any senior securities or other indebtedness we issue will be governed by an indenture or other instrument containing covenants restricting our operating flexibility. Additionally, some of these securities or other indebtedness may be rated by rating agencies, and in obtaining a rating for such securities and other indebtedness, we may be required to abide by operating and investment guidelines that further restrict operating and financial flexibility. |
| | We and, indirectly, our stockholders will bear the cost of issuing and servicing such securities and other indebtedness. |
| | Preferred stock or any convertible or exchangeable securities that we issue in the future may have rights, preferences and privileges more favorable than those of our common stock, including separate voting rights and could delay or prevent a transaction or a change in control to the detriment of the holders of our common stock. |
Additional Common Stock. Under the provisions of the 1940 Act, we are not generally able to issue and sell our common stock at a price below net asset value per share. We may, however, sell our common stock, warrants, options or rights to acquire our common stock, at a price below the current net asset value of the common stock if our Board of Directors determines that such sale is in the best interests of our stockholders, and our stockholders approve such sale. At our Annual Stockholders Meeting on June 13, 2011, our stockholders voted to allow us to issue common stock at a price below net asset value per share for a period of one year ending on the earlier of June 12, 2012 or the date of our 2012 annual meeting of stockholders. Our stockholders did not specify a maximum discount below net asset value at which we are able to issue our common stock; however, we do not intend to issue shares of our common stock below net asset value unless our Board of Directors determines that it would be in our stockholders best interests to do so. In any such case, however, the price at which our common stock are to be issued and sold may not be less than a price which, in the determination of our Board of Directors, closely approximates the market value of such securities (less any distributing commission or discount). We may also make rights offerings to our stockholders at prices per share less than the net asset value
36
Table of Contents
per share, subject to applicable requirements of the 1940 Act. If we raise additional funds by issuing more common stock or senior securities convertible into, or exchangeable for, our common stock, the percentage ownership of our stockholders at that time would decrease, and they may experience dilution. Moreover, we can offer no assurance that we will be able to issue and sell additional equity securities in the future, on favorable terms or at all.
In addition to regulatory limitations on our ability to raise capital, our line of credit contains various covenants, which, if not complied with, could accelerate our repayment obligations under the facility, thereby materially and adversely affecting our liquidity, financial condition, results of operations and ability to pay distributions.
We will have a continuing need for capital to finance our loans. We are party to the Credit Facility, which provides us with a revolving credit line facility of up to $90.0 million, of which $75.0 million was available for borrowings as of December 31, 2011. The Credit Facility contains customary terms and conditions, including, without limitation, affirmative and negative covenants such as information reporting requirements, minimum consolidated tangible net worth, minimum interest coverage ratio, maintenance of RIC and BDC status, and minimum liquidity. The Credit Facility also contains customary events of default with customary cure and notice, including, without limitation, nonpayment, misrepresentation of representations and warranties in a material respect, breach of covenant, cross-default to other indebtedness, bankruptcy, change of control, and materially adverse effect. The Credit Facility permits us to fund additional loans and investments as long as we are within the conditions set out in the credit agreement. Our continued compliance with these covenants depends on many factors, some of which are beyond our control, and there are no assurances that we will continue to comply with these covenants. Our failure to satisfy these covenants could result in foreclosure by our lenders, which would accelerate our repayment obligations under the facility and thereby have a material adverse effect on our business, liquidity, financial condition, results of operations and ability to pay distributions to our stockholders.
Recent healthcare reform legislation may affect our revenue and financial condition.
On March 23, 2010, the President of the United States signed into law the Patient Protection and Affordable Care Act of 2010 and on March 30, 2010, the President signed into law the Health Care and Education Reconciliation Act, which in part modified the Patient Protection and Affordable Care Act. Together, the two Acts serve as the primary vehicle for comprehensive health care reform in the United States. The Acts are intended to reduce the number of individuals in the United States without health insurance and effect significant other changes to the ways in which health care is organized, delivered and reimbursed. The complexities and ramifications of the new legislation are significant, and will be implemented in a phased approach beginning in 2010 and concluding in 2018. At this time, the effects of health care reform and its impact on our operations and on the business, revenues and financial condition of our portfolio companies are not yet known. Accordingly, the reform could adversely affect the cost of providing healthcare coverage generally and could adversely affect the financial success of both the portfolio companies in which we invest and us.
The impact of recent financial reform legislation on us is uncertain.
In light of current conditions in the U.S. and global financial markets and the U.S. and global economy, legislators, the presidential administration and regulators have increased their focus on the regulation of the financial services industry. The Dodd-Frank Reform Act became effective on July 21, 2010, however many provisions of the Dodd-Frank Reform Act have delayed effectiveness or will not become effective until the relevant federal agencies issue new rules to implement the Dodd-Frank Reform Act. Nevertheless, the Dodd-Frank Reform Act may have a material adverse impact on the financial services industry as a whole and on our business, results of operations and financial condition. Accordingly, we cannot predict the effect the Dodd-Frank Reform Act or its implementing regulations will have on our business, results of operations or financial condition.
37
Table of Contents
Our SBIC subsidiaries are licensed by the SBA, and therefore subject to SBA regulations.
Our SBIC subsidiaries are licensed to act as SBICs and are regulated by the SBA. Pursuant to SBA regulations, an SBIC can provide financing in the form of debt, debt with equity features and/or equity to eligible small businesses. The SBA also places certain limitations on the financing terms of investments by SBICs in portfolio companies and prohibits SBICs from providing funds for certain purposes or to businesses in a few prohibited industries. See Item 1. Business Small Business Administration Regulations for more discussion on these limitations. Compliance with SBA requirements may cause our SBIC subsidiaries, and us, as their parent, to forego attractive investment opportunities that are not permitted under SBA regulations.
Further, the SBA regulations require that a licensed SBIC be periodically examined and audited by the SBA to determine its compliance with the relevant SBA regulations. The SBA prohibits, without prior SBA approval, a change of control of an SBIC or transfers that would result in any person (or a group of persons acting in concert) owning 10.0% or more of a class of capital stock of a licensed SBIC. If our SBIC subsidiaries fail to comply with applicable SBA regulations, the SBA could, depending on the severity of the violation, limit or prohibit our SBIC subsidiaries use of debentures, declare outstanding debentures immediately due and payable, and/or limit our SBIC subsidiaries from making new investments. In addition, the SBA can remove the general partners of our SBIC subsidiaries and have a receiver appointed, or revoke or suspend a license for willful or repeated violation of, or willful or repeated failure to observe, any provision of the Small Business Investment Act of 1958, as amended, or any rule or regulation promulgated thereunder. Such actions by the SBA would, in turn, negatively affect us because our SBIC subsidiaries are wholly-owned.
SBA regulations limit the outstanding dollar amount of SBA-guaranteed debentures that may be issued by an SBIC or group of SBICs under common control.
The SBA regulations currently limit the dollar amount of SBA-guaranteed debentures that can be issued by any one SBIC to $150.0 million or to a group of SBICs under common control to $225.0 million. Moreover, an SBIC may not borrow an amount in excess of two times (and in certain cases, up to three times) its regulatory capital. As of December 31, 2011, Triangle SBIC had issued $150.0 million in face amount of SBA-guaranteed debentures. As of December 31, 2011, Triangle SBIC II had issued $75.0 million in face amount of SBA-guaranteed debentures. During times that we reach this maximum dollar amount of SBA-guaranteed debentures permitted, and if we require additional capital, our cost of capital is likely to increase, and there is no assurance that we will be able to obtain additional financing on acceptable terms.
Moreover, the current status of our SBIC subsidiaries as SBICs does not automatically assure that our SBIC subsidiaries will continue to receive SBA-guaranteed debenture funding. Receipt of SBA leverage funding is dependent upon our SBIC subsidiaries continuing to be in compliance with SBA regulations and policies and available SBA funding. The amount of SBA leverage funding available to SBICs is dependent upon annual Congressional authorizations and in the future may be subject to annual Congressional appropriations. There can be no assurance that there will be sufficient debenture funding available at the times desired by our SBIC subsidiaries.
The debentures guaranteed by the SBA have a maturity of ten years and require semi-annual payments of interest. Our SBIC subsidiaries will need to generate sufficient cash flow to make required interest payments on the debentures. If our SBIC subsidiaries are unable to meet their financial obligations under the debentures, the SBA, as a creditor, will have a superior claim to our SBIC subsidiaries assets over our stockholders in the event we liquidate our SBIC subsidiaries or the SBA exercises its remedies under such debentures as the result of a default by us. In addition, the SBA must approve our independent directors before our SBIC subsidiaries will be permitted to issue additional debentures guaranteed by the SBA.
Because we borrow money, the potential for gain or loss on amounts invested in us is magnified and may increase the risk of investing in us.
Borrowings, also known as leverage, magnify the potential for gain or loss on invested equity capital. As we use leverage to partially finance our investments, our stockholders experience increased risks associated with
38
Table of Contents
investing in our securities. We currently borrow under our Credit Facility and have issued senior securities, and in the future may borrow from, or issue additional senior securities to, banks, insurance companies, funds, institutional investors and other lenders and investors. Our SBIC subsidiaries issue debt securities guaranteed by the SBA and sold in the capital markets. As a result of its guarantee of the debt securities, the SBA has fixed dollar claims on the assets of our SBIC subsidiaries that are superior to the claims of our common stockholders. In addition, our Credit Facility contains financial and operating covenants that could restrict our business activities, including our ability to declare dividends if we default under certain provisions. Breach of any of those covenants could cause a default under those instruments. Such a default, if not cured or waived, could have a material adverse effect on us. We may also borrow from banks and other lenders or issue additional senior securities including preferred stock and debt securities in the future. If the value of our assets increases, then leveraging would cause the net asset value attributable to our common stock to increase more sharply than it would have had we not leveraged. Conversely, if the value of our assets decreases, leveraging would cause net asset value to decline more sharply than it otherwise would have had we not leveraged. Similarly, any increase in our income in excess of interest payable on the borrowed funds would cause our net investment income to increase more than it would without the leverage, while any decrease in our income would cause our net investment income to decline more sharply than it would have had we not borrowed. Such a decline could negatively affect our ability to make distributions to our stockholders. Leverage is generally considered a speculative investment technique.
As a BDC, we are generally required to meet a coverage ratio of total assets to total borrowings and other senior securities, which include all of our borrowings (other than SBA leverage) and any preferred stock we may issue in the future, of at least 200%. If this ratio declines below 200%, we may not be able to incur additional debt and may need to sell a portion of our investments to repay some debt when it is disadvantageous to do so, and we may not be able to make distributions.
On December 31, 2011, we had $15.0 million of outstanding borrowings under our Credit Facility and $224.2 million of outstanding indebtedness guaranteed by the SBA, which had a weighted average annualized interest cost of 4.83%. As of December 31, 2011, all SBA debentures have been pooled.
Our ability to achieve our investment objective may depend in part on our ability to achieve additional leverage on favorable terms by issuing additional senior securities or debentures guaranteed by the SBA, by borrowing from banks or insurance companies or by expanding our line of credit, and there can be no assurance that such additional leverage can in fact be achieved.
We may in the future determine to fund a portion of our investments with preferred stock, which would magnify the potential for gain or loss and the risks of investing in us in the same way as our borrowings.
Preferred stock, which is another form of leverage, has the same risks to our common stockholders as borrowings because the dividends on any preferred stock we issue must be cumulative. Payment of such dividends and repayment of the liquidation preference of such preferred stock must take preference over any dividends or other payments to our common stockholders, and preferred stockholders are not subject to any of our expenses or losses and are not entitled to participate in any income or appreciation in excess of their stated preference.
We may experience fluctuations in our quarterly results.
We could experience fluctuations in our quarterly operating results due to a number of factors, including our ability or inability to make investments in companies that meet our investment criteria, the interest rate payable on the debt securities we acquire, the level of our expenses, variations in and the timing of the recognition of realized and unrealized gains or losses, the degree to which we encounter competition in our markets and general economic conditions. As a result of these factors, results for any period should not be relied upon as being indicative of performance in future periods.
39
Table of Contents
Our ability to enter into and exit investment transactions with our affiliates will be restricted.
Except in those instances where we have received prior exemptive relief from the SEC, we will be prohibited under the 1940 Act from knowingly participating in certain transactions with our affiliates without the prior approval of our independent directors. Any person that owns, directly or indirectly, 5.0% or more of our outstanding voting securities is deemed our affiliate for purposes of the 1940 Act and we are generally prohibited from buying or selling any security from or to such affiliate, absent the prior approval of our independent directors. The 1940 Act also prohibits joint transactions with an affiliate, which could include investments in the same portfolio company (whether at the same or different times), without prior approval of our independent directors. If a person acquires more than 25.0% of our voting securities, we will be prohibited from buying or selling any security from or to such person, or entering into joint transactions with such person, absent the prior approval of the SEC. These restrictions could limit or prohibit us from making certain attractive investments that we might otherwise make absent such restrictions.
Our Board of Directors may change our operating policies and strategies without prior notice or stockholder approval, the effects of which may be adverse.
Our Board of Directors has the authority to modify or waive our current operating policies and strategies without prior notice and without stockholder approval. We cannot predict the effect any changes to our current operating policies, investment criteria and strategies would have on our business, net asset value, operating results and value of our stock. However, the effects might be adverse, which could negatively impact our ability to pay you distributions and cause you to lose all or part of your investment. Moreover, we will have significant flexibility in investing the net proceeds from any future offerings and may use the net proceeds from such offerings in ways with which investors may not agree or for purposes other than those contemplated at the time of the offering.
We will be subject to corporate-level U.S. federal income tax if we are unable to maintain our status as a regulated investment company under Subchapter M of the Code, which will adversely affect our results of operations and financial condition.
We have elected to be treated as a RIC under the Code, which generally will allow us to avoid being subject to corporate-level U.S. federal income tax. To obtain and maintain RIC tax treatment under the Code, we must meet the following annual distribution, income source and asset diversification requirements:
| | The annual distribution requirement for a RIC will be satisfied if we distribute to our stockholders on an annual basis at least 90.0% of our net ordinary income and net short-term capital gain in excess of net long-term capital loss, if any. We will be subject to a 4.0% nondeductible U.S. federal excise tax, however, to the extent that we do not satisfy certain additional minimum distribution requirements on a calendar year basis. Because we use debt financing, we are subject to certain asset coverage ratio requirements under the 1940 Act and may in the future become subject to certain financial covenants under loan and credit agreements that could, under certain circumstances, restrict us from making distributions necessary to satisfy the distribution requirement. If we are unable to obtain cash from other sources, we could fail to qualify for RIC tax treatment and thus become subject to corporate-level U.S. federal income tax. |
| | The income source requirement will be satisfied if we obtain at least 90.0% of our income for each year from distributions, interest, gains from the sale of stock or securities or similar sources. |
| | The asset diversification requirement will be satisfied if we meet certain asset diversification requirements at the end of each quarter of our taxable year. To satisfy this requirement, at least 50.0% of the value of our assets must consist of cash, cash equivalents, U.S. Government securities, securities of other RICs, and other acceptable securities; and no more than 25.0% of the value of our assets can be invested in the securities, other than U.S. government securities or securities of other RICs, of one issuer, of two or more issuers that are controlled, as determined under applicable Code rules, by us and that are |
40
Table of Contents
| engaged in the same or similar or related trades or businesses or of certain qualified publicly traded partnerships. Failure to meet these requirements may result in our having to dispose of certain investments quickly in order to prevent the loss of RIC status. Because most of our investments will be in private companies, and therefore will be relatively illiquid, any such dispositions could be made at disadvantageous prices and could result in substantial losses. |
If we fail to qualify for or maintain RIC tax treatment for any reason and are subject to corporate-level U.S. federal income tax, the resulting corporate taxes could substantially reduce our net assets, the amount of income available for distribution and the amount of our distributions. We may also be subject to certain U.S. federal excise taxes, as well as state, local and foreign taxes.
We may not be able to pay you distributions, our distributions may not grow over time, and a portion of distributions paid to you may be a return of capital.
We intend to pay quarterly distributions to our stockholders out of assets legally available for distribution. We cannot assure you that we will achieve investment results that will allow us to make a specified level of cash distributions or year-to-year increases in cash distributions. Our ability to pay distributions might be harmed by, among other things, the risk factors described in this Annual Report. In addition, the inability to satisfy the asset coverage test applicable to us as a BDC could, in the future, limit our ability to pay distributions. All distributions will be paid at the discretion of our Board of Directors and will depend on our earnings, our financial condition, maintenance of our RIC status, compliance with applicable BDC regulations, our SBIC subsidiaries compliance with applicable SBIC regulations and such other factors as our Board of Directors may deem relevant from time to time. In addition, our line of credit may restrict the amount of distributions we are permitted to make. We cannot assure you that we will pay distributions to our stockholders in the future.
When we make quarterly distributions, we will be required to determine the extent to which such distributions are paid out of current or accumulated earnings and profits, recognized capital gain or capital. To the extent there is a return of capital, investors will be required to reduce their basis in our stock for federal income tax purposes.
We may have difficulty paying our required distributions if we recognize income before or without receiving cash representing such income.
For U.S. federal income tax purposes, we may be required to recognize taxable income in circumstances in which we do not receive a corresponding payment in cash. For example, if we hold debt obligations that are treated under applicable tax rules as having original issue discount (such as debt instruments with PIK interest or, in certain cases, increasing interest rates or debt instruments that were issued with warrants), we must include in income each year a portion of the original issue discount that accrues over the life of the obligation, regardless of whether cash representing such income is received by us in the same taxable year. We may also have to include in income other amounts that we have not yet received in cash, such as deferred loan origination fees that are paid after origination of the loan or are paid in non-cash compensation such as warrants or stock. We anticipate that a portion of our income may constitute original issue discount or other income required to be included in taxable income prior to receipt of cash. Further, we may elect to amortize market discounts and include such amounts in our taxable income in the current year, instead of upon disposition, as an election not to do so would limit our ability to deduct interest expenses for U.S. federal income tax purposes.
Because any original issue discount or other amounts accrued will be included in our investment company taxable income for the year of the accrual, we may be required to make a distribution to our stockholders in order to satisfy the annual distribution requirement, even though we will not have received any corresponding cash amount. As a result, we may have difficulty meeting the annual distribution requirement necessary to obtain and maintain RIC tax treatment under the Code. We may have to sell some of our investments at times and/or at prices we would not consider advantageous, raise additional debt or equity capital or forgo new investment opportunities for this
41
Table of Contents
purpose. If we are not able to obtain cash from other sources, we may fail to qualify for RIC tax treatment and thus become subject to corporate-level U.S. federal income tax. For additional discussion regarding the tax implications of a RIC, see Material U.S. Federal Income Tax Considerations Taxation as a RIC.
You may have current tax liability on distributions you elect to reinvest in our common stock but would not receive cash from such distributions to pay such tax liability.
If you participate in our distribution reinvestment plan, you will be deemed to have received, and for U.S. federal income tax purposes will be taxed on, the amount reinvested in our common stock to the extent the amount reinvested was not a tax-free return of capital. As a result, unless you are a tax-exempt entity, you may have to use funds from other sources to pay your tax liability on the value of our common stock received from the distribution.
Our SBIC subsidiaries, as SBICs, may be unable to make distributions to us that may harm our ability to meet regulated investment company requirements, which could result in the imposition of an entity-level tax.
In order for us to continue to qualify as a RIC, we will be required to distribute on an annual basis substantially all of our taxable income, including income from our subsidiaries, including our SBIC subsidiaries. As the majority of our investments are generally held by our SBIC subsidiaries, we will be substantially dependent on our SBIC subsidiaries for cash distributions to enable us to meet the RIC distribution requirements. Our SBIC subsidiaries may be limited by the Small Business Investment Act of 1958, and SBA regulations governing SBICs, from making certain distributions to us that may be necessary to enable us to qualify as a RIC. We may have to request a waiver of the SBAs restrictions for our SBIC subsidiaries to make certain distributions to maintain our status as a RIC. We cannot assure you that the SBA will grant such waiver and if our SBIC subsidiaries are unable to obtain a waiver, compliance with the SBA regulations may result in loss of RIC status and a consequent imposition of corporate-level U.S. federal income tax on us.
Pursuant to SBA regulations, an SBIC with outstanding debenture leverage may only distribute cumulative realized profits (less unrealized losses on investments). It may not return more than 2% of its outstanding capital in any fiscal year without SBA prior approval. Historically, SBA has permitted payment in excess of 2% only pursuant to an approved wind up plan filed by the SBIC pursuant to which SBA determines that repayment of outstanding debentures is adequately assured.
Because we intend to distribute substantially all of our income to our stockholders to maintain our status as a regulated investment company, we will continue to need additional capital to finance our growth, and regulations governing our operation as a business development company will affect our ability to, and the way in which we raise additional capital.
In order to satisfy the requirements applicable to a RIC and to avoid payment of U.S. federal excise tax, we intend to distribute to our stockholders substantially all of our net ordinary income and net capital gain income except for certain net long-term capital gains recognized after we became a RIC, some or all of which we may retain, pay applicable U.S. federal income taxes with respect thereto, and elect to treat as deemed distributions to our stockholders. As a BDC, we generally are required to meet a coverage ratio of total assets to total senior securities, which includes all of our borrowings (other than SBA leverage) and any preferred stock we may issue in the future, of at least 200.0%. This requirement limits the amount that we may borrow. If the value of our assets declines, we may be unable to satisfy this test. If that happens, we may be required to sell a portion of our investments or sell additional securities and, depending on the nature of our leverage, to repay a portion of our indebtedness at a time when such sales may be disadvantageous. In addition, issuance of additional securities could dilute the percentage ownership of our current stockholders in us.
While we expect to be able to borrow and to issue additional debt and equity securities, we cannot assure you that debt and equity financing will be available to us on favorable terms, or at all. If additional funds are not
42
Table of Contents
available to us, we could be forced to curtail or cease new investment activities, and our net asset value could decline. In addition, as a BDC, we generally are not permitted to issue equity securities priced below net asset value without stockholder approval. At our Annual Stockholders Meeting on June 13, 2011, our stockholders voted to allow us to issue common stock at a price below net asset value per share for a period of one year ending on the earlier of June 12, 2012 or the date of our 2012 annual meeting of stockholders. Our stockholders did not specify a maximum discount below net asset value at which we are able to issue our common stock; however, we do not intend to issue shares of our common stock below net asset value unless our Board of Directors determines that it would be in our stockholders best interests to do so.
Changes in laws or regulations governing our operations may adversely affect our business or cause us to alter our business strategy.
We, our SBIC subsidiaries and our portfolio companies will be subject to regulation at the local, state and federal level. New legislation may be enacted or new interpretations, rulings or regulations could be adopted, including those governing the types of investments we are permitted to make, any of which could harm us and our stockholders, potentially with retroactive effect. In addition, any change to the SBAs current debenture program could have a significant impact on our ability to obtain lower-cost leverage and, therefore, our competitive advantage over other finance companies.
Additionally, any changes to the laws and regulations governing our operations relating to permitted investments may cause us to alter our investment strategy in order to avail ourselves of new or different opportunities. Such changes could result in material differences to the strategies and plans set forth in this Annual Report and may result in our investment focus shifting from the areas of expertise of our management team to other types of investments in which our management team may have less expertise or little or no experience. Thus, any such changes, if they occur, could have a material adverse effect on our results of operations and the value of your investment.
Efforts to comply with the Sarbanes-Oxley Act will involve significant expenditures, and non-compliance with the Sarbanes-Oxley Act may adversely affect us.
We are subject to the Sarbanes-Oxley Act of 2002, or the Sarbanes-Oxley Act, and the related rules and regulations promulgated by the SEC. Among other requirements, under Section 404 of the Sarbanes-Oxley Act and rules and regulations of the SEC thereunder, our management is required to report on our internal controls over financial reporting. We are required to review on an annual basis our internal controls over financial reporting, and on a quarterly and annual basis to evaluate and disclose significant changes in our internal controls over financial reporting. We have and expect to continue to incur significant expenses related to compliance with the Sarbanes-Oxley Act, which will negatively impact our financial performance and our ability to make distributions. In addition, this process results in a diversion of managements time and attention. Since we have a limited operating history as a company subject to the Sarbanes-Oxley Act, we cannot assure you that our internal controls over financial reporting will continue to be effective. In the event that we are unable to maintain compliance with the Sarbanes-Oxley Act and related rules, we may be adversely affected.
The Credit Facility with a potential member of the underwriting syndicate may not be as favorable to us as if it had been negotiated with an unaffiliated third-party.
We entered into the Credit Facility on May 9, 2011 with a lender that has acted and may in the future act as a member of the underwriting syndicate in the future for securities issued pursuant to our universal shelf registration statement. Consequently the terms may not be as favorable to us as if they had been negotiated with an unrelated third-party.
We could face losses and potential liability if intrusion, viruses or similar disruptions to our technology jeopardize our confidential information or that of users of our technology.
Although we have implemented, and will continue to implement, security measures, our technology platform is and will continue to be vulnerable to intrusion, computer viruses or similar disruptive problems caused by transmission from unauthorized users. The misappropriation of proprietary information could expose us to a risk of loss or litigation.
43
Table of Contents
Risks Relating to Our Investments
Our investments in portfolio companies may be risky, and we could lose all or part of our investment.
Investing in lower middle market companies involves a number of significant risks. Among other things, these companies:
| | may have limited financial resources to meet future capital needs and thus may be unable to grow or meet their obligations under their debt instruments that we hold, which may be accompanied by a deterioration in the value of any collateral and a reduction in the likelihood of us realizing any guarantees from subsidiaries or affiliates of our portfolio companies that we may have obtained in connection with our investment, as well as a corresponding decrease in the value of the equity components of our investments; |
| | may have shorter operating histories, narrower product lines, smaller market shares and/or more significant customer concentration than larger businesses, which tend to render them more vulnerable to competitors actions and market conditions, as well as general economic downturns; |
| | are more likely to depend on the management talents and efforts of a small group of persons; therefore, the death, disability, resignation or termination of one or more of these persons could have a material adverse impact on our portfolio company and, in turn, on us; |
| | generally have less predictable operating results, may from time to time be parties to litigation, may be engaged in rapidly changing businesses with products subject to a substantial risk of obsolescence, and may require substantial additional capital to support their operations, finance expansion or maintain their competitive position; and |
| | generally have less publicly available information about their businesses, operations and financial condition. We rely on the ability of our management team and investment professionals to obtain adequate information to evaluate the potential returns from investing in these companies. If we are unable to uncover all material information about these companies, we may not make a fully informed investment decision, and may lose all or part of our investment. |
In addition, in the course of providing significant managerial assistance to certain of our portfolio companies, certain of our officers and directors may serve as directors on the boards of such companies. To the extent that litigation arises out of our investments in these companies, our officers and directors may be named as defendants in such litigation, which could result in an expenditure of funds (through our indemnification of such officers and directors) and the diversion of management time and resources.
The lack of liquidity in our investments may adversely affect our business.
We invest, and will continue to invest in companies whose securities are not publicly traded, and whose securities will be subject to legal and other restrictions on resale or will otherwise be less liquid than publicly traded securities. The illiquidity of these investments may make it difficult for us to sell these investments when desired. In addition, if we are required to liquidate all or a portion of our portfolio quickly, we may realize significantly less than the value at which we had previously recorded these investments. As a result, we do not expect to achieve liquidity in our investments in the near-term. Our investments are usually subject to contractual or legal restrictions on resale or are otherwise illiquid because there is usually no established trading market for such investments. The illiquidity of most of our investments may make it difficult for us to dispose of them at a favorable price, and, as a result, we may suffer losses.
We are a non-diversified investment company within the meaning of the 1940 Act, and therefore we are not limited with respect to the proportion of our assets that may be invested in securities of a single issuer.
We are classified as a non-diversified investment company within the meaning of the 1940 Act, which means that we are not limited by the 1940 Act with respect to the proportion of our assets that we may invest in securities of a single issuer. To the extent that we assume large positions in the securities of a small number of
44
Table of Contents
issuers, our net asset value may fluctuate to a greater extent than that of a diversified investment company as a result of changes in the financial condition or the markets assessment of the issuer. We may also be more susceptible to any single economic or regulatory occurrence than a diversified investment company. Beyond our RIC asset diversification requirements and certain SBA diversification requirements for our investments held by our two wholly-owned SBIC subsidiaries, we do not have fixed guidelines for diversification, and our investments could be concentrated in relatively few portfolio companies.
We may not have the funds or ability to make additional investments in our portfolio companies.
We may not have the funds or ability to make additional investments in our portfolio companies. After our initial investment in a portfolio company, we may be called upon from time to time to provide additional funds to such company or have the opportunity to increase our investment through the exercise of a warrant to purchase common stock. There is no assurance that we will make, or will have sufficient funds to make, follow-on investments. Any decisions not to make a follow-on investment or any inability on our part to make such an investment may have a negative impact on a portfolio company in need of such an investment, may result in a missed opportunity for us to increase our participation in a successful operation or may reduce the expected yield on the investment.
Our portfolio companies may incur debt or issue equity securities that rank equally with, or senior to, our investments in such companies.
We invest primarily in senior secured debt and subordinated notes as well as equity issued by lower middle market companies. Our portfolio companies may have, or may be permitted to incur, other debt, or issue other equity securities that rank equally with, or senior to, the debt in which we invest. By their terms, such instruments may entitle the holders to receive payment of dividends, interest or principal on or before the dates on which we are entitled to receive payments with respect to the debt instruments in which we invest. Also, in the event of insolvency, liquidation, dissolution, reorganization or bankruptcy of a portfolio company, holders of securities ranking senior to our investment in that portfolio company would typically be entitled to receive payment in full before we receive any distribution. After repaying such holders, such portfolio company may not have any remaining assets to use for repaying its obligation to us. In the case of securities ranking equally with our investments, we would have to share on an equal basis any distributions with other security holders in the event of an insolvency, liquidation, dissolution, reorganization or bankruptcy of the relevant portfolio company.
The rights we may have with respect to the collateral securing any junior priority loans we make to our portfolio companies may also be limited pursuant to the terms of one or more intercreditor agreements that we enter into with the holders of senior debt. Under such an intercreditor agreement, at any time that senior obligations are outstanding, we may forfeit certain rights with respect to the collateral to the holders of the senior obligations. These rights may include the right to commence enforcement proceedings against the collateral, the right to control the conduct of such enforcement proceedings, the right to approve amendments to collateral documents, the right to release liens on the collateral and the right to waive past defaults under collateral documents. We may not have the ability to control or direct such actions, even if as a result our rights as junior lenders are adversely affected.
There may be circumstances where our debt investments could be subordinated to claims of other creditors or we could be subject to lender liability claims.
Even though we may have structured certain of our investments as senior loans, if one of our portfolio companies were to go bankrupt, depending on the facts and circumstances and based upon principles of equitable subordination as defined by existing case law, a bankruptcy court could subordinate all or a portion of our claim to that of other creditors and transfer any lien securing such subordinated claim to the bankruptcy estate. The principles of equitable subordination defined by case law have generally indicated that a claim may be subordinated only if its holder is guilty of misconduct or where the senior loan is re-characterized as an equity
45
Table of Contents
investment and the senior lender has actually provided significant managerial assistance to the bankrupt debtor. We may also be subject to lender liability claims for actions taken by us with respect to a borrowers business or instances where we exercise control over the borrower. It is possible that we could become subject to a lenders liability claim, including as a result of actions taken in rendering significant managerial assistance or actions to compel and collect payments from the borrower outside the ordinary course of business.
Second priority liens on collateral securing loans that we make to our portfolio companies may be subject to control by senior creditors with first priority liens. If there is a default, the value of the collateral may not be sufficient to repay in full both the first priority creditors and us.
Certain loans that we make are secured by a second priority security interest in the same collateral pledged by a portfolio company to secure senior debt owed by the portfolio company to commercial banks or other traditional lenders. Often the senior lender has procured covenants from the portfolio company prohibiting the incurrence of additional secured debt without the senior lenders consent. Prior to and as a condition of permitting the portfolio company to borrow money from us secured by the same collateral pledged to the senior lender, the senior lender will require assurances that it will control the disposition of any collateral in the event of bankruptcy or other default. In many such cases, the senior lender will require us to enter into an intercreditor agreement prior to permitting the portfolio company to borrow from us. Typically the intercreditor agreements we are requested to execute expressly subordinate our debt instruments to those held by the senior lender and further provide that the senior lender shall control: (1) the commencement of foreclosure or other proceedings to liquidate and collect on the collateral; (2) the nature, timing and conduct of foreclosure or other collection proceedings; (3) the amendment of any collateral document; (4) the release of the security interests in respect of any collateral; and (5) the waiver of defaults under any security agreement. Because of the control we may cede to senior lenders under intercreditor agreements we may enter, we may be unable to realize the proceeds of any collateral securing some of our loans.
Finally, the value of the collateral securing our debt investment will ultimately depend on market and economic conditions, the availability of buyers and other factors. Therefore, there can be no assurance that the proceeds, if any, from the sale or sales of all of the collateral would be sufficient to satisfy the loan obligations secured by our second priority liens after payment in full of all obligations secured by the senior lenders first priority liens on the collateral. There is also a risk that such collateral securing our investments may decrease in value over time, may be difficult to sell in a timely manner, may be difficult to appraise and may fluctuate in value based upon the success of the portfolio company and market conditions. If such proceeds are not sufficient to repay amounts outstanding under the loan obligations secured by our second priority liens, then we, to the extent not repaid from the proceeds of the sale of the collateral, will only have an unsecured claim against the companys remaining assets, if any.
If we do not invest a sufficient portion of our assets in qualifying assets, we could fail to qualify as a business development company or be precluded from investing according to our current business strategy.
As a BDC, we may not acquire any assets other than qualifying assets unless, at the time of and after giving effect to such acquisition, at least 70.0% of our total assets are qualifying assets. For further detail, see Regulation of Business Development Companies included in Item 1 of Part I of this Annual report on Form 10-K.
We believe that substantially all of our investments are qualifying assets. However, we may be precluded from investing in what we believe are attractive investments if such investments are not qualifying assets for purposes of the 1940 Act. If we do not invest a sufficient portion of our assets in qualifying assets, we could lose our status as a BDC, which would have a material adverse effect on our business, financial condition and results of operations. Similarly, these rules could prevent us from making follow-on investments in existing portfolio companies (which could result in the dilution of our position).
46
Table of Contents
We are a non-diversified investment company within the meaning of the 1940 Act, and therefore we are not limited with respect to the proportion of our assets that may be invested in securities of a single issuer.
We are classified as a non-diversified investment company within the meaning of the 1940 Act, which means that we are not limited by the 1940 Act with respect to the proportion of our assets that we may invest in securities of a single issuer. To the extent that we assume large positions in the securities of a small number of issuers, our net asset value may fluctuate to a greater extent than that of a diversified investment company as a result of changes in the financial condition or the markets assessment of the issuer. We may also be more susceptible to any single economic or regulatory occurrence than a diversified investment company. Beyond our RIC asset diversification requirements and certain SBA diversification requirements for our investments held by our two wholly-owned SBIC subsidiaries, we do not have fixed guidelines for diversification, and our investments could be concentrated in relatively few portfolio companies.
We generally will not control our portfolio companies.
We do not, and do not expect to, control most of our portfolio companies, even though we may have board representation or board observation rights, and our debt agreements may contain certain restrictive covenants. As a result, we are subject to the risk that a portfolio company in which we invest may make business decisions with which we disagree and the management of such company, as representatives of the holders of their common equity, may take risks or otherwise act in ways that do not serve our interests as debt investors. Due to the lack of liquidity for our investments in non-traded companies, we may not be able to dispose of our interests in our portfolio companies as readily as we would like or at an appropriate valuation. As a result, a portfolio company may make decisions that could decrease the value of our portfolio holdings.
Economic recessions or downturns could impair our portfolio companies and harm our operating results.
Beginning in the third quarter of 2007, global credit and other financial markets began to suffer substantial stress, volatility, illiquidity and disruption. These forces reached extraordinary levels in late 2008, resulting in the bankruptcy of, the acquisition of, or government intervention in the affairs of several major domestic and international financial institutions. In particular, the financial services sector was negatively impacted by significant write-offs as the value of the assets held by financial firms declined, impairing their capital positions and abilities to lend and invest. We believe that such value declines were exacerbated by widespread forced liquidations as leveraged holders of financial assets, faced with declining prices, were compelled to sell to meet margin requirements and maintain compliance with applicable capital standards. Such forced liquidations also impaired or eliminated many investors and investment vehicles, leading to a decline in the supply of capital for investment and depressed pricing levels for many assets. These events significantly diminished overall confidence in the debt and equity markets, engendered unprecedented declines in the values of certain assets, and caused extreme economic uncertainty.
Since March 2009, there have been signs that the global credit and other financial market conditions have improved as stability has increased throughout the international financial system and many public stock market indices have experienced positive total returns. Concentrated policy initiatives undertaken by central banks and governments appear to have curtailed the incidence of large-scale failures within the global financial system. Concurrently, investor confidence, financial indicators, capital markets activity and asset prices have shown signs of marked improvement since the second quarter of 2009. However, while financial conditions have improved, domestic unemployment rates remain high, and economic activity remains subdued. In addition, there are early signs that many businesses and industries are experiencing inflationary pressures, both internationally and domestically.
Many of our current and/or future portfolio companies may be susceptible to economic slowdowns or recessions and may be unable to repay our debt investments during these periods. Therefore, during such slowdowns or recessions, our non-performing assets are likely to increase, and the value of our portfolio is likely
47
Table of Contents
to decrease. Adverse economic conditions may also decrease the value of any collateral securing some of our debt investments and the value of our equity investments. A prolonged economic slowdown or recession may further decrease the value of such collateral and result in losses of value in our portfolio and a decrease in investment income, net investment income, assets, and net worth. Unfavorable economic conditions also could increase our funding costs, limit our access to the capital markets or result in a decision by lenders not to extend credit to us on terms we deem acceptable. These events could prevent us from increasing investment originations and harm our operating results.
Financial results may be affected adversely if one or more of our portfolio investments defaults on its loans or fails to perform as we expect.
Our portfolio consists primarily of debt and equity investments in privately owned middle-market businesses. Compared to larger publicly owned companies, these middle-market companies may be in a weaker financial position and experience wider variations in their operating results, which may make them more vulnerable to economic downturns. Typically, these companies need more capital to compete; however, their access to capital is limited and their cost of capital is often higher than that of their competitors. Our portfolio companies face intense competition from larger companies with greater financial, technical and marketing resources and their success typically depends on the management talents and efforts of an individual or a small group of persons. The loss of any of their key employees could affect their ability to compete effectively and harm their financial condition. Further, some of these companies conduct business in regulated industries that are susceptible to regulatory changes. These factors could impair the cash flow of our portfolio companies and result in other events, such as bankruptcy. These events could limit a portfolio companys ability to repay their obligations to us, which may have an adverse effect on the return on, or the recovery of, our investment in these businesses. Deterioration in a borrowers financial condition and prospects may be accompanied by deterioration in the value of the loans collateral.
Some of these companies cannot obtain financing from public capital markets or from traditional credit sources, such as commercial banks. Accordingly, loans made to these types of companies pose a higher default risk, than loans made to companies who have access to traditional credit sources.
Generally, little, if any, public information is available about such companies. Therefore, we must rely on our employees diligence to obtain the information needed, such as the financial information of these companies, to make well-informed investment decisions. If we do not uncover material information about these companies, we may not make a fully informed investment decision, which could, in turn cause us to lose money on our investments.
Potential writedowns or losses with respect to portfolio investments existing and to be made in the future could adversely affect our results of operations, cash flows, dividend level, net asset value and stock price.
As of December 31, 2011, the fair value of our non-accrual assets was approximately $7.6 million, which comprised approximately 1.5% of the total fair value of our portfolio. The fair value of these non-accrual assets was less than cost as of December 31, 2011. In addition, as of December 31, 2011, we had, on a fair value basis, approximately $29.5 million of debt investments, or 5.8% of the total fair value of our portfolio, which were current with respect to scheduled interest and principal payments, but which were carried at less than cost. In light of current economic conditions, certain of our portfolio companies may be unable to service our debt investments on a timely basis. These conditions may also decrease the value of collateral securing some of our debt investments, as well as the value of our equity investments. As a result, the number of non-performing assets in our portfolio may increase, and the overall value of our portfolio may decrease, which could lead to financial losses in our portfolio and a decrease in our investment income, net investment income, dividends and assets.
Any unrealized losses we experience on our loan portfolio may be an indication of future realized losses, which could reduce our income available for distribution.
As a BDC, we are required to carry our investments at market value or, if no market value is ascertainable, at the fair value as determined in good faith by our Board of Directors. Decreases in the market values or fair
48
Table of Contents
values of our investments will be recorded as unrealized depreciation. Any unrealized losses in our loan portfolio could be an indication of a portfolio companys inability to meet its repayment obligations to us with respect to the affected loans. This could result in realized losses in the future and ultimately in reductions of our income available for distribution in future periods.
Defaults by our portfolio companies will harm our operating results.
A portfolio companys failure to satisfy financial or operating covenants imposed by us or other lenders could lead to defaults and, potentially, termination of its loans and foreclosure on its secured assets, which could trigger cross-defaults under other agreements and jeopardize a portfolio companys ability to meet its obligations under the debt or equity securities that we hold. We may incur expenses to the extent necessary to seek recovery upon default or to negotiate new terms, which may include the waiver of certain financial covenants, with a defaulting portfolio company.
Prepayments of our debt investments by our portfolio companies could adversely impact our results of operations and reduce our return on equity.
We are subject to the risk that the investments we make in our portfolio companies may be repaid prior to maturity. When this occurs, we will generally reinvest these proceeds in temporary investments, pending their future investment in new portfolio companies. These temporary investments will typically have substantially lower yields than the debt being prepaid and we could experience significant delays in reinvesting these amounts. Any future investment in a new portfolio company may also be at lower yields than the debt that was repaid. As a result, our results of operations could be materially adversely affected if one or more of our portfolio companies elect to prepay amounts owed to us. Additionally, prepayments could negatively impact our return on equity, which could result in a decline in the market price of our securities.
Changes in interest rates may affect our cost of capital and net investment income.
Most of our debt investments will bear interest at fixed rates and the value of these investments could be negatively affected by increases in market interest rates. In addition, an increase in interest rates would make it more expensive to use debt to finance our investments. As a result, a significant increase in market interest rates could both reduce the value of our portfolio investments and increase our cost of capital, which would reduce our net investment income. Also, an increase in interest rates available to investors could make an investment in our common stock less attractive if we are not able to increase our distribution rate, a situation which could reduce the value of our common stock. Conversely, a decrease in interest rates may have an adverse impact on our returns by requiring us to seek lower yields on our debt investments and by increasing the risk that our portfolio companies will prepay our debt investments, resulting in the need to redeploy capital at potentially lower rates.
We may not realize gains from our equity investments.
Certain investments that we have made in the past and may make in the future include warrants or other equity securities. Investments in equity securities involve a number of significant risks, including the risk of further dilution as a result of additional issuances, inability to access additional capital and failure to pay current distributions. Investments in preferred securities involve special risks, such as the risk of deferred distributions, credit risk, illiquidity and limited voting rights. In addition, we may from time to time make non-control, equity co-investments in companies in conjunction with private equity sponsors. Our goal is ultimately to realize gains upon our disposition of such equity interests. However, the equity interests we receive may not appreciate in value and, in fact, may decline in value. Accordingly, we may not be able to realize gains from our equity interests, and any gains that we do realize on the disposition of any equity interests may not be sufficient to offset any other losses we experience. We also may be unable to realize any value if a portfolio company does not have a liquidity event, such as a sale of the business, recapitalization or public offering, which would allow us to sell the underlying equity interests. We often seek puts or similar rights to give us the right to sell our equity securities back to the portfolio company issuer. We may be unable to exercise these puts rights for the consideration provided in our investment documents if the issuer is in financial distress.
49
Table of Contents
Risks Relating to Our Securities
Shares of closed-end investment companies, including business development companies, frequently trade at a discount to their net asset value.
Shares of closed-end investment companies, including BDCs, frequently trade at a discount from net asset value. This characteristic of closed-end investment companies and BDCs is separate and distinct from the risk that our net asset value per share may decline. We cannot predict whether our common stock will trade at, above or below net asset value. In addition, if our common stock trades below net asset value, we will generally not be able to issue additional common stock at the market price without first obtaining the approval of our stockholders and our independent directors. On June 13, 2011, our stockholders voted to allow us to issue common stock at a price below net asset value per share for a period of one year ending on the earlier of June 12, 2012 or the date of our 2012 annual meeting of stockholders. Our stockholders did not specify a maximum discount below net asset value at which we are able to issue our common stock; however, we do not intend to issue shares of our common stock below net asset value unless our Board of Directors determines that it would be in our stockholders best interests to do so.
Investing in our securities may involve an above average degree of risk.
The investments we make in accordance with our investment objective may result in a higher amount of risk than alternative investment options and a higher risk of volatility or loss of principal. Our investments in portfolio companies may be highly speculative, and therefore, an investment in our shares may not be suitable for someone with lower risk tolerance.
The market price of our securities may be volatile and fluctuate significantly.
Fluctuations in the trading prices of our shares may adversely affect the liquidity of the trading market for our shares and, if we seek to raise capital through future equity financings, our ability to raise such equity capital. The market price and liquidity of the market for our securities may be significantly affected by numerous factors, some of which are beyond our control and may not be directly related to our operating performance. These factors include:
| | significant volatility in the market price and trading volume of securities of BDCs or other companies in our sector, which are not necessarily related to the operating performance of these companies; |
| | changes in regulatory policies or tax guidelines, particularly with respect to RICs, BDCs or SBICs; |
| | inability to obtain certain exemptive relief from the SEC; |
| | loss of RIC status or either of our SBIC subsidiaries status as an SBIC; |
| | changes in earnings or variations in operating results; |
| | changes in the value of our portfolio of investments; |
| | any shortfall in investment income or net investment income or any increase in losses from levels expected by investors or securities analysts; |
| | conversion features of subscription rights, warrants or convertible debt; |
| | loss of a major funding source; |
| | fluctuations in interest rates; |
| | the operating performance of companies comparable to us; |
| | departure of our key personnel; |
| | proposed, or completed, offerings of our securities, including classes other than our common stock; |
| | global or national credit market changes; and |
50
Table of Contents
| | general economic trends and other external factors. |
As illustrated by recent events in the market for subprime loans, and mortgage securities generally, the market for any security is subject to volatility. The loans and securities purchased by us and issued by us are no exception to this fundamental investment truism that prices will fluctuate, although we lack any material exposure to the subprime and mortgage markets.
We may be unable to invest a significant portion of the net proceeds raised from our offerings on acceptable terms, which would harm our financial condition and operating results.
Delays in investing the net proceeds raised in our offerings may cause our performance to be worse than that of other fully invested BDCs or other lenders or investors pursuing comparable investment strategies. We cannot assure you that we will be able to identify any investments that meet our investment objective or that any investment that we make will produce a positive return. We may be unable to invest the net proceeds from any offering on acceptable terms within the time period that we anticipate or at all, which could harm our financial condition and operating results.
We anticipate that, depending on market conditions, it may take a substantial period of time to invest substantially all of the net proceeds of any offering in securities meeting our investment objective. During such a period, we have and will continue to invest the net proceeds of any offering primarily in cash, cash equivalents, U.S. Government securities, repurchase agreements and high-quality debt instruments maturing in one year or less from the time of investment, which may produce returns that are significantly lower than the returns which we expect to achieve when our portfolio is fully invested in securities meeting our investment objective, and given our expense ratio and the prevailing interest rate climate, there is a possible risk of losing money on the offering proceeds of certain securities, such as debt securities during this interval. As a result, any dividends or distributions that we pay during such period may be substantially lower than the dividends or distributions that we may be able to pay when our portfolio is fully invested in securities meeting our investment objective. In addition, until such time as the net proceeds of any offering are invested in securities meeting our investment objective, the market price for our securities may decline. Thus, the return on your investment may be lower than when, if ever, our portfolio is fully invested in securities meeting our investment objective.
In addition, the SBA limits our SBIC subsidiaries, Triangle SBIC and Triangle SBIC II, to investing idle funds in the following types of securities:
| | direct obligations of, or obligations guaranteed as to principal and interest by, the United States government, which mature within 15 months from the date of the investment; |
| | repurchase agreements with federally insured institutions with a maturity of seven days or less (and the securities underlying the repurchase obligations must be direct obligations of, or guaranteed by, the federal government); |
| | certificates of deposit with a maturity of one year or less, issued by a federally insured institution; or |
| | a deposit account in a federally insured institution that is subject to withdrawal restriction of one year or less. |
Recent conditions may increase the risks associated with our business and an investment in us.
Beginning in the third quarter of 2007, the U.S. economy and financial markets began experiencing a high level of volatility, disruption and stress, which was exacerbated by the failure of several major financial institutions in the last few months of 2008. In addition, the U.S. economy entered a recession, which was severe and prolonged. Similar conditions occurred in the financial markets and economies of numerous other countries and could worsen, both in the U.S. and globally. These conditions raised the level of many of the risks described herein and, if repeated or continued, could have an adverse effect on our portfolio companies and on their results
51
Table of Contents
of operations, financial conditions, access to credit and capital. The stress in the credit market and upon banks has led other creditors to tighten credit and the terms of credit. In certain cases, senior lenders to our customers can block payments by our customers in respect of our loans to such customers. In turn, these could have adverse effects on our business, financial condition, results of operations, dividend payments, access to capital, valuation of our assets and our stock price. Notwithstanding recent gains across both the equity and debt markets, these conditions may continue for a prolonged period of time or worsen in the future.
If, in the future, we sell common stock at a discount to our net asset value per share, stockholders who do not participate in such sale will experience immediate dilution in an amount that may be material.
On June 13, 2011, our stockholders approved our ability to sell an unlimited number of shares of our common stock at any level of discount from net asset value per share for a period of one year ending on the earlier of June 12, 2012 or the date of our 2012 annual meeting of stockholders. If we issue or sell shares of our common stock at a discount to net asset value, it will pose a risk of dilution to our stockholders. In particular, stockholders who do not purchase additional shares at or below the discounted price in proportion to their current ownership will experience an immediate decrease in net asset value per share (as well as in the aggregate net asset value of their shares if they do not participate at all). These stockholders will also experience a disproportionately greater decrease in their participation in our earnings and assets and their voting power than the increase we experience in our assets, potential earning power and voting interests from such issuances or sale. In addition, such sales may adversely affect the price at which our common stock trades.
If a substantial number of shares become available for sale and are sold in a short period of time, the market price of our common stock could decline.
As of December 31, 2011, we had 22,774,726 shares of common stock outstanding. Sales of substantial amounts of our common stock, or the availability of shares for sale, could adversely affect the prevailing market price of our common stock. If this occurs and continues, it could impair our ability to raise additional capital through the sale of equity securities should we desire to do so.
Provisions of the Maryland General Corporation Law and our charter and bylaws could deter takeover attempts and have an adverse impact on the price of our common stock.
The Maryland General Corporation Law and our charter and bylaws contain provisions that may have the effect of discouraging, delaying or making difficult a change in control of our Company or the removal of our incumbent directors. Specifically, our Board of Directors may adopt resolutions to classify our Board of Directors so that stockholders do not elect every director on an annual basis. Also, our charter provides that a director may be removed only for cause by the vote of at least two-thirds of the votes entitled to be cast for the election of directors generally. In addition, our bylaws provide that, subject to the satisfaction of certain procedural and informational requirements by the stockholders requesting the meeting, a special meeting of stockholders will be called by our secretary to act upon any matter that may properly be considered at a meeting of stockholders only upon the written request of the stockholders entitled to cast at least a majority of all the votes entitled to be cast on such matter at the meeting.
In addition, subject to the provisions of the 1940 Act, our charter permits our Board of Directors, without stockholder action, to authorize the issuance of shares of stock in one or more classes or series, including preferred stock. Subject to compliance with the 1940 Act, our Board of Directors may, without stockholder action, amend our charter from time to time to increase or decrease the number of shares of stock of any class or series that we have authority to issue. The existence of these provisions, among others, may have a negative impact on the price of our common stock and may discourage third party bids for ownership of our company. These provisions may prevent any premiums being offered to you for shares of our common stock.
The trading market or market value of our publicly issued debt securities may be volatile.
Our publicly issued debt securities may or may not have an established trading market. We cannot assure investors that a trading market for our publicly issued debt securities will ever develop or be maintained if developed.
52
Table of Contents
In addition to our creditworthiness, many factors may materially adversely affect the trading market for, and market value of, our publicly issued debt securities. These factors include, but are not limited to, the following:
| | the time remaining to the maturity of these debt securities; |
| | the outstanding principal amount of debt securities with terms identical to these debt securities; |
| | the general economic environment; |
| | the supply of debt securities trading in the secondary market, if any; |
| | the redemption or repayment, if any, of these debt securities; |
| | the level, direction and volatility of market interest rates generally; and |
| | market rates of interest higher or lower than rates borne by the debt securities. |
There also may be a limited number of buyers for our debt securities. This too may materially adversely affect the market value of the debt securities or the trading market for the debt securities.
Our credit ratings may not reflect all risks of an investment in our debt securities.
Our credit ratings, if any, are an assessment by third parties of our ability to pay our obligations. Consequently, real or anticipated changes in our credit ratings will generally affect the market value of our debt securities. Our credit ratings, however, may not reflect the potential impact of risks related to market conditions generally or other factors discussed herein about the market value of, or trading market for, the publicly issued debt securities.
Terms relating to redemption may materially adversely affect the return on our debt securities.
If our debt securities are redeemable at our option, we may choose to redeem the debt securities at times when prevailing interest rates are lower than the interest rate paid on the debt securities. In addition, if the debt securities are subject to mandatory redemption, we may be required to redeem the debt securities at times when prevailing interest rates are lower than the interest rate paid on the debt securities. In this circumstance, a holder of our debt securities may not be able to reinvest the redemption proceeds in a comparable security at an effective interest rate as high as the debt securities being redeemed.
There is a risk that investors in our common stock may not receive dividends or that our dividends may not grow over time and that investors in our debt securities may not receive all of the interest income to which they are entitled.
We intend to make distributions on a quarterly basis to our stockholders out of assets legally available for distribution. We cannot assure you that we will achieve investment results that will allow us to make a specified level of cash distributions or year-to-year increases in cash distributions. If we declare a dividend and if more stockholders opt to receive cash distributions rather than participate in our dividend reinvestment plan, we may be forced to sell some of our investments in order to make cash dividend payments.
In addition, due to the asset coverage test applicable to us as a BDC, we may be limited in our ability to make distributions. Further, if we invest a greater amount of assets in equity securities that do not pay current dividends, it could reduce the amount available for distribution. See Item 5. Market for Registrants Common Equity, Related Stockholder Matters and Issuer Purchases of Equity Securities Distribution Policy for further discussion of distributions.
The above-referenced restrictions on distributions may also inhibit our ability to make required interest payments to holders of our debt, which may cause a default under the terms of our debt agreements. Such a default could materially increase our cost of raising capital, as well as cause us to incur penalties under the terms of our debt agreements.
53
Table of Contents
Our stockholders will experience dilution in their ownership percentage if they opt out of our dividend reinvestment plan.
All dividends declared in cash payable to stockholders that are participants in our dividend reinvestment plan are automatically reinvested in shares of our common stock. As a result, our stockholders that opt out of our dividend reinvestment plan will experience dilution in their ownership percentage of our common stock over time.
Future offerings of additional debt securities, which would be senior to our common stock upon liquidation, or equity securities, which could dilute our existing stockholders and may be senior to our common stock for the purposes of distributions, may harm the value of our common stock.
In the future, we may attempt to increase our capital resources by making additional offerings of debt or equity securities, including commercial paper, medium-term notes, senior or subordinated notes and classes of preferred stock or common stock subject to the restrictions of the 1940 Act. Upon a liquidation of our company, holders of our debt securities and shares of preferred stock and lenders with respect to other borrowings would receive a distribution of our available assets prior to the holders of our common stock. Additional equity offerings by us may dilute the holdings of our existing stockholders or reduce the value of our common stock, or both. Any preferred stock we may issue would have a preference on distributions that could limit our ability to make distributions to the holders of our common stock. Because our decision to issue securities in any future offering will depend on market conditions and other factors beyond our control, we cannot predict or estimate the amount, timing or nature of our future offerings. Thus, our stockholders bear the risk of our future offerings reducing the market price of our common stock and diluting their stock holdings in us. In addition, proceeds from a sale of common stock will likely be used to increase our total assets or to pay down our borrowings, among other uses. This would increase our asset coverage ratio and permit us to incur additional leverage under rules pertaining to BDCs by increasing our borrowings or issuing senior securities such as preferred stock or additional debt securities.
Terrorist attacks, acts of war or national disasters may affect any market for our securities, impact the businesses in which we invest and harm our business, operating results and financial condition.
Terrorist acts, acts of war or national disasters may disrupt our operations, as well as the operations of the businesses in which we invest. Such acts have created, and continue to create, economic and political uncertainties and have contributed to global economic instability. Future terrorist activities, military or security operations, or natural disasters could further weaken the domestic/global economies and create additional uncertainties, which may negatively impact the businesses in which we invest directly or indirectly and, in turn, could have a material adverse impact on our business, operating results and financial condition. Losses from terrorist attacks and natural disasters are generally uninsurable.
| Item 1B. | Unresolved Staff Comments. |
Not applicable.
| Item 2. | Properties. |
We do not own any real estate or other physical properties materially important to our operation or any of our subsidiaries. Currently, we lease approximately 11,027 square feet of office space located at 3700 Glenwood Avenue, Suite 530, Raleigh, North Carolina 27612. We believe that our current facilities are adequate for our business as we intend to conduct it.
| Item 3. | Legal Proceedings. |
We are not a party to any pending legal proceedings.
| Item 4. | Mine Safety Disclosures. |
Not applicable.
54
Table of Contents
PART II
Item 5. Market for Registrants Common Equity, Related Stockholder Matters and Issuer Purchases of
Equity Securities.
Common Stock and Holders
Our common stock began trading on the Nasdaq Global Select Market under the symbol TCAP on February 15, 2007. Prior to that date, there was no established public trading market for our common stock. On December 29, 2010, we transferred our listing of common stock to the New York Stock Exchange, or NYSE, under the existing ticker symbol TCAP. As a result of our transfer, we voluntarily ceased trading on the Nasdaq Global Select Market. The following table sets forth the range of high and low intraday sales prices per share of our common stock as reported on the respective exchange for the periods indicated.
| High | Low | |||||||
| First Quarter of 2010 |
14.53 | 11.45 | ||||||
| Second Quarter of 2010 |
16.38 | 12.16 | ||||||
| Third Quarter of 2010 |
16.81 | 14.06 | ||||||
| Fourth Quarter of 2010 |
20.97 | 15.90 | ||||||
| First Quarter of 2011 |
20.93 | 16.23 | ||||||
| Second Quarter of 2011 |
19.27 | 17.37 | ||||||
| Third Quarter of 2011 |
19.14 | 14.75 | ||||||
| Fourth Quarter of 2011 |
19.37 | 13.62 | ||||||
As of March 2, 2012, there were approximately 56 holders of record of the common stock. This number does not include stockholders for whom shares are held in nominee or street name.
Distributions Declared
We intend to make distributions on a quarterly basis to our stockholders of substantially all of our income. We may make deemed distributions of certain net capital gains to our stockholders.
The following table summarizes our distributions declared during the years ended December 31, 2010 and 2011:
| Date Declared |
Record Date |
Payment Date |
Amount |
|||
| March 11, 2010 |
March 25, 2010 | April 8, 2010 | 0.41 | |||
| June 1, 2010 |
June 15, 2010 | June 29, 2010 | 0.41 | |||
| August 25, 2010 |
September 8, 2010 | September 22, 2010 | 0.41 | |||
| December 1, 2010 |
December 15, 2010 | December 29, 2010 | 0.42 | |||
| February 23, 2011 |
March 16, 2011 | March 30, 2011 | 0.42 | |||
| May 31, 2011 |
June 15, 2011 | June 29, 2011 | 0.44 | |||
| August 31, 2011 |
September 14, 2011 | September 28, 2011 | 0.44 | |||
| November 2, 2011 |
December 14, 2011 | December 28, 2011 | 0.47 |
In addition, during 2011 we designated approximately $1.4 million, or $0.06 per share, of our net long-term capital gains as a deemed distribution to stockholders of record as of December 31, 2011. We paid U.S. federal income taxes of approximately $0.5 million related to this deemed distribution. See Distribution Policy for further discussion of deemed distributions.
Each year, a statement on IRS Form 1099-DIV identifying the source(s) of the distribution (i.e., paid from ordinary income, paid from net capital gains on the sale of securities, and/or a return of paid-in-capital surplus which is a nontaxable distribution) is mailed to our stockholders. To the extent that our distributions for a fiscal
55
Table of Contents
year exceed current and accumulated earnings and profits, a portion of those distributions may be deemed a return of capital to our stockholders for U.S. federal income tax purposes. Thus, the source of a distribution to our stockholders may be the original capital invested by the stockholder rather than our taxable ordinary income or capital gains. Stockholders should read any written disclosure accompanying a dividend payment carefully and should not assume that any distribution is taxable as ordinary income or capital gains.
The table below shows the detail of our distributions for the years ended December 31, 2011 and 2010:
| Years Ended December 31, | ||||||||||||||||
| 2011 | 2010 | |||||||||||||||
| Amount | % of Total | Amount | % of Total | |||||||||||||
| Ordinary income |
$ | 1.77 | 100.0 | % | $ | 1.61 | 97.6 | % | ||||||||
| Capital gains |
| | 0.04 | 2.4 | ||||||||||||
|
|
|
|
|
|
|
|
|
|||||||||
| Total reported on tax Form 1099-DIV |
$ | 1.77 | 100.0 | % | $ | 1.65 | 100.0 | % | ||||||||
|
|
|
|
|
|
|
|
|
|||||||||
Ordinary income is reported on IRS Form 1099-DIV as either qualified or non-qualified and capital gain distributions are reported on IRS Form 1099-DIV in various subcategories which have differing tax treatments to stockholders. Those subcategories are not presented herein.
Distribution Policy
We generally intend to make distributions on a quarterly basis to our stockholders of substantially all of our income. In order to avoid certain excise taxes imposed on RICs, we must distribute during each calendar year an amount at least equal to the sum of (1) 98.0% of our ordinary income for the calendar year, (2) 98.2% of our capital gains in excess of capital losses for the calendar year, and (3) any ordinary income and net capital gains for the preceding year that were not distributed during such year. We will not be subject to excise taxes on amounts on which we are required to pay corporate income tax (such as retained net capital gains). In order to obtain the tax benefits applicable to RICs, we will be required to distribute to our stockholders with respect to each taxable year at least 90.0% of our ordinary income and realized net short-term capital gains in excess of realized net long-term capital losses. We may retain for investment realized net long-term capital gains in excess of realized net short-term capital losses. We may make deemed distributions to our stockholders of any retained net capital gains. If this happens, our stockholders will be treated as if they received an actual distribution of the capital gains we retain and then reinvested the net after-tax proceeds in our common stock. Our stockholders also may be eligible to claim a tax credit (or, in certain circumstances, a tax refund) equal to their allocable share of the tax we paid on the capital gains deemed distributed to them. Please refer to Business Material U.S. Federal Income Tax Considerations included in Item 1 of Part I of this Annual Report for further information regarding the consequences of our retention of net capital gains. We may, in the future, make actual distributions to our stockholders of some or all realized net long-term capital gains in excess of realized net short-term capital losses. We can offer no assurance that we will achieve results that will permit the payment of any cash distributions and, if we issue senior securities, we will be prohibited from making distributions if doing so causes us to fail to maintain the asset coverage ratios stipulated by the 1940 Act or if distributions are limited by the terms of any of our borrowings. See Business Regulation of Business Development Companies included in Item 1 of Part I of this Annual Report.
We have adopted a dividend reinvestment plan, or DRIP, that provides for reinvestment of our distributions on behalf of our common stockholders, unless a common stockholder elects to receive cash as provided below. As a result, if our Board of Directors authorizes, and we declare, a cash dividend, then our common stockholders who have not opted out of our DRIP will have their cash dividends automatically reinvested in additional shares of our common stock, rather than receiving the cash dividends.
No action will be required on the part of a registered common stockholder to have their cash dividend reinvested in shares of our common stock. A registered stockholder may elect to receive an entire dividend in
56
Table of Contents
cash by notifying Computershare, the Plan Administrator (our transfer agent and registrar), in writing so that such notice is received by the Plan Administrator no later than the record date for dividends to stockholders. The Plan Administrator will set up an account for shares acquired through the DRIP for each stockholder who has not elected to receive dividends in cash and hold such shares in non-certificated form. Upon request by a stockholder participating in the DRIP, received in writing not less than three days prior to the record date, the Plan Administrator will, instead of crediting shares to the participants account, issue a certificate registered in the participants name for the number of whole shares of our common stock and a check for any fractional share. Those stockholders whose shares are held by a broker or other financial intermediary may receive dividends in cash by notifying their broker or other financial intermediary of their election.
We intend to use primarily newly issued shares to implement the DRIP, so long as our shares are trading at or above net asset value. If our shares are trading below net asset value, we intend to purchase shares in the open market in connection with our implementation of the DRIP. If we use newly issued shares to implement the DRIP, the number of shares to be issued to a stockholder is determined by dividing the total dollar amount of the dividend payable to such stockholder by the market price per share of our common stock at the close of regular trading on the NYSE on the dividend payment date. Market price per share on that date will be the closing price for such shares on the NYSE or, if no sale is reported for such day, at the average of their reported bid and asked prices. If we purchase shares in the open market to implement the DRIP, the number of shares to be issued to a stockholder is determined by dividing the total dollar amount of the dividend payable to such stockholder by the average price per share for all shares purchased by the Plan Administrator in the open market in connection with the dividend. The number of shares of our common stock to be outstanding after giving effect to payment of the dividend cannot be established until the value per share at which additional shares will be issued has been determined and elections of our stockholders have been tabulated.
There are no brokerage charges or other charges to stockholders for participating in the DRIP. However, certain brokerage firms may charge brokerage charges or other charges to their customers. We pay the Plan Administrators fees under the DRIP. If a participant elects by written notice to the Plan Administrator to have the Plan Administrator sell part or all of the shares held by the Plan Administrator in the participants account and remit the proceeds to the participant, the Plan Administrator is authorized to deduct a $15.00 transaction fee plus a $0.10 per share brokerage commission from such participants proceeds.
Stockholders who receive dividends in the form of stock generally are subject to the same federal, state and local tax consequences as are stockholders who elect to receive their dividends in cash. A stockholders basis for determining gain or loss upon the sale of stock received in a dividend from us will be equal to the total dollar amount of the dividend payable to the stockholder. Any stock received in a dividend will have a holding period for tax purposes commencing on the day following the day on which the shares are credited to the U.S. stockholders account.
Participants may terminate their accounts under the DRIP by notifying the Plan Administrator via its website at https://www.bnymellon.com/shareowner/equityaccess, by filling out the transaction request form located at the bottom of their statement and sending it to the Plan Administrator at Computershare Shareowner Services LLC, P.O. Box 358035, Pittsburgh, Pennsylvania 15252-8015, or by calling the Plan Administrator at (866) 228-7201.
We may terminate the DRIP upon notice in writing mailed to each participant at least 30 days prior to any record date for the payment of any dividend by us. All correspondence concerning the DRIP should be directed to the Plan Administrator by mail at Computershare Shareowner Services LLC, P.O. Box 358035, Pittsburgh, Pennsylvania 15252-8015.
Our ability to make distributions will be limited by the asset coverage requirements under the 1940 Act. For a more detailed discussion, see Regulation included in Item 1 of Part I of this Annual Report on Form 10-K.
57
Table of Contents
Securities Authorized for Issuance Under our Equity Incentive Plan
Our Board of Directors and sole stockholder approved the Triangle Capital Corporation 2007 Equity Incentive Plan, or the Original Plan, effective February 13, 2007, for the purpose of attracting and retaining the services of executive officers, directors and other key employees. During our fiscal year ended December 31, 2007, no equity incentive awards were granted under the Original Plan, in part due to certain 1940 Act restrictions which disallow the issuance of certain types of compensation to a BDCs non-employee directors and employees without having first obtained exemptive relief. In 2007, we filed a request with the SEC for such exemptive relief with respect to our ability to issue restricted stock to our employees and non-employee directors. On March 18, 2008 we received an order from the SEC authorizing such issuance of restricted stock to our employees and non-employee directors pursuant to the terms of the Amended and Restated Plan and as otherwise set forth in the exemptive order. In 2008, our Board approved, and the stockholders voted to approve, the Triangle Capital Corporation Amended and Restated 2007 Equity Incentive Plan, or the Amended and Restated Plan.
The following table provides information regarding the number of shares of restricted stock authorized and available under the Amended and Restated Plan as of December 31, 2011:
| Plan Category |
Number of securities to be issued upon exercise of outstanding options, warrants and rights |
Weighted-average exercise price of outstanding options, warrants and rights |
Number of
securities remaining available for future issuance under equity compensation plans (excluding securities reflected in column(a) |
|||||||||
| (a) | (b) | (c) | ||||||||||
| Equity compensation plans approved by security holders(1) |
| | 387,485 | (2) | ||||||||
| Equity compensation plans not approved by security holders |
| | | |||||||||
|
|
|
|
|
|
|
|||||||
| Total |
| | 387,485 | |||||||||
|
|
|
|
|
|
|
|||||||
| (1) | The Amended and Restated Plan is the only equity compensation plan currently utilized by the Company. |
| (2) | The Amended and Restated Plan has an aggregate of 900,000 shares of common stock reserved for issuance. |
Sales of Unregistered Securities
During the year ended December 31, 2011, we issued a total of 241,630 shares of our common stock under our DRIP pursuant to an exemption from the registration requirements of the Securities Act of 1933. The aggregate offering price for the shares of common stock sold under the DRIP was approximately $4.2 million.
Issuer Purchases of Equity Securities
Pursuant to Section 23(c)(1) of the 1940 Act, we intend to purchase our common stock in the open market in order to satisfy our DRIP obligations if, at the time of the distribution of any dividend, our common stock is trading at a price per share below net asset value. We did not purchase any shares of our common stock during the three months ended December 31, 2011.
58
Table of Contents
Performance Graph
The following graph compares the cumulative total return on our common stock with the cumulative total return of the Triangle Capital Corporation Peer Group Index, the Nasdaq Composite Index and the NYSE Composite Index for the five years ended December 31, 2011. This comparison assumes $100.00 was invested at the closing price of our common stock on February 15, 2007 (the date our common stock began to trade on the Nasdaq Global Market in connection with our initial public offering) in our common stock and in the comparison groups and assumes the reinvestment of all cash dividends on the ex-dividend date prior to any tax effect. The stock price performance shown on the graph below is not necessarily indicative of future price performance.
Comparison of Annual Cumulative Total Return(1)
among Triangle Capital Corporation, the Triangle Capital Corporation
Peer Group Index, the Nasdaq Composite Index and the NYSE Composite Index
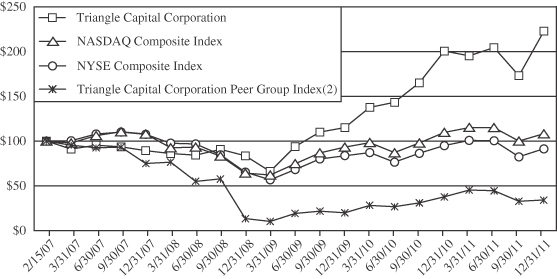
| 2/15/07 | 3/31/07 | 6/30/07 | 9/30/07 | 12/31/07 | 3/31/08 | 6/30/08 | 9/30/08 | 12/31/08 | ||||||||||||||||||||||||||||
| Triangle Capital Corporation |
100.00 | 91.00 | 95.43 | 93.44 | 89.40 | 85.94 | 84.29 | 90.74 | 83.45 | |||||||||||||||||||||||||||
| NASDAQ Composite Index |
100.00 | 97.90 | 106.06 | 110.45 | 107.87 | 92.54 | 93.09 | 83.25 | 64.09 | |||||||||||||||||||||||||||
| NYSE Composite Index |
100.00 | 100.46 | 107.83 | 110.15 | 107.40 | 97.60 | 96.78 | 84.70 | 65.24 | |||||||||||||||||||||||||||
| Triangle Capital Corporation Peer Group Index(2) |
100.00 | 95.40 | 92.52 | 93.07 | 74.99 | 76.55 | 55.04 | 57.62 | 13.33 | |||||||||||||||||||||||||||
| 3/31/09 | 6/30/09 | 9/30/09 | 12/31/09 | 3/31/10 | 6/30/10 | 9/30/10 | 12/31/10 | |||||||||||||||||||||||||
| Triangle Capital Corporation |
65.96 | 93.79 | 109.91 | 115.08 | 137.47 | 143.29 | 165.13 | 200.61 | ||||||||||||||||||||||||
| NASDAQ Composite Index |
62.16 | 74.76 | 86.68 | 93.10 | 98.38 | 86.95 | 97.89 | 109.67 | ||||||||||||||||||||||||
| NYSE Composite Index |
56.87 | 68.02 | 80.07 | 83.69 | 87.22 | 76.27 | 86.32 | 94.90 | ||||||||||||||||||||||||
| Triangle Capital Corporation Peer Group Index(2) |
10.22 | 19.07 | 21.63 | 19.93 | 28.18 | 26.59 | 30.95 | 37.60 | ||||||||||||||||||||||||
59
Table of Contents
| 3/31/11 | 6/30/11 | 9/30/11 | 12/31/11 | |||||||||||||
| Triangle Capital Corporation |
195.17 | 204.30 | 172.88 | 222.71 | ||||||||||||
| NASDAQ Composite Index |
115.19 | 114.95 | 99.89 | 108.07 | ||||||||||||
| NYSE Composite Index |
100.67 | 100.30 | 82.38 | 91.25 | ||||||||||||
| Triangle Capital Corporation Peer Group Index(2) |
45.21 | 44.46 | 32.72 | 34.07 | ||||||||||||
| (1) | From February 15, 2007, the date our common stock began to trade on the Nasdaq Global Market in connection with our initial public offering to December 31, 2011. |
| (2) | The Triangle Capital Corporation Peer Group consists of the following internally-managed closed-end investment companies that have elected to be regulated as BDCs under the 1940 Act: American Capital Ltd., Fifth Street Finance Corp., Harris & Harris Group, Inc., Hercules Technology Growth Capital, Inc., Kohlberg Capital Corporation, Main Street Capital Corporation and MCG Capital Corporation. |
60
Table of Contents
| Item 6. | Selected Financial Data. |
As discussed further in Note 1 to our financial statements included in Item 8 of this Annual Report on Form 10-K, on February 21, 2007, concurrent with the closing of our initial public offering (the IPO), we acquired Triangle SBIC and TML (Triangle SBICs General Partner) in exchange for shares of our common stock. These acquisitions constituted an exchange of shares between entities under common control. In accordance with the guidance on exchanges of shares between entities under common control contained in FASB Accounting Standards Codification Topic 805, Business Combinations, the selected historical financial and other data below for the year ended December 31, 2007 are presented as if the acquisition had occurred as of January 1, 2007. The selected financial data at and for the fiscal years ended December 31, 2007, 2008, 2009, 2010 and 2011, have been derived from our financial statements that have been audited by Ernst & Young LLP, an independent registered public accounting firm. You should read this selected financial and other data in conjunction with our Managements Discussion and Analysis of Financial Condition and Results of Operations and the financial statements and notes thereto.
| Year Ended December 31, | ||||||||||||||||||||
| 2007 | 2008 | 2009 | 2010 | 2011 | ||||||||||||||||
| (Dollars in thousands, except per share data) | ||||||||||||||||||||
| Income statement data: |
||||||||||||||||||||
| Investment income: |
||||||||||||||||||||
| Total interest, fee and dividend income |
$ | 10,912 | $ | 21,056 | $ | 27,149 | $ | 35,641 | $ | 63,002 | ||||||||||
| Interest income from cash and cash equivalent investments |
1,824 | 303 | 613 | 344 | 362 | |||||||||||||||
|
|
|
|
|
|
|
|
|
|
|
|||||||||||
| Total investment income |
12,736 | 21,359 | 27,762 | 35,985 | 63,364 | |||||||||||||||
| Expenses: |
||||||||||||||||||||
| Interest expense |
2,073 | 4,228 | 6,900 | 7,350 | 10,114 | |||||||||||||||
| Amortization of deferred financing fees |
113 | 255 | 364 | 797 | 946 | |||||||||||||||
| Management fees |
233 | | | | | |||||||||||||||
| General and administrative expenses |
3,894 | 6,254 | 6,449 | 7,689 | 11,966 | |||||||||||||||
|
|
|
|
|
|
|
|
|
|
|
|||||||||||
| Total expenses |
6,313 | 10,737 | 13,713 | 15,836 | 23,026 | |||||||||||||||
|
|
|
|
|
|
|
|
|
|
|
|||||||||||
| Net investment income |
6,423 | 10,622 | 14,049 | 20,149 | 40,338 | |||||||||||||||
|
|
|
|
|
|
|
|
|
|
|
|||||||||||
| Net realized gains (losses): |
||||||||||||||||||||
| Net realized gain (loss) on investments Non- |
(760 | ) | (1,393 | ) | 448 | (1,623 | ) | 1,895 | ||||||||||||
| Net realized gain (loss) on investments Affiliate |
141 | | | (3,856 | ) | | ||||||||||||||
| Net realized gain on investments Control |
| 2,829 | | | 9,079 | |||||||||||||||
|
|
|
|
|
|
|
|
|
|
|
|||||||||||
| Total net realized gains (losses) |
(619 | ) | 1,436 | 448 | (5,479 | ) | 10,974 | |||||||||||||
| Net unrealized appreciation (depreciation) of investments |
3,061 | (4,286 | ) | (10,310 | ) | 10,941 | 6,367 | |||||||||||||
|
|
|
|
|
|
|
|
|
|
|
|||||||||||
| Total net gain (loss) on investments |
2,442 | (2,850 | ) | (9,862 | ) | 5,462 | 17,341 | |||||||||||||
| Provision for income taxes |
(52 | ) | (133 | ) | (150 | ) | (220 | ) | (908 | ) | ||||||||||
|
|
|
|
|
|
|
|
|
|
|
|||||||||||
| Net increase in net assets resulting from operations |
$ | 8,813 | $ | 7,639 | $ | 4,037 | $ | 25,391 | $ | 56,771 | ||||||||||
|
|
|
|
|
|
|
|
|
|
|
|||||||||||
| Net investment income per share basic and diluted |
$ | 0.95 | $ | 1.54 | $ | 1.63 | $ | 1.58 | $ | 2.06 | ||||||||||
| Net increase in net assets resulting from operations per share basic and diluted |
$ | 1.31 | $ | 1.11 | $ | 0.47 | $ | 1.99 | $ | 2.90 | ||||||||||
| Net asset value per common share |
$ | 13.74 | $ | 13.22 | $ | 11.03 | $ | 12.09 | $ | 14.68 | ||||||||||
| Dividends declared per common share |
$ | 0.98 | $ | 1.44 | $ | 1.62 | $ | 1.61 | $ | 1.77 | ||||||||||
| Capital gains distributions declared per common share |
$ | | $ | | $ | 0.05 | $ | 0.04 | $ | | ||||||||||
61
Table of Contents
| Year Ended December 31, | ||||||||||||||||||||
| 2007 | 2008 | 2009 | 2010 | 2011 | ||||||||||||||||
| (Dollars in thousands) | ||||||||||||||||||||
| Balance sheet data: |
||||||||||||||||||||
| Assets: |
||||||||||||||||||||
| Investments at fair value |
$ | 113,037 | $ | 182,105 | $ | 201,318 | $ | 325,991 | $ | 507,079 | ||||||||||
| Cash and cash equivalents |
21,788 | 27,193 | 55,200 | 54,820 | 66,868 | |||||||||||||||
| Interest and fees receivable |
305 | 680 | 677 | 868 | 1,884 | |||||||||||||||
| Prepaid expenses and other current assets |
47 | 95 | 287 | 119 | 623 | |||||||||||||||
| Property and equipment, net |
34 | 48 | 29 | 47 | 58 | |||||||||||||||
| Deferred financing fees |
999 | 3,546 | 3,540 | 6,200 | 6,683 | |||||||||||||||
|
|
|
|
|
|
|
|
|
|
|
|||||||||||
| Total assets |
$ | 136,210 | $ | 213,667 | $ | 261,051 | $ | 388,045 | $ | 583,195 | ||||||||||
|
|
|
|
|
|
|
|
|
|
|
|||||||||||
| Liabilities and partners capital: |
||||||||||||||||||||
| Accounts payable and accrued liabilities |
$ | 1,144 | $ | 1,609 | $ | 2,222 | $ | 2,269 | $ | 4,117 | ||||||||||
| Interest payable |
699 | 1,882 | 2,334 | 2,388 | 3,522 | |||||||||||||||
| Distribution / dividends payable |
2,041 | 2,767 | 4,775 | | | |||||||||||||||
| Income taxes payable |
52 | 30 | 59 | 198 | 1,403 | |||||||||||||||
| Deferred revenue |
31 | | 75 | 37 | | |||||||||||||||
| Deferred income taxes |
1,760 | 844 | 577 | 209 | 629 | |||||||||||||||
| Credit facility |
| | | | 15,000 | |||||||||||||||
| SBA-guaranteed debentures payable |
37,010 | 115,110 | 121,910 | 202,465 | 224,237 | |||||||||||||||
|
|
|
|
|
|
|
|
|
|
|
|||||||||||
| Total liabilities |
42,737 | 122,242 | 131,952 | 207,566 | 248,908 | |||||||||||||||
| Total partners capital / stockholders equity |
93,473 | 91,425 | 129,099 | 180,479 | 334,287 | |||||||||||||||
|
|
|
|
|
|
|
|
|
|
|
|||||||||||
| Total liabilities and partners capital / stockholders equity |
$ | 136,210 | $ | 213,667 | $ | 261,051 | $ | 388,045 | $ | 583,195 | ||||||||||
|
|
|
|
|
|
|
|
|
|
|
|||||||||||
| Other data: |
||||||||||||||||||||
| Weighted average yield on total investments(1) |
12.6 | % | 13.2 | % | 13.5 | % | 13.7 | % | 13.9 | % | ||||||||||
| Number of portfolio companies |
26 | 34 | 37 | 48 | 63 | |||||||||||||||
| Expense ratios (as percentage of average net assets): |
||||||||||||||||||||
| Operating expenses |
4.4 | % | 6.6 | % | 6.6 | % | 5.3 | % | 4.4 | % | ||||||||||
| Interest expense and deferred financing fees |
2.4 | 4.7 | 7.4 | 5.6 | 4.1 | |||||||||||||||
|
|
|
|
|
|
|
|
|
|
|
|||||||||||
| Total expenses |
6.8 | % | 11.3 | % | 14.0 | % | 10.9 | % | 8.5 | % | ||||||||||
|
|
|
|
|
|
|
|
|
|
|
|||||||||||
| (1) | Excludes non-accrual debt investments |
62
Table of Contents
Item 7. Managements Discussion and Analysis of Financial Condition and Results of Operations.
The information in this section contains forward-looking statements that involve risks and uncertainties. Please see Risk Factors and Special Note Regarding Forward-Looking Statements for a discussion of the uncertainties, risks and assumptions associated with these statements. You should read the following discussion in conjunction with the combined financial statements and related notes and other financial information appearing elsewhere in this Annual Report.
The following discussion is designed to provide a better understanding of our financial statements, including a brief discussion of our business, key factors that impacted our performance and a summary of our operating results. The following discussion should be read in conjunction with the Financial Statements and the notes thereto included in Item 8 of this Annual Report on Form 10-K. Historical results and percentage relationships among any amounts in the financial statements are not necessarily indicative of trends in operating results for any future periods.
Overview of our Business
We are a Maryland corporation which has elected to be treated and operates as an internally managed business development company, or BDC, under the Investment Company Act of 1940, or 1940 Act. Our wholly-owned subsidiaries, Triangle Mezzanine Fund LLLP, or Triangle SBIC, and Triangle Mezzanine Fund II LP, or Triangle SBIC II, are licensed as small business investment companies, or SBICs, by the United States Small Business Administration, or SBA. In addition, Triangle SBIC has also elected to be treated as a BDC under the 1940 Act. We, Triangle SBIC and Triangle SBIC II invest primarily in debt instruments, equity investments, warrants and other securities of lower middle market privately held companies located in the United States.
Our business is to provide capital to lower middle market companies in the United States. We focus on investments in companies with a history of generating revenues and positive cash flows, an established market position and a proven management team with a strong operating discipline. Our target portfolio company has annual revenues between $20.0 million and $200.0 million and annual earnings before interest, taxes, depreciation and amortization, or EBITDA, between $3.0 million and $20.0 million.
We invest primarily in subordinated debt securities secured by second lien security interests in portfolio company assets, coupled with equity interests. On a more limited basis, we also invest in senior debt securities secured by first lien security interests in portfolio companies. Our investments generally range from $5.0 million to $20.0 million per portfolio company. In certain situations, we have partnered with other funds to provide larger financing commitments.
We generate revenues in the form of interest income, primarily from our investments in debt securities, loan origination and other fees and dividend income. Fees generated in connection with our debt investments are recognized over the life of the loan using the effective interest method or, in some cases, recognized as earned. In addition, we generate revenue in the form of capital gains, if any, on warrants or other equity-related securities that we acquire from our portfolio companies. Our debt investments generally have a term of between three and seven years and typically bear interest at fixed rates between 12.0% and 17.0% per annum. Certain of our debt investments have a form of interest, referred to as payment in kind, or PIK, interest, that is not paid currently but is instead accrued and added to the loan balance and paid at the end of the term. In our negotiations with potential portfolio companies, we generally seek to minimize PIK interest. Cash interest on our debt investments is generally payable monthly; however, some of our debt investments pay cash interest on a quarterly basis. As of December 31, 2011 and 2010, the weighted average yield on our outstanding debt investments other than non-accrual debt investments (including PIK interest) was approximately 15.0% and 15.1%, respectively. The weighted average yield on all of our outstanding investments (including equity and equity-linked investments but excluding non-accrual debt investments) was approximately 13.9% and 13.7% as of December 31, 2011 and 2010, respectively. The weighted average yield on all of our outstanding investments (including equity and equity-linked investments and non-accrual debt investments) was approximately 13.6% and 12.9% as of December 31, 2011 and 2010, respectively.
63
Table of Contents
Triangle SBIC and Triangle SBIC II are eligible to issue debentures to the SBA, which pools these with debentures of other SBICs and sells them in the capital markets at favorable interest rates, in part as a result of the guarantee of payment from the SBA. Triangle SBIC and Triangle SBIC II invest these funds in portfolio companies. We intend to continue to operate Triangle SBIC and Triangle SBIC II as SBICs, subject to SBA approval, and to utilize the proceeds from the issuance of SBA-guaranteed debentures, referred to herein as SBA leverage, to enhance returns to our stockholders.
Portfolio Composition
The total value of our investment portfolio was $507.1 million as of December 31, 2011, as compared to $326.0 million as of December 31, 2010. As of December 31, 2011, we had investments in 63 portfolio companies with an aggregate cost of $498.3 million. As of December 31, 2010, we had investments in 48 portfolio companies with an aggregate cost of $324.0 million. As of both December 31, 2011 and 2010, none of our portfolio investments represented greater than 10% of the total fair value of our investment portfolio.
As of December 31, 2011 and December 31, 2010, our investment portfolio consisted of the following investments:
| Cost |
Percentage of Total Portfolio |
Fair Value |
Percentage of Total Portfolio |
|||||||||||||
| December 31, 2011: |
||||||||||||||||
| Subordinated debt and 2nd lien notes |
$ | 393,830,719 | 79 | % | $ | 387,169,056 | 76 | % | ||||||||
| Senior debt and 1st lien notes |
60,622,827 | 12 | 59,974,195 | 12 | ||||||||||||
| Equity shares |
34,741,728 | 7 | 43,972,024 | 9 | ||||||||||||
| Equity warrants |
8,272,380 | 2 | 15,043,300 | 3 | ||||||||||||
| Royalty rights |
874,400 | | 920,000 | | ||||||||||||
|
|
|
|
|
|
|
|
|
|||||||||
| $ | 498,342,054 | 100 | % | $ | 507,078,575 | 100 | % | |||||||||
|
|
|
|
|
|
|
|
|
|||||||||
| December 31, 2010: |
||||||||||||||||
| Subordinated debt and 2nd lien notes |
$ | 242,169,361 | 75 | % | $ | 234,049,688 | 72 | % | ||||||||
| Senior debt and 1st lien notes |
45,896,174 | 14 | 44,584,148 | 14 | ||||||||||||
| Equity shares |
29,115,890 | 9 | 38,719,699 | 12 | ||||||||||||
| Equity warrants |
5,985,882 | 2 | 7,902,458 | 2 | ||||||||||||
| Royalty rights |
874,400 | | 734,600 | | ||||||||||||
|
|
|
|
|
|
|
|
|
|||||||||
| $ | 324,041,707 | 100 | % | $ | 325,990,593 | 100 | % | |||||||||
|
|
|
|
|
|
|
|
|
|||||||||
Investment Activity
During the year ended December 31, 2011, the Company made twenty-one new investments, including recapitalizations of existing portfolio companies, totaling $200.2 million, seven additional debt investments in existing portfolio companies of $24.3 million and five additional equity investments in existing portfolio companies totaling approximately $0.5 million. In addition, we sold three equity investments in portfolio companies for total proceeds of approximately $17.8 million, resulting in realized gains totaling approximately $13.5 million, and converted subordinated debt investments in one portfolio company to equity, resulting in a realized loss of approximately $3.0 million. We had seven portfolio company loans repaid at par totaling approximately $39.8 million, which resulted in realized gains totaling approximately $0.5 million, and received normal principal repayments, partial loan prepayments and PIK interest repayments totaling approximately $13.4 million in the year ended December 31, 2011.
During the year ended December 31, 2010, we made seventeen new investments, including recapitalizations in existing portfolio companies, totaling $145.9 million, additional debt investments in nine existing portfolio companies totaling $27.1 million and five additional equity investments in existing portfolio companies totaling
64
Table of Contents
approximately $0.6 million. In addition, we sold three equity investments in portfolio companies for total proceeds of approximately $5.4 million, resulting in realized gains totaling approximately $4.1 million, and converted subordinated debt investments in two portfolio companies to equity, resulting in realized losses totaling approximately $10.4 million. We also sold a convertible note investment in a portfolio company for proceeds of approximately $2.3 million, resulting in a realized gain of approximately $0.9 million. We had nine portfolio company loans repaid at par totaling approximately $43.0 million and received normal principal repayments, partial loan prepayments and PIK interest repayments totaling approximately $7.9 million in the year ended December 31, 2010.
Total portfolio investment activity for the years ended December 31, 2011 and 2010 was as follows:
| Years Ended December 31, | ||||||||
| 2011 | 2010 | |||||||
| Fair value of portfolio, beginning of period |
$ | 325,990,593 | $ | 201,317,970 | ||||
| New investments |
224,996,843 | 173,581,930 | ||||||
| Proceeds from sales of investments |
(17,827,252 | ) | (5,433,709 | ) | ||||
| Loan origination fees received |
(4,364,689 | ) | (3,351,568 | ) | ||||
| Principal repayments received |
(48,517,940 | ) | (49,481,126 | ) | ||||
| Payment in kind interest earned |
10,753,607 | 5,979,858 | ||||||
| Payment in kind interest payments received |
(4,643,113 | ) | (3,710,551 | ) | ||||
| Accretion/writeoff of loan discounts |
1,178,229 | 701,268 | ||||||
| Accretion of deferred loan origination revenue |
1,751,182 | 1,268,839 | ||||||
| Net realized gain (loss) on investments |
10,973,487 | (5,454,327 | ) | |||||
| Net unrealized gain on investments |
6,787,628 | 10,572,009 | ||||||
|
|
|
|
|
|||||
| Fair value of portfolio, end of period |
$ | 507,078,575 | $ | 325,990,593 | ||||
|
|
|
|
|
|||||
| Weighted average yield on debt investments as of end of period(1) |
15.0 | % | 15.1 | % | ||||
|
|
|
|
|
|||||
| Weighted average yield on total investments as of end of period(1) |
13.9 | % | 13.7 | % | ||||
|
|
|
|
|
|||||
| Weighted average yield on total investments at end of period |
13.6 | % | 12.9 | % | ||||
|
|
|
|
|
|||||
| (1) | Excludes non-accrual debt investments. |
Non-Accrual Assets
Generally, when interest and/or principal payments on a loan become past due, or if we otherwise do not expect the borrower to be able to service its debt and other obligations, we will place the loan on non-accrual status and will generally cease recognizing interest income on that loan for financial reporting purposes until all principal and interest have been brought current through payment or due to a restructuring such that the interest income is deemed to be collectible. As of December 31, 2011, the fair value of our non-accrual assets was approximately $7.6 million, which comprised 1.5% of the total fair value of our portfolio, and the cost of our non-accrual assets was approximately $11.0 million, which comprised 2.2% of the total cost of our portfolio. As of December 31, 2010, the fair value of our non-accrual assets was approximately $9.6 million, which comprised 3.0% of the total fair value of our portfolio, and the cost of our non-accrual assets was approximately $17.4 million, which comprised 5.4% of the total cost of our portfolio. Our non-accrual assets as of December 31, 2011 are as follows:
Gerli and Company
In November 2008, we placed our debt investment in Gerli and Company, or Gerli, on non-accrual status. As a result, under generally accepted accounting principles in the United States, or U.S. GAAP, we no longer recognize interest income on our debt investment in Gerli for financial reporting purposes. During 2008 and 2009, we recognized unrealized losses on our debt investment in Gerli of $1.2 million and $0.5 million, respectively. In the year ended December 31, 2010, we recognized an unrealized gain on our debt investment in
65
Table of Contents
Gerli of approximately $0.7 million. During the first quarter of 2011, we restructured our investment in Gerli. As a result of the restructuring, we received a new note from Gerli with a face amount of $3.0 million and a fair value of approximately $2.3 million and preferred stock with a liquidation preference of $0.4 million. Under the terms of the new note, interest on the note is payable only if Gerli meets certain covenants, which they were not compliant with during the year ended December 31, 2011. In the year ended December 31, 2011, we recognized total unrealized depreciation on our new debt investment in Gerli of approximately $1.1 million. As of December 31, 2011, the cost of our new debt investment in Gerli was $3.0 million and the fair value was $1.9 million.
Fire Sprinkler Systems, Inc.
In October 2008, we placed our debt investment in Fire Sprinkler Systems, Inc., or Fire Sprinkler Systems, on non-accrual status. As a result, under U.S. GAAP, we no longer recognize interest income on our debt investment in Fire Sprinkler Systems for financial reporting purposes. During each of the years ended December 31, 2008, 2009 and 2010, we recognized unrealized losses of $1.3 million, $0.3 million and $0.3 million, respectively, on our subordinated note investment in Fire Sprinkler Systems. In the year ended December 31, 2011, we recorded an additional $0.5 million unrealized loss on our debt investment. As of December 31, 2011, the cost of our debt investment in Fire Sprinkler Systems was $2.8 million and the fair value of such investment was $0.4 million.
American De-Rosa Lamparts, LLC and Hallmark Lighting
In 2008, we recognized an unrealized loss of $1.2 million on our subordinated note investment in American De-Rosa Lamparts, LLC and Hallmark Lighting, or collectively, ADL. This unrealized loss reduced the fair value of our investment in ADL to $6.9 million as of December 31, 2008. Through August 31, 2009, we continued to receive interest payments from ADL in accordance with the loan agreement. In September 2009, we received notification from ADLs senior lender that ADL was blocked from making interest payments to us. As a result, we placed our investment in ADL on non-accrual status and, under U.S. GAAP, we no longer recognize interest income on our investment in ADL for financial reporting purposes. In the year ended December 31, 2009, we recognized an additional unrealized loss on our investment in ADL of $3.2 million and in the first quarter of 2010, we recognized an unrealized gain on our investment in ADL of approximately $0.1 million. In June 2010, we converted approximately $3.0 million of our subordinated debt in ADL to equity as part of a restructuring, resulting in realized loss of approximately $3.0 million. In addition, as part of the 2010 restructuring agreement, ADL began making cash interest payments at a rate of 12% on our subordinated note beginning in January 2012. As of December 31, 2011, the cost and fair value of our investment in ADL was approximately $5.2 million.
Results of Operations
Comparison of year ended December 31, 2011 and December 31, 2010
Investment Income
For the year ended December 31, 2011, total investment income was $63.4 million, a 76% increase from $36.0 million of total investment income for the year ended December 31, 2010. This increase was primarily attributable to a $27.4 million increase in total loan interest, fee and dividend income (including PIK interest income). The increase in total loan interest, fee and dividend income was due to 1) a net increase in our portfolio investments from December 31, 2010 to December 31, 2011, and 2) an increase in non-recurring fee income of approximately $0.7 million. Non-recurring fee income was approximately $3.3 million for the year ended December 31, 2011, as compared to approximately $2.6 million for the year ended December 31, 2010. In addition, interest income from cash and cash equivalents increased by 5% from $0.3 million in 2010 to $0.4 million in 2011 due to an increase in average cash balances.
66
Table of Contents
Expenses
For the year ended December 31, 2011, expenses increased by 45% to $23.0 million from $15.8 million for the year ended December 31, 2010. The increase in expenses was attributable to a $2.8 million increase in interest expense, a $0.1 million increase in amortization of deferred financing fees and a $4.3 million increase in general and administrative expenses. The increase in interest expense is related to higher average balances of SBA-guaranteed debentures outstanding during the year ended December 31, 2011 than in the comparable period in 2010 and the addition of our Credit Facility during 2011. The increase in amortization of deferred financing fees is primarily associated with the early repayment of certain SBA-guaranteed debentures in the first quarter of 2011. The increase in general and administrative costs in 2011 was primarily related to increased salary and incentive compensation costs and increased non-cash compensation expenses driven in part by an increase in employee headcount.
Net Investment Income
As a result of the $27.4 million increase in total investment income and the $7.2 million increase in expenses, net investment income for the year ended December 31, 2011 was $40.3 million compared to net investment income of $20.1 million during the year ended December 31, 2010.
Net Increase in Net Assets Resulting From Operations
For the year ended December 31, 2011, we realized a gain on the sale of one control investment of approximately $12.2 million, a loss on the disposal of one control investment of $0.1 million and a loss on the conversion of debt to equity of $3.0 million related to one control investment. In addition, we realized a gain on the repayment of a non-control/non-affiliate investment of approximately $0.5 million, and a gain on the sale of two non-control/non-affiliate investments of $1.4 million. In addition, during the year ended December 31, 2011, we recorded net unrealized appreciation of investments totaling approximately $6.4 million, comprised of 1) unrealized appreciation on 33 investments totaling approximately $25.6 million, 2) unrealized depreciation on 19 investments totaling approximately $9.6 million and 3) $9.6 million of net unrealized depreciation reclassification adjustments related to the realized gains and losses noted above.
For the year ended December 31, 2010, we realized a gain on the sale of one affiliate investment of approximately $3.6 million, gains on the sales of two non-control/non-affiliate investments totaling approximately $0.5 million, a realized loss on the partial conversion of one non-control/non-affiliate debt investment to equity of approximately $3.0 million, a realized loss on the conversion of one affiliate debt investment to equity of approximately $7.4 million, and a realized gain of $0.9 million on the repayment of a convertible note from another non-control/non-affiliate investment. In addition, during the year ended December 31, 2010, we recorded net unrealized appreciation of investments totaling approximately $10.9 million, comprised of 1) unrealized appreciation on 19 investments totaling approximately $18.6 million, 2) unrealized depreciation on 18 investments totaling approximately $13.9 million and 3) $6.2 million in net unrealized appreciation reclassification adjustments related to the realized gains and realized loss noted above.
As a result of these events, our net increase in net assets from operations during the year ended December 31, 2011 was $56.8 million as compared to $25.4 million for the year ended December 31, 2010.
Comparison of year ended December 31, 2010 and December 31, 2009
Investment Income
For the year ended December 31, 2010, total investment income was $36.0 million, a 30% increase from $27.8 million of total investment income for the year ended December 31, 2009. This increase was primarily attributable to a $7.6 million increase in total loan interest, fee and dividend income and a $0.9 million increase in total PIK interest income due to a net increase in our portfolio investments from December 31, 2009 to December 31, 2010, partially offset by a $0.3 million decrease in interest income from cash and cash equivalent
67
Table of Contents
investments due to a decrease in average cash balances in 2010 over 2009 due to the increased deployment of cash for purchases of portfolio investments. Non-recurring fee income was $2.6 million for the year ended December 31, 2010 as compared to $0.8 million for the year ended December 31, 2009.
Expenses
For the year ended December 31, 2010, expenses increased by 15% to $15.8 million from $13.7 million for the year ended December 31, 2009. The increase in expenses was primarily attributable to a $1.2 million increase in general and administrative expenses as a result of higher salary expenses during 2010 due to an increase in employees and non-cash compensation expenses. The increase in expenses was also attributable to a $0.4 million increase in amortization of deferred financing fees associated with the early repayment of certain SBA-guaranteed debentures in the third quarter of 2010 and a $0.4 million increase in interest expense as a result of higher average balances of SBA-guaranteed debentures outstanding during the year ended December 31, 2010 than in the same period in 2009.
Net Investment Income
As a result of the $8.2 million increase in total investment income and the $2.1 million increase in expenses, net investment income for the year ended December 31, 2010 was $20.1 million compared to net investment income of $14.0 million during the year ended December 31, 2009.
Net Increase in Net Assets Resulting From Operations
For the year ended December 31, 2010, we realized a gain on the sale of one affiliate investment of approximately $3.6 million, gains on the sales of two non-control/non-affiliate investments totaling approximately $0.5 million, a realized loss on the partial conversion of one non-control/non-affiliate debt investment to equity of approximately $3.0 million, a realized loss on the conversion of one affiliate debt investment to equity of approximately $7.4 million, and a realized gain of $0.9 million on the repayment of a convertible note from another non-control/non-affiliate investment. In addition, during the year ended December 31, 2010, we recorded net unrealized appreciation of investments totaling approximately $10.9 million, comprised of 1) unrealized appreciation on 19 investments totaling approximately $18.6 million, 2) unrealized depreciation on 18 investments totaling approximately $13.9 million and 3) $6.2 million in net unrealized appreciation reclassification adjustments related to the realized gains and realized loss noted above.
For the year ended December 31, 2009, total net realized gains on non-control/non-affiliate investments was approximately $0.4 million, which consisted of realized gains on the sales of two investments totaling approximately $1.8 million, partially offset by realized losses on the restructuring of two other investments totaling approximately $1.3 million. In addition, in the year ended December 31, 2009, we recorded net unrealized depreciation of investments, net of income taxes, in the amount of $10.3 million, comprised primarily of 1) unrealized depreciation on 15 investments totaling approximately $17.4 million, 2) unrealized appreciation, net of tax, on 13 other investments totaling approximately $7.3 million and 3) net unrealized depreciation reclassification adjustments of approximately $0.2 million related to the realized losses on non-control/non-affiliate investments.
As a result of these events, our net increase in net assets from operations during the year ended December 31, 2010 was $25.4 million as compared to $4.0 million for the year ended December 31, 2009.
Liquidity and Capital Resources
We believe that our current cash and cash equivalents on hand, our available leverage under our line of credit and our anticipated cash flows from operations will be adequate to meet our cash needs for our daily operations for at least the next twelve months.
68
Table of Contents
In the future, depending on the valuation of Triangle SBICs assets and Triangle SBIC IIs assets pursuant to SBA guidelines, Triangle SBIC and Triangle SBIC II may be limited by provisions of the Small Business Investment Act of 1958, and SBA regulations governing SBICs, from making certain distributions to Triangle Capital Corporation that may be necessary to enable Triangle Capital Corporation to make the minimum required distributions to its stockholders and qualify as a RIC.
Cash Flows
For the year ended December 31, 2011, we experienced a net increase in cash and cash equivalents in the amount of $12.0 million. During that period, our operating activities used $118.2 million in cash, consisting primarily of new portfolio investments of $225.0 million, partially offset by repayments received from portfolio companies and proceeds from the sale of investments totaling $66.3 million. In addition, financing activities provided $130.3 million of cash, consisting primarily of proceeds from public common stock offerings of $128.6 million, borrowings under SBA-guaranteed debentures payable of $31.1 million and borrowings under our Credit Facility of $30.4 million, offset by cash dividends paid in the amount of $32.4 million, repayments of SBA-guaranteed debentures of $9.5 million, repayments of our Credit Facility of $15.4 million and financing fees paid in the amount of $1.4 million. At December 31, 2011, we had $66.9 million of cash and cash equivalents on hand.
For the year ended December 31, 2010, we experienced a net decrease in cash and cash equivalents in the amount of $0.4 million. During that period, our operating activities used $97.5 million in cash, consisting primarily of new portfolio investments of $173.6 million, partially offset by repayments of loans received and proceeds from sales of investments of $54.9 million. In addition, financing activities provided $97.1 million of cash, consisting primarily of proceeds from a public common stock offering of $41.2 million, borrowings under SBA-guaranteed debentures payable of $102.8 million, offset by cash dividends paid in the amount of $20.9 million, repayments of SBA-guaranteed debentures of $22.3 million and financing fees paid in the amount of $3.5 million. At December 31, 2010, we had $54.8 million of cash and cash equivalents on hand.
For the year ended December 31, 2009, we experienced a net increase in cash and cash equivalents in the amount of $28.0 million. During that period, our operating activities used $13.4 million in cash, consisting primarily of new portfolio investments of $48.5 million, partially offset by repayments of loans received and proceeds from sales of investments of $21.4 million. We generated $41.4 million of cash from financing activities, consisting of proceeds from public common stock offerings of $47.3 million and proceeds from borrowings under SBA-guaranteed debentures payable of $6.8 million, offset by financing fees paid of $0.4 million and cash dividends paid of $12.3 million. At December 31, 2009, we had $55.2 million of cash and cash equivalents on hand.
Financing Transactions
Due to Triangle SBICs and Triangle SBIC IIs status as licensed SBICs, Triangle SBIC and Triangle SBIC II have the ability to issue debentures guaranteed by the SBA at favorable interest rates. Under the Small Business Investment Act and the SBA rules applicable to SBICs, an SBIC (or group of SBICs under common control) can have outstanding at any time debentures guaranteed by the SBA up to two times (and in certain cases, up to three times) the amount of its regulatory capital, which generally is the amount raised from private investors. The maximum statutory limit on the dollar amount of outstanding debentures guaranteed by the SBA issued by a single SBIC is currently $150.0 million and by a group of SBICs under common control is $225.0 million. Debentures guaranteed by the SBA have a maturity of ten years, with interest payable semi-annually. The principal amount of the debentures is not required to be paid before maturity but may be pre-paid at any time, without penalty.
As of December 31, 2011, Triangle SBIC has issued the maximum $150.0 million of SBA-guaranteed debentures and Triangle SBIC II has issued the maximum $75.0 million in face amount of SBA-guaranteed
69
Table of Contents
debentures. In addition to the onetime fee of 1.0% on the total commitment from the SBA, we also pay a onetime fee of 2.425% on the amount of each debenture issued (2.0% for SBA LMI debentures). These fees are capitalized as deferred financing costs and are amortized over the term of the debt agreements using the effective interest method. The weighted average interest rates for all SBA-guaranteed debentures as of December 31, 2011 was 4.83%.
In May 2011, we entered into a three-year senior secured credit facility (the Credit Facility) with an initial commitment of $50.0 million. In November 2011, we closed an expansion of the Credit Facility from $50.0 million to $75.0 million, which included the addition of one new lender. The purpose of the Credit Facility is to provide additional liquidity in support of future investment and operational activities. The Credit Facility was arranged by BB&T Capital Markets and Fifth Third Bank and has an accordion feature which allows for an increase in the total loan size up to $90.0 million and also contains two one-year extension options, bringing the total potential commitment and funding period to five years from the closing date. The Credit Facility, which is structured to operate like a revolving credit facility, is secured primarily by Triangle Capital Corporations assets, excluding the assets of Triangle SBIC and Triangle SBIC II.
Borrowings under the Credit Facility bear interest, subject to our election, on a per annum basis equal to (i) the applicable base rate plus 1.95% or ii) the applicable LIBOR rate plus 2.95%. The applicable base rate is equal to the greater of i) prime rate, ii) the federal funds rate plus 0.5% or iii) the adjusted one-month LIBOR plus 2.0%. We pay unused commitment fees of 0.375% per annum, which are included with Interest and other credit facility fees on our Consolidated Statement of Operations. As of December 31, 2011, the Company had $15.0 million in borrowings outstanding under the Credit Facility with an interest rate of 5.2%.
Distributions to Stockholders
We have elected to be treated as a RIC under Subchapter M of the Internal Revenue Code of 1986, as amended, or the Code, and intend to make the required distributions to our stockholders as specified therein. In order to qualify as a RIC and to obtain RIC tax benefits, we must meet certain minimum distribution, source-of-income and asset diversification requirements. If such requirements are met, then we are generally required to pay income taxes only on the portion of our taxable income and gains we do not distribute (actually or constructively) and certain built-in gains. We met our minimum distribution requirements for 2011, 2010 and 2009 and continually monitor our distribution requirements with the goal of ensuring compliance with the Code.
The minimum distribution requirements applicable to RICs require us to distribute to our stockholders each year at least 90% of our investment company taxable income, or ICTI, as defined by the Code. Depending on the level of ICTI earned in a tax year, we may choose to carry forward ICTI in excess of current year distributions into the next tax year and pay a 4% excise tax on such excess. Any such carryover ICTI must be distributed before the end of the next tax year through a dividend declared prior to filing the final tax return related to the year which generated such ICTI.
ICTI generally differs from net investment income for financial reporting purposes due to temporary and permanent differences in the recognition of income and expenses. We may be required to recognize ICTI in certain circumstances in which we do not receive cash. For example, if we hold debt obligations that are treated under applicable tax rules as having original issue discount (such as debt instruments issued with warrants), we must include in ICTI each year a portion of the original issue discount that accrues over the life of the obligation, regardless of whether cash representing such income is received by us in the same taxable year. We may also have to include in ICTI other amounts that we have not yet received in cash, such as i) PIK interest income and ii) interest income from investments that have been classified as non-accrual for financial reporting purposes. Interest income on non-accrual investments is not recognized for financial reporting purposes, but generally is recognized in ICTI. Because any original issue discount or other amounts accrued will be included in our ICTI for the year of accrual, we may be required to make a distribution to our stockholders in order to satisfy the minimum distribution requirements, even though we will not have received and may not ever receive any corresponding cash amount. ICTI also excludes net unrealized appreciation or depreciation, as investment gains or losses are not included in taxable income until they are realized.
70
Table of Contents
Current Market Conditions
Beginning in 2008, the debt and equity capital markets in the United States were severely impacted by significant write-offs in the financial services sector relating to subprime mortgages and the re-pricing of credit risk in the broadly syndicated bank loan market, among other factors. These events, along with the deterioration of the housing market, led to an economic recession in the U.S. and abroad. Banks, investment companies and others in the financial services industry reported significant write-downs in the fair value of their assets, which led to the failure of a number of banks and investment companies, a number of distressed mergers and acquisitions, the government take-over of the nations two largest government-sponsored mortgage companies, the passage of the $700 billion Emergency Economic Stabilization Act of 2008 in October 2008 and the passage of the American Recovery and Reinvestment Act of 2009, or the Stimulus Bill, in February 2009. These events significantly impacted the financial and credit markets and reduced the availability of debt and equity capital for the market as a whole, and for financial firms in particular. Notwithstanding recent gains across both the equity and debt markets, these conditions may reoccur in the future and could then continue for a prolonged period of time. Although we have been able to secure access to additional liquidity, including our recent public offerings of common stock and debt securities, increased leverage available through the SBIC program as a result of the Stimulus Bill and our $75.0 million Credit Facility, there is no assurance that debt or equity capital will be available to us in the future on favorable terms, or at all.
Critical Accounting Policies and Use of Estimates
The preparation of our financial statements in accordance with accounting principles generally accepted in the United States requires management to make certain estimates and assumptions that affect the reported amounts of assets and liabilities at the date of the financial statements and the reported amounts of revenues and expenses for the periods covered by such financial statements. We have identified investment valuation and revenue recognition as our most critical accounting estimates. On an on-going basis, we evaluate our estimates, including those related to the matters described below. These estimates are based on the information that is currently available to us and on various other assumptions that we believe to be reasonable under the circumstances. Actual results could differ materially from those estimates under different assumptions or conditions. A discussion of our critical accounting policies follows.
Investment Valuation
The most significant estimate inherent in the preparation of our financial statements is the valuation of investments and the related amounts of unrealized appreciation and depreciation of investments recorded. We have established and documented processes and methodologies for determining the fair values of portfolio company investments on a recurring (quarterly) basis in accordance with FASB ASC Topic 820, Fair Value Measurements and Disclosures, or ASC Topic 820. ASC Topic 820 defines fair value, establishes a framework for measuring fair value in accordance with generally accepted accounting principles and expands disclosures about fair value measurements. As discussed below, we have engaged an independent valuation firm to assist us in our valuation process.
ASC Topic 820 clarifies that the exchange price is the price in an orderly transaction between market participants to sell an asset or transfer a liability in the market in which the reporting entity would transact for the asset or liability, that is, the principal or most advantageous market for the asset or liability. The transaction to sell the asset or transfer the liability is a hypothetical transaction at the measurement date, considered from the perspective of a market participant that holds the asset or owes the liability. ASC Topic 820 provides a consistent definition of fair value which focuses on exit price and prioritizes, within a measurement of fair value, the use of market-based inputs over entity-specific inputs. In addition, ASC Topic 820 provides a framework for measuring fair value and establishes a three-level hierarchy for fair value measurements based upon the transparency of inputs to the valuation of an asset or liability as of the measurement date. The three levels of valuation hierarchy established by ASC Topic 820 are defined as follows:
Level 1 inputs to the valuation methodology are quoted prices (unadjusted) for identical assets or liabilities in active markets.
71
Table of Contents
Level 2 inputs to the valuation methodology include quoted prices for similar assets and liabilities in active markets, and inputs that are observable for the asset or liability, either directly or indirectly, for substantially the full term of the financial instrument.
Level 3 inputs to the valuation methodology are unobservable and significant to the fair value measurement.
A financial instruments categorization within the valuation hierarchy is based upon the lowest level of input that is significant to the fair value measurement. Our investment portfolio is comprised of debt and equity instruments of privately held companies for which quoted prices falling within the categories of Level 1 and Level 2 inputs are not available. Therefore, we value all of our investments at fair value, as determined in good faith by our Board of Directors, using Level 3 inputs, as further described below. Due to the inherent uncertainty in the valuation process, our Board of Directors estimate of fair value may differ significantly from the values that would have been used had a ready market for the securities existed, and the differences could be material. In addition, changes in the market environment and other events that may occur over the life of the investments may cause the gains or losses ultimately realized on these investments to be different than the valuations currently assigned.
Debt and equity securities that are not publicly traded and for which a limited market does not exist are valued at fair value as determined in good faith by our Board of Directors. There is no single standard for determining fair value in good faith, as fair value depends upon circumstances of each individual case. In general, fair value is the amount that we might reasonably expect to receive upon the current sale of the security.
We evaluate the investments in portfolio companies using the most recently available portfolio company financial statements and forecasts. We also consult with the portfolio companys senior management to obtain further updates on the portfolio companys performance, including information such as industry trends, new product development and other operational issues. Additionally, we consider some or all of the following factors:
| | financial standing of the issuer of the security; |
| | comparison of the business and financial plan of the issuer with actual results; |
| | the size of the security held; |
| | pending public offering of common stock by the issuer of the security; |
| | pending reorganization activity affecting the issuer, such as merger or debt restructuring; |
| | ability of the issuer to obtain needed financing; |
| | changes in the economy affecting the issuer; |
| | financial statements and reports from portfolio company senior management and ownership; |
| | the type of security, the securitys cost at the date of purchase and any contractual restrictions on the disposition of the security; |
| | special reports prepared by analysts; |
| | information as to any transactions or offers with respect to the security and/or sales to third parties of similar securities; |
| | the issuers ability to make payments and the type of collateral; |
| | the current and forecasted earnings of the issuer; |
| | statistical ratios compared to lending standards and to other similar securities; and |
| | other pertinent factors. |
In making the good faith determination of the value of debt securities, we start with the cost basis of the security, which includes the amortized original issue discount, and PIK interest, if any. We also use a risk rating
72
Table of Contents
system to estimate the probability of default on the debt securities and the probability of loss if there is a default. The risk rating system covers both qualitative and quantitative aspects of the business and the securities held. In valuing debt securities, management utilizes an income approach model that considers factors including, but not limited to, (i) the portfolio investments current risk rating, (ii) the portfolio companys current trailing twelve months, or TTM, results of operations as compared to the portfolio companys TTM results of operations as of the date the investment was made and the portfolio companys anticipated results for the next twelve months of operations, (iii) the portfolio companys current leverage as compared to its leverage as of the date the investment was made, (iv) publicly available information regarding current pricing and credit metrics for similar proposed and executed investment transactions of private companies and (v) when management believes a relevant comparison exists, current pricing and credit metrics for similar proposed and executed investment transactions of publicly traded debt.
In valuing equity securities of private companies, we consider valuation methodologies consistent with industry practice, including but not limited to (i) valuation using a valuation model based on original transaction multiples and the portfolio companys recent financial performance, (ii) publicly available information regarding the valuation of the securities based on recent sales in comparable transactions of private companies and (iii) when management believes there are comparable companies that are publicly traded, a review of these publicly traded companies and the market multiple of their equity securities.
Duff & Phelps, LLC, or Duff & Phelps, an independent valuation firm, provides third party valuation consulting services to us, which consist of certain limited procedures that we identified and requested Duff & Phelps to perform (hereinafter referred to as the procedures). We generally request Duff & Phelps to perform the procedures on each portfolio company at least once in every calendar year and for new portfolio companies, at least once in the twelve-month period subsequent to the initial investment. In addition, we generally request Duff & Phelps to perform the procedures on a portfolio company when there has been a significant change in the fair value of the investment. In certain instances, we may determine that it is not cost-effective, and as a result is not in our stockholders best interest, to request Duff & Phelps to perform the procedures on one or more portfolio companies. Such instances include, but are not limited to, situations where the fair value of our investment in the portfolio company is determined to be insignificant relative to our total investment portfolio.
The total number of investments and the percentage of our portfolio that we asked Duff & Phelps to perform such procedures on are summarized below by period:
| For the quarter ended: |
Total companies |
Percent of total investments at fair value(1) |
||||||
| March 31, 2009 |
7 | 26 | % | |||||
| June 30, 2009 |
6 | 20 | % | |||||
| September 30, 2009 |
7 | 24 | % | |||||
| December 31, 2009 |
8 | 40 | % | |||||
| March 31, 2010 |
7 | 25 | % | |||||
| June 30, 2010 |
8 | 29 | % | |||||
| September 30, 2010 |
8 | 26 | % | |||||
| December 31, 2010 |
9 | 29 | % | |||||
| March 31, 2011 |
11 | 34 | % | |||||
| June 30, 2011 |
13 | 26 | % | |||||
| September 30, 2011 |
11 | 31 | % | |||||
| December 31, 2011 |
12 | 22 | % | |||||
| (1) | Exclusive of the fair value of new investments made during the quarter |
Upon completion of the procedures, Duff & Phelps concluded that the fair value, as determined by the Board of Directors, of those investments subjected to the procedures appeared reasonable. Our Board of Directors is ultimately and solely responsible for determining the fair value of our investments in good faith.
73
Table of Contents
Revenue Recognition
Interest and Dividend Income
Interest income, adjusted for amortization of premium and accretion of original issue discount, is recorded on the accrual basis to the extent that such amounts are expected to be collected. Generally, when interest and/or principal payments on a loan become past due, or if we otherwise do not expect the borrower to be able to service its debt and other obligations, we will place the loan on non-accrual status and will generally cease recognizing interest income on that loan for financial reporting purposes until all principal and interest have been brought current through payment or due to a restructuring such that the interest income is deemed to be collectible. The cessation of recognition of such interest will negatively impact the reported fair value of the investment. We write off any previously accrued and uncollected interest when it is determined that interest is no longer considered collectible. Dividend income is recorded on the ex-dividend date.
We may have to include in our ICTI, interest income, including OID income, from investments that have been classified as non-accrual for financial reporting purposes. Interest income on non-accrual investments is not recognized for financial reporting purposes, but generally is recognized in ICTI. As a result, we may be required to make a distribution to our stockholders in order to satisfy the minimum distribution requirements to maintain our RIC status, even though we will not have received and may not ever receive any corresponding cash amount. Additionally, any loss recognized by us for federal income tax purposes on previously accrued interest income will be treated as a capital loss.
Fee Income
Loan origination, facility, commitment, consent and other advance fees received in connection with the origination of a loan are recorded as deferred income and recognized as investment income over the term of the loan. Upon prepayment of a loan, any unamortized loan origination fees are recorded as interest income. In the general course of our business, we receive certain fees from portfolio companies, which are non-recurring in nature. Such fees include loan prepayment penalties, certain investment banking and structuring fees and loan waiver and amendment fees, and are recorded as investment income when received.
Payment-in-Kind Interest (PIK)
We currently hold, and we expect to hold in the future, some loans in our portfolio that contain a PIK interest provision. The PIK interest, computed at the contractual rate specified in each loan agreement, is periodically added to the principal balance of the loan, rather than being paid to us in cash, and is recorded as interest income. Thus, the actual collection of PIK interest may be deferred until the time of debt principal repayment.
To maintain our status as a RIC, PIK interest, which is a non-cash source of income, is included in our taxable income and therefore affects the amount we are required to pay to stockholders in the form of dividends, even though we have not yet collected the cash. Generally, when current cash interest and/or principal payments on a loan become past due, or if we otherwise do not expect the borrower to be able to service its debt and other obligations, we will place the loan on non-accrual status and will generally cease recognizing PIK interest income on that loan for financial reporting purposes until all principal and interest have been brought current through payment or due to a restructuring such that the interest income is deemed to be collectible. We write off any previously accrued and uncollected PIK interest when it is determined that the PIK interest is no longer collectible.
We may have to include in our ICTI, PIK interest income from investments that have been classified as non-accrual for financial reporting purposes. Interest income on non-accrual investments is not recognized for financial reporting purposes, but generally is recognized in ICTI. As a result, we may be required to make a distribution to our stockholders in order to satisfy the minimum distribution requirements, even though we will not have received and may not ever receive any corresponding cash amount.
74
Table of Contents
Recently Issued Accounting Standards
In April 2011, the FASB issued ASU No. 2011-02A Creditors Determination of Whether a Restructuring is a Troubled Debt Restructuring, or ASU 2011-02. This standard amends previous guidance provided in Accounting Standards Codification 310-40ReceivablesTroubled Debt Restructuring by Creditors to clarify which loan modifications constitute troubled debt restructurings. It is intended to assist creditors in determining whether a modification of the terms of a receivable meets the criteria to be considered a troubled debt restructuring, both for purposes of recording an impairment loss and for disclosure of troubled debt restructurings. In evaluating whether a restructuring constitutes a troubled debt restructuring, a creditor must separately conclude that both of the following exist: (a) the restructuring constitutes a concession; and (b) the debtor is experiencing financial difficulties. ASU 2011-02 provides guidance to clarify whether the creditor has granted a concession and whether a debtor is experiencing financial difficulties. The new guidance is effective for interim and annual periods that began on or after June 15, 2011, and applies retrospectively to restructurings occurring on or after the beginning of the fiscal year of adoption. The adoption of ASU 2011-02 did not have a significant impact on our financial position or results of operations.
In May 2011, the FASB issued ASU No. 2011-04, Fair Value Measurements (Topic 820), Amendments to Achieve Common Fair Value Measurement and Disclosure Requirements in U.S. GAAP and IFRSs, or ASU 2011-04. ASU 2011-04 clarifies the application of existing fair value measurement and disclosure requirements, changes the application of some requirements for measuring fair value and requires additional disclosure for fair value measurements categorized in Level 3 of the fair value hierarchy. ASU 2011-04 is effective for interim and annual periods beginning after December 15, 2011. We will adopt this standard effective January 1, 2012. We are evaluating the impact, if any, that our adoption of this update may have on our financial position or results of operations. However, since this accounting standards update primarily requires expanded disclosure related to Level 3 financial assets and liabilities, we do not anticipate that the implementation of this standard will have a significant impact on our process for measuring fair values, our financial position or results of operations.
Off-Balance Sheet Arrangements
We currently have no off-balance sheet arrangements.
Quantitative and Qualitative Disclosures About Market Risk
During 2011, the United States economy continued to show modest improvement; however, during the third quarter of 2011, the financial markets experienced increased volatility and economic indicators suggested a further slowdown of the United States and European economies potentially leading to another recession. A prolonged slowdown in economic activity would likely have an adverse effect on a number of the industries in which some of our portfolio companies operate, and on certain of our portfolio companies as well. In addition, the recent sovereign debt crises may continue to impact the broader financial and credit markets and may continue to reduce the availability of debt and equity capital for the market as a whole and financial firms in particular.
During 2009, we experienced write-downs in our portfolio, several of which were due to declines in the operating performance of certain portfolio companies. During 2010, we experienced a $10.9 million increase in the fair value of our investment portfolio related to unrealized appreciation of investments and in 2011, we experienced a $16.0 million increase in the fair value of our investment portfolio related to unrealized appreciation of investments, exclusive of $9.6 million of unrealized depreciation reclassification adjustments related to certain realized gains and losses discussed above in Item 7. Managements Discussion and Analysis of Financial Condition and Results of Operations under Results of Operations.
As of December 31, 2011, the fair value of our non-accrual assets was approximately $7.6 million, which comprised approximately 1.5% of the total fair value of our portfolio, and the cost of our non-accrual assets was approximately $11.0 million, or 2.2% of the total cost of our portfolio. In addition to these non-accrual assets, as
75
Table of Contents
of December 31, 2011, we had, on a fair value basis, approximately $29.5 million of debt investments, or 5.8% of the total fair value of our portfolio, which were current with respect to scheduled principal and interest payments, but which were carried at less than cost. The cost of these assets as of December 31, 2011 was approximately $35.3 million, or 7.1% of the total cost of our portfolio.
The volatile and stressed conditions of the equity and debt markets may continue for a prolonged period of time or worsen in the future. To the extent that recessionary conditions recur, the economy remains stagnate, any further downgrades to U.S. governments sovereign credit rating occur, the European credit crisis continues, or the economy fails to return to pre-recession levels, the financial position and results of operations of certain of the middle-market companies in our portfolio could be further affected adversely, which ultimately could lead to difficulty in our portfolio companies meeting debt service requirements and lead to an increase in defaults. There can be no assurance that the performance of our portfolio companies will not be further impacted by economic conditions, which could have a negative impact on our future results.
In addition, we are subject to interest rate risk. Interest rate risk is defined as the sensitivity of our current and future earnings to interest rate volatility, variability of spread relationships, the difference in re-pricing intervals between our assets and liabilities and the effect that interest rates may have on our cash flows. Changes in the general level of interest rates can affect our net interest income, which is the difference between the interest income earned on interest earning assets and our interest expense incurred in connection with our interest bearing debt and liabilities. Changes in interest rates can also affect, among other things, our ability to acquire and originate loans and securities and the value of our investment portfolio. Our investment income is affected by fluctuations in various interest rates, including LIBOR and prime rates. We regularly measure exposure to interest rate risk and determine whether or not any hedging transactions are necessary to mitigate exposure to changes in interest rates. As of December 31, 2011, we were not a party to any hedging arrangements.
As of December 31, 2011, approximately 96.1%, or $436.5 million (at cost) of our debt portfolio investments bore interest at fixed rates and approximately 3.9%, or $18.0 million (at cost) of our debt portfolio investments bore interest at variable rates, which are either Prime-based or LIBOR-based. A 200 basis point increase or decrease in the interest rates on our variable-rate debt investments would increase or decrease, as applicable, our investment income by approximately $0.4 million on an annual basis. All of our pooled SBA-guaranteed debentures bear interest at fixed rates. Our Credit Facility bears interest, subject to our election, on a per annum basis equal to (i) the applicable base rate plus 1.95% or ii) the applicable LIBOR rate plus 2.95%. The applicable base rate is equal to the greater of i) prime rate, ii) the federal funds rate plus 0.5% or iii) the adjusted one-month LIBOR plus 2.0%.
Because we currently borrow, and plan to borrow in the future, money to make investments, our net investment income is dependent upon the difference between the rate at which we borrow funds and the rate at which we invest the funds borrowed. Accordingly, there can be no assurance that a significant change in market interest rates will not have a material adverse effect on our net investment income. In periods of rising interest rates, our cost of funds would increase, which could reduce our net investment income if there is not a corresponding increase in interest income generated by our investment portfolio.
Related Party Transactions
During the three years ending December 31, 2011 there were no related party transactions between Triangle Capital Corporation and any of its subsidiaries.
76
Table of Contents
Contractual Obligations
As of December 31, 2011, our future fixed commitments for cash payments are as follows:
| Total | 2012 |
2013 to 2014 |
2015 to 2016 |
2017 and Thereafter |
||||||||||||||||
| SBA-guaranteed debentures payable |
$ | 224,237,504 | $ | | $ | | $ | 7,037,504 | $ | 217,200,000 | ||||||||||
| Interest due on SBA-guaranteed debentures payable |
87,908,121 | 10,651,811 | 21,316,221 | 21,345,422 | 34,594,667 | |||||||||||||||
| Credit facility |
15,000,000 | | 15,000,000 | | | |||||||||||||||
| Interest due on credit facility |
5,417 | 5,417 | | | | |||||||||||||||
| Unused commitments to extend credit(1) |
17,133,333 | 17,133,333 | | | | |||||||||||||||
| Operating lease payments(2) |
595,899 | 294,531 | 301,368 | | | |||||||||||||||
|
|
|
|
|
|
|
|
|
|
|
|||||||||||
| Total |
$ | 344,880,274 | $ | 28,085,092 | $ | 36,617,589 | $ | 28,382,926 | $ | 251,794,667 | ||||||||||
|
|
|
|
|
|
|
|
|
|
|
|||||||||||
| (1) | We have commitments to extend credit, in the form of loans and additional equity contributions, to several of our portfolio companies which are undrawn as of December 31, 2011. Since these commitments may expire without being drawn upon, the total commitment amount does not necessarily represent future cash requirements, however we have chosen to present the amount of these unused commitments as obligations in this table. |
| (2) | We lease our corporate office facility under an operating lease that terminates on December 31, 2013. We believe that our existing facilities will be adequate to meet our needs at least through 2012, and that we will be able to obtain additional space when, where and as needed on acceptable terms. |
Recent Developments
In February 2012, our Board of Directors granted 227,631 restricted shares of our common stock to certain employees. These restricted shares had a total grant date fair value of approximately $4.3 million, which will be expensed on a straight-line basis over each respective awards vesting period.
In February 2012, we filed a prospectus supplement pursuant to which 3,700,000 shares of common stock were offered for sale at a price to the public of $19.00 per share. In addition, the underwriters involved were granted an overallotment option to purchase an additional 555,000 shares of our common stock at the same public offering price. Pursuant to this offering, all shares (including the overallotment option shares) were sold and delivered on February 13, 2012 resulting in net proceeds to us, after underwriting discounts and offering expenses, of approximately $77.1 million.
In February 2012, we invested $6.3 million in subordinated debt with warrants of Stella Environmental Services, LLC (Stella). Stella manages waste transfer station operations. Under the terms of the investment, Stella will pay interest on the subordinated debt at a rate of 15.5% per annum.
In February 2012, we filed a prospectus supplement pursuant to which $60.0 million in aggregate principal amount of 7.00% senior unsecured notes due 2019 were offered for sale to the public. The notes will mature on March 15, 2019, and may be redeemed in whole or in part at any time or from time to time at the Companys option on or after March 15, 2015. The notes will bear interest at a rate of 7.00% per year payable quarterly on March 15, June 15, September 15 and December 15 of each year, beginning June 15, 2012. We also granted the underwriters a 30-day option to purchase up to an additional $9.0 million in aggregate principal amount of notes to cover overallotments, if any. Pursuant to this offering, the securities were sold and delivered on March 2, 2012 resulting in net proceeds to us, after underwriting discounts and offering expenses, of approximately $57.9 million.
77
Table of Contents
In March 2012, we invested $12.0 million in first lien debt and equity of United Allergy Labs (UAL). UAL tests for and treats allergies using immunotherapy. Under the terms of the investment, UAL will pay interest on the debt at a rate of 14.0% per annum.
In March 2012, we prepaid $10.4 million in SBA guaranteed debentures that had a weighted average interest rate of 6.2%.
Item 7A. Quantitative and Qualitative Disclosures About Market Risk.
See the section entitled Quantitative and Qualitative Disclosures About Market Risk included in Managements Discussion and Analysis of Financial Condition and Results of Operations, which is included in Item 7 of Part II of this Annual Report and is incorporated by reference herein.
Item 8. Financial Statements and Supplementary Data.
See our Financial Statements included herein and listed in Item 15(a) of this Annual Report.
Item 9. Changes in and Disagreements with Accountants on Accounting and Financial Disclosure.
Not applicable.
Item 9A. Controls and Procedures.
Evaluation of Disclosure Controls and Procedures
We maintain disclosure controls and procedures that are designed to ensure that information required to be disclosed in the reports that we file or submit under the Securities Exchange Act is recorded, processed, summarized and reported within the time periods specified in the SECs rules and forms and that such information is accumulated and communicated to our management, including our Chief Executive Officer and Chief Financial Officer, as appropriate, to allow timely decisions regarding required disclosure. Our Chief Executive Officer and Chief Financial Officer carried out an evaluation of the effectiveness of the design and operation of our disclosure controls and procedures as of the end of the period covered by this report. Based on the evaluation of these disclosure controls and procedures, the Chief Executive Officer and Chief Financial Officer concluded that our disclosure controls and procedures were effective. It should be noted that any system of controls, however well designed and operated, can provide only reasonable, and not absolute, assurance that the objectives of the system are met. In addition, the design of any control system is based in part upon certain assumptions about the likelihood of future events. Because of these and other inherent limitations of control systems, there can be no assurance that any design will succeed in achieving its stated goals under all potential future conditions, regardless of how remote.
Managements Report on Internal Control over Financial Reporting
Our management, including our Chief Executive Officer and Chief Financial Officer, is responsible for establishing and maintaining adequate internal control over financial reporting, as such term is defined in Rules 13a-15(f) and 15d-15(f) under the Exchange Act. Our internal control over financial reporting is a process designed to provide reasonable assurance regarding the reliability of financial reporting and the preparation of our financial statements for external reporting purposes in accordance with U.S. generally accepted accounting principles, or U.S. GAAP. Internal control over financial reporting includes those policies and procedures that: (i) pertain to the maintenance of records that in reasonable detail accurately and fairly reflect the transactions and dispositions of the assets of the company; (ii) provide reasonable assurance that transactions are recorded as necessary to permit preparation of financial statements in accordance with U.S. GAAP, and that receipts and expenditures of the company are being made only in accordance with authorizations of management and directors of the company; and
78
Table of Contents
(iii) provide reasonable assurance regarding prevention or timely detection of unauthorized acquisition, use, or disposition of the companys assets that could have a material effect on the financial statements. Because of its inherent limitations, internal control over financial reporting may not prevent or detect misstatements. Also, projections of any evaluation of effectiveness to future periods are subject to the risk that controls may become inadequate because of changes in conditions, or that the degree of compliance with policies or procedures may deteriorate.
Management (with the participation of our Chief Executive Officer and Chief Financial Officer) conducted an evaluation of the effectiveness of our internal control over financial reporting based on the framework in Internal Control Integrated Framework issued by the Committee of Sponsoring Organizations of the Treadway Commission. Based on this evaluation, management concluded that our internal control over financial reporting was effective as of December 31, 2011.
Our internal control over financial reporting as of December 31, 2011 has been audited by Ernst & Young LLP, an independent registered public accounting firm, as stated in their report, which is included in Item 15 of Part III of this Annual Report on Form 10-K.
Changes in Internal Control Over Financial Reporting
There were no changes in our internal control over financial reporting during the fourth quarter of 2011 that have materially affected, or are reasonably likely to materially affect, our internal control over financial reporting.
Not applicable.
PART III
Item 10. Directors, Executive Officers and Corporate Governance.
We have adopted a code of ethics (which we call our Code of Business Conduct and Ethics), which every director, officer and employee is expected to observe. The Code of Business Conduct and Ethics is publicly available on our website under Corporate Governance at the following URL: http://ir.tcap.com/governance.cfm and is referenced in this Annual Report as Exhibit 14.1.
We will provide any person, without charge, upon request, a copy of our Code of Business Conduct and Ethics. To receive a copy, please provide a written request to: Triangle Capital Corporation; Attn: Chief Compliance Officer, 3700 Glenwood Avenue, Suite 530; Raleigh, North Carolina; 27612.
Except as set forth above, the information required by this Item with respect to our directors, executive officers and corporate governance matters is contained in our definitive Proxy Statement for our 2012 Annual Meeting of Stockholders to be filed with the Securities and Exchange Commission pursuant to Regulation 14A under the Exchange Act and is incorporated in this Annual Report by reference in response to this Item. Our definitive Proxy Statement will be filed with the Commission within 120 days after the date of our fiscal year-end, which was December 31, 2011.
Item 11. Executive Compensation.
The information required by this Item with respect to compensation of executive officers and directors is contained in our definitive Proxy Statement for our 2012 Annual Meeting of Stockholders to be filed with the Securities and Exchange Commission pursuant to Regulation 14A under the Exchange Act and is incorporated in this Annual Report by reference in response to this Item. Our definitive Proxy Statement will be filed with the Commission within 120 days after the date of our fiscal year-end, which was December 31, 2011.
79
Table of Contents
Item 12. Security Ownership of Certain Beneficial Owners and Management and Related Stockholder
Matters.
The information required by this Item with respect to security ownership of certain beneficial owners and management and equity compensation plans is contained in our definitive Proxy Statement for our 2012 Annual Meeting of Stockholders to be filed with the Securities and Exchange Commission pursuant to Regulation 14A under the Exchange Act and is incorporated in this Annual Report by reference in response to this Item. Our definitive Proxy Statement will be filed with the Commission within 120 days after the date of our fiscal year-end, which was December 31, 2011.
Item 13. Certain Relationships and Related Transactions, and Director Independence.
The information required by this Item with respect to certain relationships and related transactions and director independence is contained in our definitive Proxy Statement for our 2012 Annual Meeting of Stockholders to be filed with the Securities and Exchange Commission pursuant to Regulation 14A under the Exchange Act and is incorporated in this Annual Report by reference in response to this Item. Our definitive Proxy Statement will be filed with the Commission within 120 days after the date of our fiscal year-end, which was December 31, 2011.
Item 14. Principal Accountant Fees and Services.
The information required by this Item with respect to principal accountant fees and services is contained in our definitive Proxy Statement for our 2012 Annual Meeting of Stockholders to be filed with the Securities and Exchange Commission pursuant to Regulation 14A under the Exchange Act and is incorporated in this Annual Report by reference in response to this Item. Our definitive Proxy Statement will be filed with the Commission within 120 days after the date of our fiscal year-end, which was December 31, 2011.
80
Table of Contents
PART IV
Item 15. Exhibits and Financial Statement Schedules.
(a) The following documents are filed as part of this Report:
(1) Financial Statements
Triangle Capital Corporation Financial Statements:
(2) Financial Statement Schedules
None.
Schedules that are not listed herein have been omitted because they are not applicable or the information required to be set forth therein is included in the Financial Statements or notes thereto.
(3) List of Exhibits
The exhibits required by Item 601 of Regulation S-K, except as otherwise noted, have been filed with previous reports by the Registrant and are herein incorporated by reference.
| Number |
Exhibit |
|
| 3.1 | Articles of Amendment and Restatement of the Registrant (Filed as Exhibit (a)(3) to the Registrants Registration Statement on Form N-2/N-5 (File No. 333-138418) filed with the Securities and Exchange Commission on December 29, 2006 and incorporated herein by reference). | |
| 3.2 | Third Amended and Restated Bylaws of the Registrant (Filed as Exhibit 3.2 to the Registrants Quarterly Report on Form 10-Q filed with the Securities and Exchange Commission on May 4, 2011 and incorporated herein by reference). | |
| 3.3 | Certificate of Domestic Limited Partnership of Triangle Mezzanine Fund LLLP (Filed as Exhibit (a)(4) to the Registrants Registration Statement on Form N-2/N-5 (File No. 333-138418) filed with the Securities and Exchange Commission on February 13, 2007 and incorporated herein by reference). | |
| 3.4 | Second Amended and Restated Agreement of Limited Partnership of Triangle Mezzanine Fund LLLP (Filed as Exhibit 3.4 to the Registrants Quarterly Report on Form 10-Q filed with the Securities and Exchange Commission on November 7, 2007 and incorporated herein by reference). | |
| 4.1 | Form of Common Stock Certificate (Filed as Exhibit (d) to the Registrants Registration Statement on Form N-2/N-5 (File No. 333-138418) filed with the Securities and Exchange Commission on February 15, 2007 and incorporated herein by reference). | |
81
Table of Contents
| Number |
Exhibit |
|
| 4.2 | Triangle Capital Corporation Dividend Reinvestment Plan (Filed as Exhibit 4.2 to the Registrants Annual Report on Form 10-K for the year ended December 31, 2007 filed with the Securities and Exchange Commission on March 12, 2008 and incorporated herein by reference). | |
| 4.3 | Agreement to Furnish Certain Instruments (Filed as Exhibit 4.19 to the Registrants Annual Report on Form 10-K for the year ended December 31, 2008 filed with the Securities and Exchange Commission on February 25, 2009 and incorporated herein by reference). | |
| 4.4 | Indenture, dated March 2, 2012 between the Registrant and the Bank of New York Mellon Trust Company, N.A. (Filed as Exhibit (d)(5) to the Registrants Post-Effective Amendment No. 2 on Form N-2 filed with the Securities and Exchange Commission on March 2, 2012 and incorporated herein by reference). | |
| 4.5 | First Supplemental Indenture, dated March 2, 2012 between the Registrant and the Bank of New York Mellon Trust Company, N.A. (Filed as Exhibit (d)(6) to the Registrants Post-Effective Amendment No. 2 on Form N-2 filed with the Securities and Exchange Commission on March 2, 2012 and incorporated herein by reference). | |
| 4.6 | Form of 7.00% Senior Note due 2019 (Filed as Exhibit (d)(7) to the Registrants Post-Effective Amendment No. 2 on Form N-2 filed with the Securities and Exchange Commission on March 2, 2012 and incorporated herein by reference). | |
| 10.1 | Triangle Capital Corporation Amended and Restated 2007 Equity Incentive Plan (Filed as Exhibit 10.1 to the Registrants Current Report on Form 8-K filed with the Securities and Exchange Commission on May 9, 2008 and incorporated herein by reference). | |
| 10.2 | Form of Triangle Capital Corporation Non-employee Director Restricted Share Award Agreement (Filed as Exhibit 10.2 to the Registrants Current Report on Form 8-K filed with the Securities and Exchange Commission on May 9, 2008 and incorporated herein by reference). | |
| 10.3 | Form of Triangle Capital Corporation Executive Officer Restricted Share Award Agreement (Filed as Exhibit 10.3 to the Registrants Annual Report on Form 10-K filed with the Securities and Exchange Commission on March 9, 2011 and incorporated herein by reference). | |
| 10.4 | Custodian Agreement between the Registrant and U.S. Bank National Association (Filed as Exhibit 10.7 to the Registrants Annual Report on Form 10-K for the year ended December 31, 2006 filed with the Securities and Exchange Commission on March 29, 2007 and incorporated herein by reference). | |
| 10.5 | Amendment to Custody Agreement between the Registrant and U.S. Bank National Association dated February 5, 2008 (Filed as Exhibit 10.9 to the Registrants Annual Report on Form 10-K for the year ended December 31, 2007 filed with the Securities and Exchange Commission on March 12, 2008 and incorporated herein by reference). | |
| 10.6 | Custodial Agreement between the Registrant and Branch Banking and Trust Company dated January 26, 2012. (Filed as Exhibit (j)(3) to the Registrants Post-Effective Amendment No. 2 on Form N-2 filed with the Securities and Exchange Commission on March 2, 2012 and incorporated herein by reference) | |
| 10.7 | Custody Services Agreement between the Registrant and Fifth Third Institutional Services dated January 6, 2012. (Filed as Exhibit (j)(4) to the Registrants Post-Effective Amendment No. 2 on Form N-2 filed with the Securities and Exchange Commission on March 2, 2012 and incorporated herein by reference) | |
| 10.8 | Stock Transfer Agency Agreement between the Registrant and The Bank of New York (Filed as Exhibit 10.11 to the Registrants Annual Report on Form 10-K for the year ended December 31, 2007 filed with the Securities and Exchange Commission on March 12, 2008 and incorporated herein by reference). | |
82
Table of Contents
| Number |
Exhibit |
|
| 10.9 | Office Lease Agreement between 3700 Glenwood LLC and the Registrant dated March 27, 2008 (Filed as Exhibit (k)(6) to the Registrants Registration Statement on Form N-2 (File No. 333-151930) filed with the Securities and Exchange Commission on August 13, 2008 and incorporated herein by reference). | |
| 10.10 | Credit Agreement between the Registrant, Branch Banking and Trust Company, BB&T Capital Markets and Fifth Third Bank dated May 9, 2011 (Incorporated by reference to Exhibit 10.1 to the Registrants Current Report on Form 8-K, filed on May 11, 2011). | |
| 10.11 | Supplement and Joinder Agreement between the Registrant, Branch Banking and Trust Company, Fifth Third Bank and Morgan Stanley Bank, N.A. dated November 1, 2011 (Incorporated by reference to Exhibit 10.1 to the Registrants Current Report on Form 8-K, filed on November 2, 2011). | |
| 10.12 | General Security Agreement between the Registrant, ARC Industries Holdings, Inc., Brantley Holdings, Inc., Energy Hardware Holdings, Inc., Minco Holdings, Inc., Peaden Holdings, Inc., Technology Crops Holdings, Inc. and Branch Banking and Trust Company dated May 9, 2011 (Incorporated by reference to Exhibit 10.2 to the Registrants Current Report on Form 8-K, filed on May 11, 2011). | |
| 10.13 | Equity Pledge Agreement between the Registrant, ARC Industries Holdings, Inc., Brantley Holdings, Inc., Energy Hardware Holdings, Inc., Minco Holdings, Inc., Peaden Holdings, Inc., Technology Crops Holdings, Inc. and Branch Banking and Trust Company dated May 9, 2011 (Incorporated by reference to Exhibit 10.3 to the Registrants Current Report on Form 8-K, filed on May 11, 2011). | |
| 14.1 | Code of Business Conduct and Ethics (Filed as Exhibit 14.1 to the Registrants Annual Report on Form 10-K filed with the Securities and Exchange Commission on March 9, 2011 and incorporated herein by reference). | |
| 21.1 | List of Subsidiaries.* | |
| 23.1 | Consent of Ernst & Young LLP.* | |
| 31.1 | Chief Executive Officer Certification Pursuant to Rule 13a-14 of the Securities Exchange Act of 1934, as adopted pursuant to Section 302 of the Sarbanes-Oxley Act of 2002.* | |
| 31.2 | Chief Financial Officer Certification Pursuant to Rule 13a-14 of the Securities Exchange Act of 1934, as adopted pursuant to Section 302 of the Sarbanes-Oxley Act of 2002.* | |
| 32.1 | Chief Executive Officer Certification pursuant to Section 1350, Chapter 63 of Title 18, United States Code, as adopted pursuant to Section 906 of the Sarbanes-Oxley Act of 2002.* | |
| 32.2 | Chief Financial Officer Certification pursuant to Section 1350, Chapter 63 of Title 18, United States Code, as adopted pursuant to Section 906 of the Sarbanes-Oxley Act of 2002.* | |
| | Management contract or compensatory plan or arrangement. |
| * | Filed herewith. |
(b) Exhibits
See Item 15(a)(3) above.
(c) Financial Statement Schedules
See Item 15(a)(2) above.
83
Table of Contents
Pursuant to the requirements of Section 13 or 15(d) the Securities Exchange Act of 1934, the Registrant has duly caused this report to be signed on its behalf by the undersigned, thereunto duly authorized.
Date: March 7, 2012
| TRIANGLE CAPITAL CORPORATION | ||||
| By: |
/s/ Garland S. Tucker, III |
|||
| Name: | Garland S. Tucker, III | |||
| Title: | President, Chief Executive Officer and Chairman of the Board of Directors | |||
Pursuant to the requirements of the Securities Exchange Act of 1934, this report has been signed below by the following persons on behalf of the registrant and in the capacities and on the dates indicated.
| Signature |
Title |
Date |
||
| /s/ Garland S. Tucker, III Garland S. Tucker, III |
President, Chief Executive Officer and Chairman of the Board (Principal Executive Officer) | March 7, 2012 | ||
| /s/ Steven C. Lilly Steven C. Lilly |
Chief Financial Officer, Treasurer, Secretary and Director (Principal Financial Officer) | March 7, 2012 | ||
| /s/ C. Robert Knox, Jr. C. Robert Knox, Jr. |
Controller (Principal Accounting Officer) | March 7, 2012 | ||
| /s/ Brent P. W. Burgess Brent P. W. Burgess |
Chief Investment Officer and Director | March 7, 2012 | ||
| /s/ W. McComb Dunwoody W. McComb Dunwoody |
Director | March 7, 2012 | ||
| /s/ Mark M. Gambill Mark M. Gambill |
Director | March 7, 2012 | ||
| /s/ Benjamin S. Goldstein Benjamin S. Goldstein |
Director | March 7, 2012 | ||
| /s/ Simon B. Rich, Jr. Simon B. Rich, Jr. |
Director | March 7, 2012 | ||
| /s/ Sherwood H. Smith, Jr. Sherwood H. Smith, Jr. |
Director | March 7, 2012 | ||
84
Table of Contents
Triangle Capital Corporation
Table of Contents
Report of Independent Registered Public Accounting Firm
To the Board of Directors and Stockholders
Triangle Capital Corporation
We have audited the accompanying consolidated balance sheets of Triangle Capital Corporation (the Company), including the consolidated schedules of investments, as of December 31, 2011 and 2010, and the related consolidated statements of operations, changes in net assets, and cash flows, for each of the three years in the period ended December 31, 2011. We have also audited the accompanying consolidated financial highlights for each of the five years in the period ended December 31, 2011. These financial statements and financial highlights are the responsibility of the Companys management. Our responsibility is to express an opinion on these financial statements and financial highlights based on our audits.
We conducted our audits in accordance with the standards of the Public Company Accounting Oversight Board (United States). Those standards require that we plan and perform the audit to obtain reasonable assurance about whether the financial statements and financial highlights are free of material misstatement. An audit includes examining, on a test basis, evidence supporting the amounts and disclosures in the financial statements and financial highlights. An audit also includes assessing the accounting principles used and significant estimates made by management, as well as evaluating the overall financial statement presentation. Our procedures included confirmation of securities owned as of December 31, 2011 and 2010 by correspondence with the custodian. We believe that our audits provide a reasonable basis for our opinion.
In our opinion, the financial statements and financial highlights referred to above present fairly, in all material respects, the consolidated financial position of Triangle Capital Corporation at December 31, 2011 and 2010, the consolidated results of its operations, changes in net assets, and its cash flows, for each of the three years in the period in the period ended December 31, 2011, and the consolidated financial highlights for each of the five years in the period ended December 31, 2011, in conformity with U.S. generally accepted accounting principles.
We also have audited, in accordance with the standards of the Public Company Accounting Oversight Board (United States), Triangle Capital Corporations internal control over financial reporting as of December 31, 2011, based on criteria established in Internal Control-Integrated Framework issued by the Committee of Sponsoring Organizations of the Treadway Commission and our report dated March 7, 2012 expressed an unqualified opinion thereon.
/s/ Ernst & Young LLP
Raleigh, North Carolina
March 7, 2012
F-1
Table of Contents
Report of Independent Registered Public Accounting Firm
To the Board of Directors and Stockholders
Triangle Capital Corporation
We have audited Triangle Capital Corporations internal control over financial reporting as of December 31, 2011, based on criteria established in Internal Control Integrated Framework issued by the Committee of Sponsoring Organizations of the Treadway Commission (the COSO criteria). Triangle Capital Corporations management is responsible for maintaining effective internal control over financial reporting, and for its assessment of the effectiveness of internal control over financial reporting included in the accompanying Managements Report on Internal Control over Financial Reporting. Our responsibility is to express an opinion on the companys internal control over financial reporting based on our audit.
We conducted our audit in accordance with the standards of the Public Company Accounting Oversight Board (United States). Those standards require that we plan and perform the audit to obtain reasonable assurance about whether effective internal control over financial reporting was maintained in all material respects. Our audit included obtaining an understanding of internal control over financial reporting, assessing the risk that a material weakness exists, testing and evaluating the design and operating effectiveness of internal control based on the assessed risk, and performing such other procedures as we considered necessary in the circumstances. We believe that our audit provides a reasonable basis for our opinion.
A companys internal control over financial reporting is a process designed to provide reasonable assurance regarding the reliability of financial reporting and the preparation of financial statements for external purposes in accordance with generally accepted accounting principles. A companys internal control over financial reporting includes those policies and procedures that (1) pertain to the maintenance of records that, in reasonable detail, accurately and fairly reflect the transactions and dispositions of the assets of the company; (2) provide reasonable assurance that transactions are recorded as necessary to permit preparation of financial statements in accordance with generally accepted accounting principles, and that receipts and expenditures of the company are being made only in accordance with authorizations of management and directors of the company; and (3) provide reasonable assurance regarding prevention or timely detection of unauthorized acquisition, use, or disposition of the companys assets that could have a material effect on the financial statements.
Because of its inherent limitations, internal control over financial reporting may not prevent or detect misstatements. Also, projections of any evaluation of effectiveness to future periods are subject to the risk that controls may become inadequate because of changes in conditions, or that the degree of compliance with the policies or procedures may deteriorate.
In our opinion, Triangle Capital Corporation maintained, in all material respects, effective internal control over financial reporting as of December 31, 2011, based on the COSO criteria.
We also have audited, in accordance with the standards of the Public Company Accounting Oversight Board (United States), the consolidated balance sheets of Triangle Capital Corporation (the Company), including the consolidated schedules of investments, as of December 31, 2011 and 2010, and the related consolidated statements of operations, changes in net assets, and cash flows, for each of the three years in the period ended December 31, 2011. We have also audited the accompanying consolidated financial highlights for each of the five years in the period ended December 31, 2011 and our report dated March 7, 2012 expressed an unqualified opinion thereon.
/s/ Ernst & Young LLP
Raleigh, North Carolina
March 7, 2012
F-2
Table of Contents
Consolidated Balance Sheets
| December 31, | ||||||||
| 2011 | 2010 | |||||||
| Assets | ||||||||
| Investments at fair value: |
||||||||
| Non Control / Non Affiliate investments (cost of $389,312,451 and $244,197,828 at December 31, 2011 and 2010, respectively) |
$ | 396,502,490 | $ | 245,392,144 | ||||
| Affiliate investments (cost of $97,751,264 and $60,196,084 at December 31, 2011 and 2010, respectively) |
103,266,298 | 55,661,878 | ||||||
| Control investments (cost of $11,278,339 and $19,647,795 at December 31, 2011 and 2010, respectively) |
7,309,787 | 24,936,571 | ||||||
|
|
|
|
|
|||||
| Total investments at fair value |
507,078,575 | 325,990,593 | ||||||
| Cash and cash equivalents |
66,868,340 | 54,820,222 | ||||||
| Interest and fees receivable |
1,883,395 | 867,627 | ||||||
| Prepaid expenses and other current assets |
623,318 | 119,151 | ||||||
| Deferred financing fees |
6,682,889 | 6,200,254 | ||||||
| Property and equipment, net |
58,304 | 47,647 | ||||||
|
|
|
|
|
|||||
| Total assets |
$ | 583,194,821 | $ | 388,045,494 | ||||
|
|
|
|
|
|||||
| Liabilities | ||||||||
| Accounts payable and accrued liabilities |
$ | 4,116,822 | $ | 2,268,898 | ||||
| Interest payable |
3,521,932 | 2,388,505 | ||||||
| Taxes payable |
1,402,866 | 197,979 | ||||||
| Deferred revenue |
| 37,500 | ||||||
| Deferred income taxes |
628,742 | 208,587 | ||||||
| Borrowings under Credit Facility |
15,000,000 | | ||||||
| SBA-guaranteed debentures payable |
224,237,504 | 202,464,866 | ||||||
|
|
|
|
|
|||||
| Total liabilities |
248,907,866 | 207,566,335 | ||||||
| Net Assets |
||||||||
| Common stock, $0.001 par value per share (150,000,000 shares authorized, 22,774,726 and 14,928,987 shares issued and outstanding as of December 31, 2011 and 2010, respectively) |
22,775 | 14,929 | ||||||
| Additional paid-in-capital |
318,297,269 | 183,602,755 | ||||||
| Investment income in excess of distributions |
6,847,486 | 3,365,548 | ||||||
| Accumulated realized gains (losses) on investments |
1,011,649 | (8,244,376 | ) | |||||
| Net unrealized appreciation of investments |
8,107,776 | 1,740,303 | ||||||
|
|
|
|
|
|||||
| Total net assets |
334,286,955 | 180,479,159 | ||||||
|
|
|
|
|
|||||
| Total liabilities and net assets |
$ | 583,194,821 | $ | 388,045,494 | ||||
|
|
|
|
|
|||||
| Net asset value per share |
$ | 14.68 | $ | 12.09 | ||||
|
|
|
|
|
|||||
See accompanying notes.
F-3
Table of Contents
Consolidated Statements of Operations
| Year Ended December 31, | ||||||||||||
| 2011 | 2010 | 2009 | ||||||||||
| Investment income: |
||||||||||||
| Loan interest, fee and dividend income: |
||||||||||||
| Non Control / Non Affiliate investments |
$ | 42,733,900 | $ | 24,187,140 | $ | 16,489,943 | ||||||
| Affiliate investments |
8,137,269 | 4,140,469 | 4,441,399 | |||||||||
| Control investments |
1,377,232 | 1,333,385 | 1,142,764 | |||||||||
|
|
|
|
|
|
|
|||||||
| Total loan interest, fee and dividend income |
52,248,401 | 29,660,994 | 22,074,106 | |||||||||
| Paidinkind interest income: |
||||||||||||
| Non Control / Non Affiliate investments |
8,321,758 | 4,449,358 | 3,114,325 | |||||||||
| Affiliate investments |
2,274,514 | 1,059,069 | 1,539,776 | |||||||||
| Control investments |
157,335 | 471,431 | 420,718 | |||||||||
|
|
|
|
|
|
|
|||||||
| Total paidinkind interest income |
10,753,607 | 5,979,858 | 5,074,819 | |||||||||
| Interest income from cash and cash equivalent investments |
361,973 | 344,642 | 613,057 | |||||||||
|
|
|
|
|
|
|
|||||||
| Total investment income |
63,363,981 | 35,985,494 | 27,761,982 | |||||||||
|
|
|
|
|
|
|
|||||||
| Expenses: |
||||||||||||
| Interest and credit facility fees |
10,114,011 | 7,350,012 | 6,900,591 | |||||||||
| Amortization of deferred financing fees |
945,492 | 796,994 | 363,818 | |||||||||
| General and administrative expenses |
11,965,985 | 7,689,015 | 6,448,999 | |||||||||
|
|
|
|
|
|
|
|||||||
| Total expenses |
23,025,488 | 15,836,021 | 13,713,408 | |||||||||
|
|
|
|
|
|
|
|||||||
| Net investment income |
40,338,493 | 20,149,473 | 14,048,574 | |||||||||
| Net realized gains (losses): |
||||||||||||
| Net realized gain (loss) on investments Non Control / |
1,894,677 | (1,623,104 | ) | 448,164 | ||||||||
| Net realized loss on investment Affiliate |
| (3,855,769 | ) | | ||||||||
| Net realized gain on investment Control |
9,078,810 | | | |||||||||
|
|
|
|
|
|
|
|||||||
| Total net realized gains (losses) |
10,973,487 | (5,478,873 | ) | 448,164 | ||||||||
| Net unrealized appreciation (depreciation) of investments |
6,367,473 | 10,940,689 | (10,310,194 | ) | ||||||||
|
|
|
|
|
|
|
|||||||
| Total net gain (loss) on investments before income taxes |
17,340,960 | 5,461,816 | (9,862,030 | ) | ||||||||
| Provision for taxes |
(908,416 | ) | (220,740 | ) | (149,841 | ) | ||||||
|
|
|
|
|
|
|
|||||||
| Net increase in net assets resulting from operations |
$ | 56,771,037 | $ | 25,390,549 | $ | 4,036,703 | ||||||
|
|
|
|
|
|
|
|||||||
| Net investment income per share basic and diluted |
$ | 2.06 | $ | 1.58 | $ | 1.63 | ||||||
|
|
|
|
|
|
|
|||||||
| Net increase in net assets resulting from operations per share basic and diluted |
$ | 2.90 | $ | 1.99 | $ | 0.47 | ||||||
|
|
|
|
|
|
|
|||||||
| Dividends declared per common share |
$ | 1.77 | $ | 1.61 | $ | 1.62 | ||||||
|
|
|
|
|
|
|
|||||||
| Capital gains distributions declared per common share |
$ | | $ | 0.04 | $ | 0.05 | ||||||
|
|
|
|
|
|
|
|||||||
| Weighted average number of shares outstanding basic and diluted |
19,555,268 | 12,763,243 | 8,593,143 | |||||||||
|
|
|
|
|
|
|
|||||||
See accompanying notes.
F-4
Table of Contents
Statements of Changes in Net Assets
|
Investment Income in Excess of (Less Than) Distributions |
Accumulated Realized Gains (Losses) on Investments |
Net Unrealized Appreciation (Depreciation) of Investments |
||||||||||||||||||||||||||
| Common Stock |
Additional Paid In Capital |
Total Net Assets |
||||||||||||||||||||||||||
|
Number of Shares |
Par Value |
|||||||||||||||||||||||||||
| Balance, January 1, 2009 |
6,917,363 | $ | 6,917 | $ | 87,836,786 | $ | 2,115,157 | $ | 356,495 | $ | 1,109,808 | $ | 91,425,163 | |||||||||||||||
| Net investment income |
| | | 14,048,574 | | | 14,048,574 | |||||||||||||||||||||
| Stock-based compensation |
| | 701,601 | | | | 701,601 | |||||||||||||||||||||
| Realized gain (loss) on investments |
| | | | 448,164 | (157,316 | ) | 290,848 | ||||||||||||||||||||
| Net unrealized losses on investments |
| | | | | (10,152,878 | ) | (10,152,878 | ) | |||||||||||||||||||
| Provision for taxes |
| | | (149,841 | ) | | | (149,841 | ) | |||||||||||||||||||
| Return of capital and other tax related adjustments |
| | (29,996 | ) | 34,125 | (4,129 | ) | | | |||||||||||||||||||
| Dividends/distributions declared |
80,569 | 81 | 999,791 | (14,977,563 | ) | (352,366 | ) | | (14,330,057 | ) | ||||||||||||||||||
| Public offerings of common stock |
4,569,000 | 4,569 | 47,328,113 | | | | 47,332,682 | |||||||||||||||||||||
| Issuance of restricted stock |
144,812 | 145 | (145 | ) | | | | | ||||||||||||||||||||
| Common stock withheld for payroll taxes upon vesting of restricted stock |
(6,533 | ) | (6 | ) | (66,894 | ) | | | | (66,900 | ) | |||||||||||||||||
| Forfeiture of restricted stock |
(2,700 | ) | (3 | ) | 3 | | | | | |||||||||||||||||||
|
|
|
|
|
|
|
|
|
|
|
|
|
|
|
|||||||||||||||
| Balance, December 31, 2009 |
11,702,511 | $ | 11,703 | $ | 136,769,259 | $ | 1,070,452 | $ | 448,164 | $ | (9,200,386 | ) | $ | 129,099,192 | ||||||||||||||
| Net investment income |
| | | 20,149,473 | | | 20,149,473 | |||||||||||||||||||||
| Stock-based compensation |
| | 1,151,576 | | | | 1,151,576 | |||||||||||||||||||||
| Realized gain (loss) on investments |
| | | | (5,478,873 | ) | 6,423,467 | 944,594 | ||||||||||||||||||||
| Net unrealized gains on investments |
| | | | | 4,517,222 | 4,517,222 | |||||||||||||||||||||
| Provision for taxes |
| | | (220,740 | ) | | | (220,740 | ) | |||||||||||||||||||
| Return of capital and other tax related adjustments |
| | (171,918 | ) | 3,385,585 | (3,213,667 | ) | | | |||||||||||||||||||
| Dividends/distributions declared |
332,149 | 332 | 4,878,676 | (21,019,222 | ) | | | (16,140,214 | ) | |||||||||||||||||||
| Public offerings of common stock |
2,760,000 | 2,760 | 41,210,208 | | | | 41,212,968 | |||||||||||||||||||||
| Issuance of restricted stock |
152,944 | 153 | (153 | ) | | | | | ||||||||||||||||||||
| Common stock withheld for payroll taxes upon vesting of restricted stock |
(18,617 | ) | (19 | ) | (234,893 | ) | | | | (234,912 | ) | |||||||||||||||||
|
|
|
|
|
|
|
|
|
|
|
|
|
|
|
|||||||||||||||
| Balance, December 31, 2010 |
14,928,987 | $ | 14,929 | $ | 183,602,755 | $ | 3,365,548 | $ | (8,244,376 | ) | $ | 1,740,303 | $ | 180,479,159 | ||||||||||||||
| Net investment income |
| | | 40,338,493 | | | 40,338,493 | |||||||||||||||||||||
| Stock-based compensation |
| | 1,909,808 | | | | 1,909,808 | |||||||||||||||||||||
| Realized gain (loss) on investments |
| | | | 10,973,487 | (9,621,107 | ) | 1,352,380 | ||||||||||||||||||||
| Net unrealized gains on investments |
| | | | | 15,988,580 | 15,988,580 | |||||||||||||||||||||
| Provision for taxes |
| | | (908,416 | ) | | | (908,416 | ) | |||||||||||||||||||
| Return of capital and other tax related adjustments |
| | 584,146 | 638,083 | (1,222,229 | ) | | | ||||||||||||||||||||
| Dividends/distributions declared |
241,630 | 242 | 4,215,220 | (36,586,222 | ) | | | (32,370,760 | ) | |||||||||||||||||||
| Taxes paid on deemed distribution of long term capital gains |
| | | | (495,233 | ) | | (495,233 | ) | |||||||||||||||||||
| Public offerings of common stock |
7,475,000 | 7,475 | 128,628,777 | | | | 128,636,252 | |||||||||||||||||||||
| Issuance of restricted stock |
161,174 | 161 | (161 | ) | | | | | ||||||||||||||||||||
| Common stock withheld for payroll taxes upon vesting of restricted stock |
(32,065 | ) | (32 | ) | (643,276 | ) | | | | (643,308 | ) | |||||||||||||||||
|
|
|
|
|
|
|
|
|
|
|
|
|
|
|
|||||||||||||||
| Balance, December 31, 2011 |
22,774,726 | $ | 22,775 | $ | 318,297,269 | $ | 6,847,486 | $ | 1,011,649 | $ | 8,107,776 | $ | 334,286,955 | |||||||||||||||
|
|
|
|
|
|
|
|
|
|
|
|
|
|
|
|||||||||||||||
See accompanying notes.
F-5
Table of Contents
Consolidated Statements of Cash Flows
| Year Ended December 31, | ||||||||||||
| 2011 | 2010 | 2009 | ||||||||||
| Cash flows from operating activities: |
||||||||||||
| Net increase in net assets resulting from operations |
$ | 56,771,037 | $ | 25,390,549 | $ | 4,036,703 | ||||||
| Adjustments to reconcile net increase in net assets resulting from operations to net cash used in operating activities: |
||||||||||||
| Purchases of portfolio investments |
(224,996,843 | ) | (173,581,930 | ) | (48,475,570 | ) | ||||||
| Repayments received/sales of portfolio investments |
66,345,192 | 54,914,835 | 21,431,698 | |||||||||
| Loan origination and other fees received |
4,364,689 | 3,351,568 | 952,500 | |||||||||
| Net realized (gain) loss on investments |
(10,973,487 | ) | 5,478,873 | (448,164 | ) | |||||||
| Net unrealized (appreciation) depreciation on investments |
(6,787,628 | ) | (10,572,009 | ) | 10,576,873 | |||||||
| Deferred income taxes |
420,155 | (368,680 | ) | (266,680 | ) | |||||||
| Paid in kind interest accrued, net of payments received |
(6,110,494 | ) | (2,269,307 | ) | (2,165,015 | ) | ||||||
| Amortization of deferred financing fees |
945,492 | 796,994 | 363,818 | |||||||||
| Accretion of loan origination and other fees |
(1,751,182 | ) | (1,268,839 | ) | (663,506 | ) | ||||||
| Accretion of loan discounts |
(1,178,229 | ) | (701,268 | ) | (421,495 | ) | ||||||
| Accretion of discount on SBA-guaranteed debentures payable |
172,638 | 50,948 | | |||||||||
| Depreciation expense |
27,295 | 19,554 | 22,548 | |||||||||
| Stock-based compensation |
1,909,808 | 1,151,576 | 701,601 | |||||||||
| Changes in operating assets and liabilities: |
||||||||||||
| Interest and fees receivable |
(1,015,768 | ) | (215,212 | ) | 2,867 | |||||||
| Prepaid expenses and other current assets |
(504,167 | ) | 167,639 | (191,465 | ) | |||||||
| Accounts payable and accrued liabilities |
1,847,924 | 46,721 | 613,268 | |||||||||
| Interest payable |
1,133,427 | 54,553 | 452,191 | |||||||||
| Deferred revenue |
(37,500 | ) | (37,500 | ) | 75,000 | |||||||
| Taxes payable |
1,204,887 | 138,801 | 28,742 | |||||||||
|
|
|
|
|
|
|
|||||||
| Net cash used in operating activities |
(118,212,754 | ) | (97,452,134 | ) | (13,374,086 | ) | ||||||
|
|
|
|
|
|
|
|||||||
| Cash flows from investing activities: |
||||||||||||
| Purchases of property and equipment |
(37,952 | ) | (38,535 | ) | (3,194 | ) | ||||||
|
|
|
|
|
|
|
|||||||
| Net cash used in investing activities |
(37,952 | ) | (38,535 | ) | (3,194 | ) | ||||||
|
|
|
|
|
|
|
|||||||
| Cash flows from financing activities: |
||||||||||||
| Borrowings under SBA-guaranteed debentures payable |
31,100,000 | 102,803,918 | 6,800,000 | |||||||||
| Repayments of SBA-guaranteed debentures payable |
(9,500,000 | ) | (22,300,000 | ) | | |||||||
| Borrowings under Credit Facility |
30,400,000 | | | |||||||||
| Repayments of borrowings under Credit Facility |
(15,400,000 | ) | | | ||||||||
| Financing fees paid |
(1,428,127 | ) | (3,456,756 | ) | (358,900 | ) | ||||||
| Proceeds from public stock offerings, net of expenses |
128,636,252 | 41,212,968 | 47,332,682 | |||||||||
| Common stock withheld for payroll taxes upon vesting of restricted stock |
(643,308 | ) | (234,912 | ) | (66,900 | ) | ||||||
| Taxes paid on deemed distribution of long term capital gains |
(495,233 | ) | | | ||||||||
| Cash dividends paid |
(32,370,760 | ) | (20,466,584 | ) | (11,970,102 | ) | ||||||
| Cash distributions paid |
| (448,164 | ) | (352,366 | ) | |||||||
|
|
|
|
|
|
|
|||||||
| Net cash provided by financing activities |
130,298,824 | 97,110,470 | 41,384,414 | |||||||||
|
|
|
|
|
|
|
|||||||
| Net increase (decrease) in cash and cash equivalents |
12,048,118 | (380,199 | ) | 28,007,134 | ||||||||
| Cash and cash equivalents, beginning of year |
54,820,222 | 55,200,421 | 27,193,287 | |||||||||
|
|
|
|
|
|
|
|||||||
| Cash and cash equivalents, end of year |
$ | 66,868,340 | $ | 54,820,222 | $ | 55,200,421 | ||||||
|
|
|
|
|
|
|
|||||||
| Supplemental Disclosure of cash flow information: |
||||||||||||
| Cash paid for interest |
$ | 8,675,796 | $ | 7,244,512 | $ | 6,448,400 | ||||||
|
|
|
|
|
|
|
|||||||
| Summary of non-cash financing transactions: |
||||||||||||
| Dividends declared but not paid |
$ | | $ | | $ | 4,774,534 | ||||||
| Dividends paid through DRIP share issuances |
$ | 4,215,462 | $ | 4,879,008 | $ | 999,872 | ||||||
See accompanying notes.
F-6
Table of Contents
Consolidated Schedule of Investments
December 31, 2011
| Portfolio Company |
Industry |
Type of Investment(1)(2) |
Principal Amount |
Cost | Fair Value(3) |
|||||||||||
| Non Control / Non Affiliate Investments: |
||||||||||||||||
| Ambient Air Corporation (AA) and Peaden-Hobbs Mechanical, LLC (PHM) (1%)* |
Specialty Trade Contractors | Subordinated Note-AA (15% Cash, 3% PIK, Due 06/13) |
$ | 4,127,773 | $ | 4,103,291 | $ | 4,103,291 | ||||||||
| Subordinated Note-PHM (12% Cash, Due 09/12) | 12,857 | 12,857 | 12,857 | |||||||||||||
| Common Stock-PHM (128,571 shares) | 128,571 | 128,571 | ||||||||||||||
| Common Stock Warrants-AA (455 shares) | 142,361 | 760,000 | ||||||||||||||
|
|
|
|
|
|
|
|||||||||||
| 4,140,630 | 4,387,080 | 5,004,719 | ||||||||||||||
| Anns House of Nuts, Inc. (3%)* |
Trail Mixes and Nut Producers |
Subordinated Note (12% Cash, 1% PIK, Due 11/17) | 7,080,843 | 6,716,662 | 6,716,662 | |||||||||||
| Preferred A Units (22,368 units) | 2,124,957 | 2,407,000 | ||||||||||||||
| Preferred B Units (10,380 units) | 986,059 | 1,204,000 | ||||||||||||||
| Common Units (190,935 units) | 150,000 | | ||||||||||||||
| Common Stock Warrants (14,558 shares) | 14,558 | | ||||||||||||||
|
|
|
|
|
|
|
|||||||||||
| 7,080,843 | 9,992,236 | 10,327,662 | ||||||||||||||
| Aramsco, Inc. (1%) |
Environmental Emergency Preparedness Products Distributor |
Subordinated Note (12% Cash, 2% PIK, Due 03/14) |
1,800,997 | 1,673,278 | 1,673,278 | |||||||||||
|
|
|
|
|
|
|
|||||||||||
| 1,800,997 | 1,673,278 | 1,673,278 | ||||||||||||||
| Assurance Operations Corporation (0%)* |
Metal Fabrication | Common Stock (517 Shares) | 516,867 | 773,000 | ||||||||||||
|
|
|
|
|
|||||||||||||
| 516,867 | 773,000 | |||||||||||||||
| BioSan Laboratories, Inc. (2%)* |
Nutritional Supplement Manufacturing and Distribution | Subordinated Note (12% Cash, 3.8% PIK, Due 10/16) |
5,276,296 | 5,179,676 | 5,179,676 | |||||||||||
|
|
|
|
|
|
|
|||||||||||
| 5,276,296 | 5,179,676 | 5,179,676 | ||||||||||||||
| Botanical Laboratories, Inc. (3%)* |
Nutritional Supplement Manufacturing and Distribution | Senior Notes (14% Cash, 1% PIK, Due 02/15) | 10,114,528 | 9,580,196 | 9,122,000 | |||||||||||
| Common Unit Warrants (998,680 Units) | 474,600 | | ||||||||||||||
|
|
|
|
|
|
|
|||||||||||
| 10,114,528 | 10,054,796 | 9,122,000 | ||||||||||||||
| Capital Contractors, Inc. (3%)* |
Janitorial and Facilities Maintenance Services | Subordinated Notes (12% Cash, 2% PIK, Due 12/15) | 9,185,225 | 8,617,853 | 8,617,853 | |||||||||||
| Common Stock Warrants (20 shares) |
492,000 | 398,000 | ||||||||||||||
|
|
|
|
|
|
|
|||||||||||
| 9,185,225 | 9,109,853 | 9,015,853 | ||||||||||||||
F-7
Table of Contents
TRIANGLE CAPITAL CORPORATION
Consolidated Schedule of Investments (Continued)
December 31, 2011
| Portfolio Company |
Industry |
Type of Investment(1)(2) |
Principal Amount |
Cost | Fair Value(3) |
|||||||||||
| Carolina Beverage Group, LLC (4%)* |
Beverage Manufacturing and Packaging |
Subordinated Note (12% Cash, 4% PIK, Due 02/16) | $ | 13,260,895 | $ | 13,055,973 | $ | 13,055,973 | ||||||||
| Class A Units (11,974 Units) | 1,077,615 | 1,120,000 | ||||||||||||||
| Class B Units (11,974 Units) | 119,735 | | ||||||||||||||
|
|
|
|
|
|
|
|||||||||||
| 13,260,895 | 14,253,323 | 14,175,973 | ||||||||||||||
| CRS Reprocessing, LLC (8%)* |
Fluid Reprocessing Services | Subordinated Note (12% Cash, 2% PIK, Due 11/15) | 11,357,260 | 11,022,004 | 11,022,004 | |||||||||||
| Subordinated Note (10% Cash, 4% PIK, Due 11/15) | 11,016,583 | 10,020,937 | 10,020,937 | |||||||||||||
| Series C Preferred Units (26 Units) | 288,342 | 476,000 | ||||||||||||||
| Common Unit Warrant (550 Units) | 1,253,556 | 4,040,000 | ||||||||||||||
|
|
|
|
|
|
|
|||||||||||
| 22,373,843 | 22,584,839 | 25,558,941 | ||||||||||||||
| CV Holdings, LLC (5%)* |
Specialty Healthcare Products Manufacturer | Subordinated Note (12% Cash, 4% PIK, Due 09/13) | 9,279,054 | 8,845,875 | 8,845,875 | |||||||||||
| Subordinated Note (12% Cash, Due 09/13) | 6,000,000 | 5,912,355 | 5,912,355 | |||||||||||||
| Royalty rights | 874,400 | 920,000 | ||||||||||||||
|
|
|
|
|
|
|
|||||||||||
| 15,279,054 | 15,632,630 | 15,678,230 | ||||||||||||||
| DLR Restaurants, LLC (3%)* |
Restaurant | Subordinated Note (12% Cash, 3% PIK, Due 03/16) | 10,660,442 | 10,448,050 | 10,448,050 | |||||||||||
| Subordinated Note (12% Cash, 4% PIK, Due 03/16) | 752,083 | 752,083 | 752,083 | |||||||||||||
| Royalty rights | | | ||||||||||||||
|
|
|
|
|
|
|
|||||||||||
| 11,412,525 | 11,200,133 | 11,200,133 | ||||||||||||||
| Electronic Systems Protection, Inc. (2%)* |
Power Protection Systems Manufacturing | Subordinated Note (12% Cash, 2% PIK, Due 12/15) | 4,162,798 | 4,128,357 | 4,128,357 | |||||||||||
| Senior Note (8.3% Cash, Due 01/14) | 681,475 | 681,475 | 681,475 | |||||||||||||
| Common Stock (570 shares) | 285,000 | 367,000 | ||||||||||||||
|
|
|
|
|
|
|
|||||||||||
| 4,844,273 | 5,094,832 | 5,176,832 | ||||||||||||||
| Frozen Specialties, Inc. (3%)* |
Frozen Foods Manufacturer | Subordinated Note (13% Cash, 5% PIK, Due 07/14) | 8,478,731 | 8,391,839 | 8,391,839 | |||||||||||
|
|
|
|
|
|
|
|||||||||||
| 8,478,731 | 8,391,839 | 8,391,839 | ||||||||||||||
| Garden Fresh Restaurant Corp. (0%)* |
Restaurant | Membership Units (5,000 units) | 500,000 | 820,000 | ||||||||||||
|
|
|
|
|
|||||||||||||
| 500,000 | 820,000 | |||||||||||||||
| Grindmaster-Cecilware Corp. (2%)* |
Food Services Equipment Manufacturer | Subordinated Note (12% Cash, 4.5% PIK, Due 04/16) | 6,274,350 | 6,198,309 | 5,104,000 | |||||||||||
|
|
|
|
|
|
|
|||||||||||
| 6,274,350 | 6,198,309 | 5,104,000 | ||||||||||||||
F-8
Table of Contents
TRIANGLE CAPITAL CORPORATION
Consolidated Schedule of Investments (Continued)
December 31, 2011
| Portfolio Company |
Industry |
Type of Investment(1)(2) |
Principal Amount |
Cost | Fair Value(3) |
|||||||||||
| Hatch Chile Co., LLC (2%)* |
Food Products Distributor | Senior Note (19% Cash, Due 07/15) |
$ | 4,500,000 | $ | 4,411,111 | $ | 4,411,111 | ||||||||
| Subordinated Note (14% Cash, Due 07/15) | 1,000,000 | 865,687 | 865,687 | |||||||||||||
| Unit Purchase Warrant (5,265 Units) | 149,800 | 216,000 | ||||||||||||||
|
|
|
|
|
|
|
|||||||||||
| 5,500,000 | 5,426,598 | 5,492,798 | ||||||||||||||
| Home Physicians, LLC (HP) and Home Physicians Holdings, LP (HPH) (3%)* |
In-home primary care physician services | Subordinated Note-HP (12% Cash, 5% PIK, Due 03/16) |
10,654,096 | 10,454,979 | 8,868,000 | |||||||||||
| Subordinated Note-HPH (4% Cash, 6% PIK, Due 03/16) | 1,283,791 | 1,283,791 | | |||||||||||||
| Royalty rights | | | ||||||||||||||
|
|
|
|
|
|
|
|||||||||||
| 11,937,887 | 11,738,770 | 8,868,000 | ||||||||||||||
| Infrastructure Corporation of America, Inc. (3%)* |
Roadway Maintenance, Repair and Engineering Services |
Subordinated Note (12% Cash, 1% PIK, Due 10/15) |
10,878,815 | 9,876,796 | 9,876,796 | |||||||||||
| Common Stock Purchase Warrant (199,526 shares) | 980,000 | 1,348,000 | ||||||||||||||
|
|
|
|
|
|
|
|||||||||||
| 10,878,815 | 10,856,796 | 11,224,796 | ||||||||||||||
| Inland Pipe Rehabilitation Holding Company LLC (7%)* |
Cleaning and Repair Services |
Subordinated Note (13% Cash, 2.5% PIK, Due 12/16) | 20,277,473 | 19,996,881 | 19,996,881 | |||||||||||
| Membership Interest Purchase Warrant (3.0%) | 853,500 | 2,112,000 | ||||||||||||||
|
|
|
|
|
|
|
|||||||||||
| 20,277,473 | 20,850,381 | 22,108,881 | ||||||||||||||
| Library Systems & Services, LLC (2%)* |
Municipal Business Services | Subordinated Note (12.5% Cash, 4.5% PIK, Due 06/15) | 5,250,001 | 5,130,053 | 5,130,053 | |||||||||||
| Common Stock Warrants (112 shares) | 58,995 | 723,000 | ||||||||||||||
|
|
|
|
|
|
|
|||||||||||
| 5,250,001 | 5,189,048 | 5,853,053 | ||||||||||||||
| Magpul Industries Corp. (4%) |
Firearm Accessories Manufacturer and Distributor | Subordinated Note (12% Cash, 3% PIK, Due 03/17) |
13,300,000 | 13,042,711 | 13,042,711 | |||||||||||
| Preferred Units (1,470 Units) | 1,470,000 | 1,470,000 | ||||||||||||||
| Common Units (30,000 Units) | 30,000 | 30,000 | ||||||||||||||
|
|
|
|
|
|
|
|||||||||||
| 13,300,000 | 14,542,711 | 14,542,711 | ||||||||||||||
| McKenzie Sports Products, LLC (2%)* |
Taxidermy Manufacturer | Subordinated Note (13% Cash, 1% PIK, Due 10/17) | 6,071,841 | 5,966,205 | 5,966,205 | |||||||||||
|
|
|
|
|
|
|
|||||||||||
| 6,071,841 | 5,966,205 | 5,966,205 | ||||||||||||||
| Media Storm, LLC (3%)* |
Marketing Services | Subordinated Note (12% Cash, 2% PIK, Due 10/17) | 8,532,111 | 8,449,580 | 8,449,580 | |||||||||||
| Membership Units (1,216,204 Units) | 1,216,204 | 1,216,204 | ||||||||||||||
|
|
|
|
|
|
|
|||||||||||
| 8,532,111 | 9,665,784 | 9,665,784 | ||||||||||||||
F-9
Table of Contents
TRIANGLE CAPITAL CORPORATION
Consolidated Schedule of Investments (Continued)
December 31, 2011
| Portfolio Company |
Industry |
Type of Investment(1)(2) |
Principal Amount |
Cost | Fair Value(3) |
|||||||||||
| Media Temple, Inc. (5%)* |
Web Hosting Services | Subordinated Note (12% Cash, 5.5% PIK, Due 04/15) | $ | 8,800,000 | $ | 8,658,463 | $ | 8,658,463 | ||||||||
| Convertible Note (8% Cash, 6% PIK, Due 04/15) | 3,200,000 | 2,778,030 | 4,687,000 | |||||||||||||
| Common Stock Purchase Warrant (28,000 Shares) | 536,000 | 2,051,000 | ||||||||||||||
|
|
|
|
|
|
|
|||||||||||
| 12,000,000 | 11,972,493 | 15,396,463 | ||||||||||||||
| Minco Technology Labs, LLC (2%)* |
Semiconductor Distribution | Subordinated Note (13% Cash, 3.25% PIK, Due 05/16) | 5,272,430 | 5,170,334 | 5,170,334 | |||||||||||
| Class A Units (5,000 Units) | 500,000 | 31,000 | ||||||||||||||
|
|
|
|
|
|
|
|||||||||||
| 5,272,430 | 5,670,334 | 5,201,334 | ||||||||||||||
| National Investment Managers Inc. (4%)* |
Retirement Plan Administrator | Subordinated Note (11% Cash, 5% PIK, Due 09/16) | 11,703,034 | 11,450,996 | 11,450,996 | |||||||||||
| Preferred A Units (90,000 Units) | 900,000 | 479,000 | ||||||||||||||
| Common Units (10,000 Units) | 100,000 | | ||||||||||||||
|
|
|
|
|
|
|
|||||||||||
| 11,703,034 | 12,450,996 | 11,929,996 | ||||||||||||||
| Novolyte Technologies, Inc. (4%)* |
Specialty Manufacturing | Subordinated Note (12% Cash, 4% PIK, Due 07/16) | 7,264,182 | 7,143,362 | 7,143,362 | |||||||||||
| Subordinated Note (12% Cash, 4% PIK, Due 07/16) | 2,334,916 | 2,296,081 | 2,296,081 | |||||||||||||
| Preferred Units (641 units) | 661,227 | 888,000 | ||||||||||||||
| Common Units (24,522 units) | 165,306 | 1,744,000 | ||||||||||||||
|
|
|
|
|
|
|
|||||||||||
| 9,599,098 | 10,265,976 | 12,071,443 | ||||||||||||||
| Pomeroy IT Solutions (3%)* |
Information Technology Outsourcing Services | Subordinated Notes (13% Cash, 2% PIK, Due 02/16) |
10,181,198 | 9,955,154 | 9,955,154 | |||||||||||
|
|
|
|
|
|
|
|||||||||||
| 10,181,198 | 9,955,154 | 9,955,154 | ||||||||||||||
| PowerDirect Marketing, LLC (2%)* |
Marketing Services | Subordinated Note (12% Cash, 2% PIK, Due 05/16) | 8,100,993 | 7,580,433 | 7,580,433 | |||||||||||
| Common Unit Purchase Warrants | 402,000 | 548,000 | ||||||||||||||
|
|
|
|
|
|
|
|||||||||||
| 8,100,993 | 7,982,433 | 8,128,433 | ||||||||||||||
| Renew Life Formulas, Inc. (4%)* |
Nutritional Supplement Manufacturing and Distribution | Subordinated Notes (12% Cash, 3% PIK, Due 03/15) |
13,401,006 | 13,155,235 | 13,155,235 | |||||||||||
|
|
|
|
|
|
|
|||||||||||
| 13,401,006 | 13,155,235 | 13,155,235 | ||||||||||||||
| Sheplers, Inc. (4%)* |
Western Apparel Retailer | Subordinated Note (13.15% Cash, Due 12/16) |
8,750,000 | 8,531,250 | 8,531,250 | |||||||||||
| Subordinated Note (10% Cash, 7% PIK, Due 12/17) | 3,758,021 | 3,683,021 | 3,683,021 | |||||||||||||
|
|
|
|
|
|
|
|||||||||||
| 12,508,021 | 12,214,271 | 12,214,271 | ||||||||||||||
F-10
Table of Contents
TRIANGLE CAPITAL CORPORATION
Consolidated Schedule of Investments (Continued)
December 31, 2011
| Portfolio Company |
Industry |
Type of Investment(1)(2) |
Principal Amount |
Cost | Fair Value(3) |
|||||||||||
| SRC, Inc. (3%)* |
Specialty Chemical Manufacturer | Subordinated Notes (12% Cash, 2% PIK, Due 09/14) | $ | 8,879,665 | $ | 8,640,013 | $ | 8,640,013 | ||||||||
| Common Stock Purchase Warrants | 123,800 | | ||||||||||||||
|
|
|
|
|
|
|
|||||||||||
| 8,879,665 | 8,763,813 | 8,640,013 | ||||||||||||||
| Syrgis Holdings, Inc. (1%)* |
Specialty Chemical Manufacturer | Senior Notes (7.75%-10.75% Cash, Due 08/12-02/14) | 2,444,766 | 2,437,942 | 2,437,942 | |||||||||||
| Class C Units (2,114 units) | 1,000,000 | 1,597,000 | ||||||||||||||
|
|
|
|
|
|
|
|||||||||||
| 2,444,766 | 3,437,942 | 4,034,942 | ||||||||||||||
| TBG Anesthesia Management, LLC (3%)* |
Physician Management Services | Senior Note (13.5% Cash, Due 11/14) |
10,750,000 | 10,445,062 | 10,445,062 | |||||||||||
| Warrant (263 shares) | 276,100 | 239,000 | ||||||||||||||
|
|
|
|
|
|
|
|||||||||||
| 10,750,000 | 10,721,162 | 10,684,062 | ||||||||||||||
| TMR Automotive Service Supply, LLC (2%) |
Automotive Supplies | Subordinated Note (12% Cash, 1% PIK, Due 03/16) |
5,000,000 | 4,738,933 | 4,738,933 | |||||||||||
| Unit Purchase Warrant (329,518 units) | 195,000 | 284,000 | ||||||||||||||
|
|
|
|
|
|
|
|||||||||||
| 5,000,000 | 4,933,933 | 5,022,933 | ||||||||||||||
| Top Knobs USA, Inc. (3%) |
Hardware Designer and Distributor | Subordinated Note (12% Cash, 4.5% PIK, Due 05/17) | 10,369,002 | 10,209,875 | 10,209,875 | |||||||||||
| Common Stock (26,593 shares) | 750,000 | 733,000 | ||||||||||||||
|
|
|
|
|
|
|
|||||||||||
| 10,369,002 | 10,959,875 | 10,942,875 | ||||||||||||||
| Trinity Consultants Holdings, Inc. (2%)* |
Air Quality Consulting Services | Subordinated Note (12% Cash, 2.5% PIK, Due 11/17) | 7,216,500 | 7,072,500 | 7,072,500 | |||||||||||
| Series A Preferred Stock (10,000 units) | 950,000 | 950,000 | ||||||||||||||
| Common Stock (55,556 units) | 50,000 | 50,000 | ||||||||||||||
|
|
|
|
|
|
|
|||||||||||
| 7,216,500 | 8,072,500 | 8,072,500 | ||||||||||||||
| TrustHouse Services Group, Inc. (4%)* |
Food Management Services | Subordinated Note (12% Cash, 2% PIK, Due 07/18) | 13,362,115 | 13,136,232 | 13,136,232 | |||||||||||
| Class A Units (1,557 units) | 512,124 | 799,000 | ||||||||||||||
| Class B Units (82 units) | 26,954 | 28,000 | ||||||||||||||
|
|
|
|
|
|
|
|||||||||||
| 13,362,115 | 13,675,310 | 13,963,232 | ||||||||||||||
| Tulsa Inspection Resources, Inc. (2%)* |
Pipeline Inspection Services | Subordinated Note (14%-17.5% Cash, Due 03/14) | 5,810,588 | 5,574,292 | 5,574,292 | |||||||||||
| Common Unit (1 unit) | 200,000 | 117,000 | ||||||||||||||
| Common Stock Warrants (8 shares) | 321,000 | 627,000 | ||||||||||||||
|
|
|
|
|
|
|
|||||||||||
| 5,810,588 | 6,095,292 | 6,318,292 | ||||||||||||||
| Twin-Star International, Inc. (2%)* |
Consumer Home Furnishings Manufacturer | Subordinated Note (12% Cash, 1% PIK, Due 04/14) |
4,500,000 | 4,476,065 | 4,476,065 | |||||||||||
| Senior Note (4.4%, Due 04/13) | 1,052,240 | 1,052,240 | 1,052,240 | |||||||||||||
|
|
|
|
|
|
|
|||||||||||
| 5,552,240 | 5,528,305 | 5,528,305 | ||||||||||||||
F-11
Table of Contents
TRIANGLE CAPITAL CORPORATION
Consolidated Schedule of Investments (Continued)
December 31, 2011
| Portfolio Company |
Industry |
Type of Investment(1)(2) |
Principal Amount |
Cost | Fair Value(3) |
|||||||||||
| Wholesale Floors, Inc. (1%)* |
Commercial Services | Subordinated Note (12.5% Cash, 3.5% PIK, Due 06/14) | $ | 3,858,183 | $ | 3,773,066 | $ | 3,773,066 | ||||||||
| Membership Interest Purchase Warrant (4.0%) | 132,800 | | ||||||||||||||
|
|
|
|
|
|
|
|||||||||||
| 3,858,183 | 3,905,866 | 3,773,066 | ||||||||||||||
| Workforce Software, LLC (2%)* |
Software Provider | Subordinated Note (11% Cash, 3% PIK, Due 11/16) | 7,000,000 | 6,065,200 | 6,065,200 | |||||||||||
| Class B Preferred Units (1,020,000 units) | 782,300 | 782,300 | ||||||||||||||
| Common Unit Purchase Warrants (2,224,561 units) | 1,020,000 | 1,020,000 | ||||||||||||||
|
|
|
|
|
|
|
|||||||||||
| 7,000,000 | 7,867,500 | 7,867,500 | ||||||||||||||
| Yellowstone Landscape Group, Inc. (4%)* |
Landscaping Services | Subordinated Note (12% Cash, 3% PIK, Due 04/14) | 12,816,222 | 12,678,077 | 12,678,077 | |||||||||||
|
|
|
|
|
|
|
|||||||||||
| 12,816,222 | 12,678,077 | 12,678,077 | ||||||||||||||
|
|
|
|
|
|
|
|||||||||||
| Subtotal Non Control / Non Affiliate Investments |
377,095,379 | 389,312,451 | 396,502,490 | |||||||||||||
| Affiliate Investments: |
||||||||||||||||
| American De-Rosa Lamparts, LLC and Hallmark Lighting (2%)* |
Wholesale and Distribution | Subordinated Note (10% PIK, Due 10/13) | 6,056,794 | 5,213,450 | 5,213,450 | |||||||||||
| Membership Units (6,516 Units) |
350,000 | | ||||||||||||||
|
|
|
|
|
|
|
|||||||||||
| 6,056,794 | 5,563,450 | 5,213,450 | ||||||||||||||
| AP Services, Inc. (2%)* |
Fluid Sealing Supplies and Services | Subordinated Note (12% Cash, 2% PIK, Due 09/15) | 4,351,545 | 4,258,465 | 4,258,465 | |||||||||||
| Class A Units (933 units) |
933,333 | 1,181,000 | ||||||||||||||
| Class B Units (496 units) |
| 80,000 | ||||||||||||||
|
|
|
|
|
|
|
|||||||||||
| 4,351,545 | 5,191,798 | 5,519,465 | ||||||||||||||
| Asset Point, LLC (2%)* |
Asset Management Software Provider | Senior Note (12% Cash, 5% PIK, Due 03/13) | 6,054,948 | 6,024,163 | 6,024,163 | |||||||||||
| Senior Note (12% Cash, 2% PIK, Due 07/15) | 617,572 | 617,572 | 518,000 | |||||||||||||
| Subordinated Note (7% Cash, Due 03/13) | 941,798 | 941,798 | 786,000 | |||||||||||||
| Membership Units (1,000,000 units) | 8,203 | 346,000 | ||||||||||||||
| Options to Purchase Membership Units (342,407 units) | 500,000 | 149,000 | ||||||||||||||
| Membership Unit Warrants (356,506 units) | | 2,000 | ||||||||||||||
|
|
|
|
|
|
|
|||||||||||
| 7,614,318 | 8,091,736 | 7,825,163 | ||||||||||||||
F-12
Table of Contents
TRIANGLE CAPITAL CORPORATION
Consolidated Schedule of Investments (Continued)
December 31, 2011
| Portfolio Company |
Industry |
Type of Investment(1)(2) |
Principal Amount |
Cost | Fair Value(3) |
|||||||||||
| Axxiom Manufacturing, Inc. (0%)* |
Industrial Equipment Manufacturer | Common Stock (136,400 shares) |
$ | 200,000 | $ | 1,140,000 | ||||||||||
| Common Stock Warrant (4,000 shares) | | 33,000 | ||||||||||||||
|
|
|
|
|
|||||||||||||
| 200,000 | 1,173,000 | |||||||||||||||
| Brantley Transportation, LLC (Brantley Transportation) and Pine Street Holdings, LLC (Pine Street) (4) (2%)* |
Oil and Gas Services | Subordinated Note Brantley Transportation (14% Cash, 5% PIK, Due 12/12) |
3,947,627 | 3,915,231 | 3,915,231 | |||||||||||
| Common Unit Warrants Brantley Transportation (4,560 common units) | 33,600 | 401,000 | ||||||||||||||
| Preferred Units Pine Street (200 units) | 200,000 | 757,000 | ||||||||||||||
| Common Unit Warrants Pine Street (2,220 units) | | 99,000 | ||||||||||||||
|
|
|
|
|
|
|
|||||||||||
| 3,947,627 | 4,148,831 | 5,172,231 | ||||||||||||||
| Captek Softgel International, Inc. (3%)* |
Nutraceutical Manufacturer | Subordinated Note (12% Cash, 4% PIK, Due 08/16) | 8,277,116 | 8,133,312 | 8,133,312 | |||||||||||
| Class A Units (80,000 units) | 800,000 | 1,292,000 | ||||||||||||||
|
|
|
|
|
|
|
|||||||||||
| 8,277,116 | 8,933,312 | 9,425,312 | ||||||||||||||
| Dyson Corporation (1%)* |
Custom Forging and Fastener Supplies |
Class A Units (1,000,000 units) |
1,000,000 | 3,836,000 | ||||||||||||
|
|
|
|
|
|||||||||||||
| 1,000,000 | 3,836,000 | |||||||||||||||
| Equisales, LLC (1%)* |
Energy Products and Services | Subordinated Note (13% Cash, 4% PIK, Due 04/12) | 3,125,336 | 3,116,853 | 3,045,000 | |||||||||||
| Class A Units (500,000 units) | 480,900 | 535,000 | ||||||||||||||
|
|
|
|
|
|
|
|||||||||||
| 3,125,336 | 3,597,753 | 3,580,000 | ||||||||||||||
| Fischbein Partners, LLC (3%)* |
Packaging and Materials Handling Equipment Manufacturer | Subordinated Note (12% Cash, 2% PIK, Due 10/16) |
6,756,525 | 6,636,697 | 6,636,697 | |||||||||||
| Class A Units (1,750,000 units) | 417,088 | 3,344,000 | ||||||||||||||
|
|
|
|
|
|
|
|||||||||||
| 6,756,525 | 7,053,785 | 9,980,697 | ||||||||||||||
| Main Street Gourmet, LLC (1%)* |
Baked Goods Provider | Subordinated Notes (12% Cash, 4.5% PIK, Due 10/16) | 4,135,501 | 4,063,598 | 4,063,598 | |||||||||||
| Jr. Subordinated Notes (8% Cash, 2% PIK, Due 04/17) | 1,014,963 | 996,975 | 716,000 | |||||||||||||
| Preferred Units (233 units) | 211,867 | | ||||||||||||||
| Common B Units (3,000 units) | 23,140 | | ||||||||||||||
| Common A Units (1,652 units) | 14,993 | | ||||||||||||||
|
|
|
|
|
|
|
|||||||||||
| 5,150,464 | 5,310,573 | 4,779,598 | ||||||||||||||
| Plantation Products, LLC (5%)* |
Seed Manufacturing | Subordinated Notes (13% Cash, 4.5% PIK, Due 06/16) | 15,203,916 | 14,889,867 | 14,889,867 | |||||||||||
| Preferred Units (1,127 units) | 1,127,000 | 1,221,000 | ||||||||||||||
| Common Units (92,000 units) | 23,000 | 142,000 | ||||||||||||||
|
|
|
|
|
|
|
|||||||||||
| 15,203,916 | 16,039,867 | 16,252,867 | ||||||||||||||
F-13
Table of Contents
TRIANGLE CAPITAL CORPORATION
Consolidated Schedule of Investments (Continued)
December 31, 2011
| Portfolio Company |
Industry |
Type of Investment(1)(2) |
Principal Amount |
Cost | Fair Value(3) |
|||||||||||
| QC Holdings, Inc. (0%)* |
Lab Testing Services | Common Stock (5,594 shares) | $ | 563,602 | $ | 393,000 | ||||||||||
|
|
|
|
|
|||||||||||||
| 563,602 | 393,000 | |||||||||||||||
| Technology Crops International (2%)* |
Supply Chain Management Services | Subordinated Note (12% Cash, 5% PIK, Due 03/15) | 5,610,350 | 5,543,617 | 5,543,617 | |||||||||||
| Common Units (50 Units) | 500,000 | 589,000 | ||||||||||||||
|
|
|
|
|
|
|
|||||||||||
| 5,610,350 | 6,043,617 | 6,132,617 | ||||||||||||||
| Venture Technology Groups, Inc. (2%)* |
Fluid and Gas Handling Products Distributor | Subordinated Note (12.5% Cash, 4% PIK, Due 09/16) |
5,444,612 | 5,341,062 | 5,341,062 | |||||||||||
| Class A Units (1,000,000 Units) | 1,000,000 | 530,000 | ||||||||||||||
|
|
|
|
|
|
|
|||||||||||
| 5,444,612 | 6,341,062 | 5,871,062 | ||||||||||||||
| Waste Recyclers Holdings, LLC (2%)* |
Environmental and Facilities Services | Class A Preferred Units (280 Units) |
2,251,100 | | ||||||||||||
| Class B Preferred Units (985,372 Units) | 3,304,218 | 4,310,000 | ||||||||||||||
| Class C Preferred Units (1,444,475 Units) | 1,499,531 | 1,752,000 | ||||||||||||||
| Common Unit Purchase Warrant (1,170,083 Units) | 748,900 | | ||||||||||||||
| Common Units (153,219 Units) | 180,783 | | ||||||||||||||
|
|
|
|
|
|||||||||||||
| 7,984,532 | 6,062,000 | |||||||||||||||
| Wythe Will Tzetzo, LLC (4%)* |
Confectionary Goods Distributor | Subordinated Notes (13% Cash, Due 10/16) |
10,357,475 | 9,885,836 | 9,885,836 | |||||||||||
| Series A Preferred Units (74,764 units) | 1,500,000 | 1,784,000 | ||||||||||||||
| Common Unit Purchase Warrants (25,065 units) |
301,510 | 380,000 | ||||||||||||||
|
|
|
|
|
|
|
|||||||||||
| 10,357,475 | 11,687,346 | 12,049,836 | ||||||||||||||
|
|
|
|
|
|
|
|||||||||||
| Subtotal Affiliate Investments |
81,896,078 | 97,751,264 | 103,266,298 | |||||||||||||
| Control Investments: |
||||||||||||||||
| FCL Graphics, Inc. (FCL) and FCL Holding SPV, LLC (SPV) (1%)* |
Commercial Printing Services | Senior Note FCL (5.0% Cash, Due 9/16) |
1,485,821 | 1,478,538 | 1,478,538 | |||||||||||
| Senior Note FCL (8.0% Cash, 2% PIK, Due 9/16) | 1,147,836 | 1,145,436 | 955,000 | |||||||||||||
| Senior Note SPV (2.5% Cash, 6% PIK, Due 9/16) | 950,328 | 950,328 | 343,000 | |||||||||||||
| Members Interests SPV (299,875 Units) | | | ||||||||||||||
|
|
|
|
|
|
|
|||||||||||
| 3,583,985 | 3,574,302 | 2,776,538 | ||||||||||||||
| Fire Sprinkler Systems, Inc. (0%)* |
Specialty Trade Contractors | Subordinated Notes (2% PIK, Due 04/12) | 3,281,284 | 2,780,028 | 443,000 | |||||||||||
| Common Stock (2,978 shares) | 294,624 | | ||||||||||||||
|
|
|
|
|
|
|
|||||||||||
| 3,281,284 | 3,074,652 | 443,000 | ||||||||||||||
F-14
Table of Contents
TRIANGLE CAPITAL CORPORATION
Consolidated Schedule of Investments (Continued)
December 31, 2011
| Portfolio Company |
Industry |
Type of Investment(1)(2) |
Principal Amount |
Cost | Fair Value(3) |
|||||||||||
| Fischbein, LLC (1%)* |
Packaging and Materials Handling Equipment Manufacturer | Class A-1 Common Units (501,984 units) | $ | 59,315 | $ | 283,816 | ||||||||||
| Class A Common Units (3,839,068 units) | 453,630 | 1,859,433 | ||||||||||||||
|
|
|
|
|
|||||||||||||
| 512,945 | 2,143,249 | |||||||||||||||
| Gerli & Company (1%)* |
Specialty Woven Fabrics Manufacturer | Subordinated Note (8.5% Cash, Due 03/15) | 3,198,299 | 3,000,000 | 1,947,000 | |||||||||||
| Class A Preferred Shares (1,211 shares) | 855,000 | | ||||||||||||||
| Class C Preferred Shares (744 shares) | | | ||||||||||||||
| Class E Preferred Shares (400 shares) | 161,440 | | ||||||||||||||
| Common Stock (300 shares) | 100,000 | | ||||||||||||||
|
|
|
|
|
|
|
|||||||||||
| 3,198,299 | 4,116,440 | 1,947,000 | ||||||||||||||
|
|
|
|
|
|
|
|||||||||||
| Subtotal Control Investments |
10,063,568 | 11,278,339 | 7,309,787 | |||||||||||||
|
|
|
|
|
|
|
|||||||||||
| Total Investments, December 31, 2011(152%)* |
$ | 469,055,025 | $ | 498,342,054 | $ | 507,078,575 | ||||||||||
|
|
|
|
|
|
|
|||||||||||
| * | Value as a percent of net assets |
| (1) | All debt investments are income producing. Common stock, preferred stock and all warrants are non income producing. |
| (2) | Disclosures of interest rates on notes include cash interest rates and payment in kind (PIK) interest rates. |
| (3) | All investments are restricted as to resale and were valued at fair value as determined in good faith by the Board of Directors. |
| (4) | Pine Street Holdings, LLC is the majority owner of Brantley Transportation, LLC and its sole business purpose is its ownership of Brantley Transportation, LLC. |
See accompanying notes.
F-15
Table of Contents
Consolidated Schedule of Investments
December 31, 2010
| Portfolio Company |
Industry |
Type of Investment(1)(2) |
Principal Amount |
Cost | Fair Value(3) |
|||||||||||
| Non Control / Non Affiliate Investments: |
||||||||||||||||
| Ambient Air Corporation (AA) and Peaden-Hobbs Mechanical, LLC (PHM) (3%)* |
Specialty Trade Contractors | Subordinated Note-AA (15% Cash, 3% PIK, Due 06/13) |
$ | 4,325,151 | $ | 4,287,109 | $ | 4,287,109 | ||||||||
| Common Stock-PHM (128,571 shares) | 128,571 | 68,500 | ||||||||||||||
| Common Stock Warrants-AA (455 shares) |
142,361 | 852,000 | ||||||||||||||
|
|
|
|
|
|
|
|||||||||||
| 4,325,151 | 4,558,041 | 5,207,609 | ||||||||||||||
| Anns House of Nuts, Inc. (5%)* |
Trail Mixes and Nut Producers |
Subordinated Note (12% Cash, 1% PIK, Due 11/17) | 7,009,722 | 6,603,828 | 6,603,828 | |||||||||||
| Preferred A Units (22,368 units) | 2,124,957 | 2,124,957 | ||||||||||||||
| Preferred B Units (10,380 units) | 986,059 | 986,059 | ||||||||||||||
| Common Units (190,935 units) | 150,000 | 150,000 | ||||||||||||||
| Common Stock Warrants (14,558 shares) | 14,558 | 14,558 | ||||||||||||||
|
|
|
|
|
|
|
|||||||||||
| 7,009,722 | 9,879,402 | 9,879,402 | ||||||||||||||
| Assurance Operations Corporation (0%)* |
Metal Fabrication | Common Stock (517 Shares) |
516,867 | 528,900 | ||||||||||||
|
|
|
|
|
|||||||||||||
| 516,867 | 528,900 | |||||||||||||||
| Botanical Laboratories, Inc. (5%)* |
Nutritional Supplement Manufacturing and Distribution | Senior Notes (14% Cash, Due 02/15) |
10,500,000 | 9,843,861 | 9,843,861 | |||||||||||
| Common Unit Warrants (998,680) | 474,600 | | ||||||||||||||
|
|
|
|
|
|
|
|||||||||||
| 10,500,000 | 10,318,461 | 9,843,861 | ||||||||||||||
| Capital Contractors, Inc. (5%)* |
Janitorial and Facilities Maintenance Services | Subordinated Notes (12% Cash, 2% PIK, Due 12/15) | 9,001,001 | 8,329,001 | 8,329,001 | |||||||||||
| Common Stock Warrants (20 shares) | 492,000 | 492,000 | ||||||||||||||
|
|
|
|
|
|
|
|||||||||||
| 9,001,001 | 8,821,001 | 8,821,001 | ||||||||||||||
| Carolina Beverage Group, LLC (8%)* |
Beverage Manufacturing and Packaging | Subordinated Note (12% Cash , 4% PIK, Due 02/16) | 12,865,233 | 12,622,521 | 12,622,521 | |||||||||||
| Class A Units (11,974 Units) | 1,077,615 | 1,077,615 | ||||||||||||||
| Class B Units (11,974 Units) | 119,735 | 119,735 | ||||||||||||||
|
|
|
|
|
|
|
|||||||||||
| 12,865,233 | 13,819,871 | 13,819,871 | ||||||||||||||
| CRS Reprocessing, LLC (8%)* |
Fluid Reprocessing Services | Subordinated Note (12% Cash, 2% PIK, Due 11/15) |
11,129,470 | 10,706,406 | 10,706,406 | |||||||||||
| Subordinated Note (10% Cash, 4% PIK, Due 11/15) |
3,403,211 | 3,052,570 | 3,052,570 | |||||||||||||
| Common Unit Warrant (340 Units) | 564,454 | 1,043,000 | ||||||||||||||
|
|
|
|
|
|
|
|||||||||||
| 14,532,681 | 14,323,430 | 14,801,976 | ||||||||||||||
F-16
Table of Contents
TRIANGLE CAPITAL CORPORATION
Consolidated Schedule of Investments (Continued)
December 31, 2010
| Portfolio Company |
Industry |
Type of Investment(1)(2) |
Principal Amount |
Cost | Fair Value(3) |
|||||||||||
| CV Holdings, LLC (6%)* |
Specialty Healthcare Products Manufacturer | Subordinated Note (12% Cash, 4% PIK, Due 09/13) | $ | 11,685,326 | $ | 11,042,011 | $ | 11,042,011 | ||||||||
| Royalty rights | 874,400 | 622,500 | ||||||||||||||
|
|
|
|
|
|
|
|||||||||||
| 11,685,326 | 11,916,411 | 11,664,511 | ||||||||||||||
| Electronic Systems Protection, Inc. (2%)* |
Power Protection Systems Manufacturing | Subordinated Note (12% Cash, 2% PIK, Due 12/15) | 3,183,802 | 3,162,604 | 3,162,604 | |||||||||||
| Senior Note (8.3% Cash, Due 01/14) | 835,261 | 835,261 | 835,261 | |||||||||||||
| Common Stock (570 shares) | 285,000 | 110,000 | ||||||||||||||
|
|
|
|
|
|
|
|||||||||||
| 4,019,063 | 4,282,865 | 4,107,865 | ||||||||||||||
| Energy Hardware Holdings, LLC (0%)* |
Machined Parts Distribution | Voting Units (4,833 units) |
4,833 | 414,100 | ||||||||||||
|
|
|
|
|
|||||||||||||
| 4,833 | 414,100 | |||||||||||||||
| Frozen Specialties, Inc. (4%)* |
Frozen Foods Manufacturer | Subordinated Note (13% Cash, 5% PIK, Due 07/14) |
8,060,481 | 7,945,904 | 7,945,904 | |||||||||||
|
|
|
|
|
|
|
|||||||||||
| 8,060,481 | 7,945,904 | 7,945,904 | ||||||||||||||
| Garden Fresh Restaurant Corp. (0%)* |
Restaurant | Membership Units (5,000 units) | 500,000 | 723,800 | ||||||||||||
|
|
|
|
|
|||||||||||||
| 500,000 | 723,800 | |||||||||||||||
| Gerli & Company (1%)* |
Specialty Woven Fabrics Manufacturer | Subordinated Note (0.69% PIK, Due 08/11) | 3,799,359 | 3,161,442 | 2,156,500 | |||||||||||
| Subordinated Note (6.25% Cash, 11.75% PIK, Due 08/11) | 137,233 | 120,000 | 120,000 | |||||||||||||
| Royalty rights | | 112,100 | ||||||||||||||
| Common Stock Warrants (56,559 shares) | 83,414 | | ||||||||||||||
|
|
|
|
|
|
|
|||||||||||
| 3,936,592 | 3,364,856 | 2,388,600 | ||||||||||||||
| Great Expressions Group Holdings, LLC (3%)* |
Dental Practice Management | Subordinated Note (12% Cash, 4% PIK, Due 08/15) | 4,561,311 | 4,498,589 | 4,498,589 | |||||||||||
| Class A Units (225 Units) | 450,000 | 678,400 | ||||||||||||||
|
|
|
|
|
|
|
|||||||||||
| 4,561,311 | 4,948,589 | 5,176,989 | ||||||||||||||
| Grindmaster-Cecilware Corp. (3%)* |
Food Services Equipment Manufacturer | Subordinated Note (12% Cash, 4.5% PIK, Due 04/16) |
5,995,035 | 5,900,500 | 5,900,500 | |||||||||||
|
|
|
|
|
|
|
|||||||||||
| 5,995,035 | 5,900,500 | 5,900,500 | ||||||||||||||
| Hatch Chile Co., LLC (3%)* |
Food Products Distributor | Senior Note (19% Cash, Due 07/15) |
4,500,000 | 4,394,652 | 4,394,652 | |||||||||||
| Subordinated Note (14% Cash, Due 07/15) | 1,000,000 | 837,779 | 837,779 | |||||||||||||
| Unit Purchase Warrant (5,265 Units) | 149,800 | 149,800 | ||||||||||||||
|
|
|
|
|
|
|
|||||||||||
| 5,500,000 | 5,382,231 | 5,382,231 | ||||||||||||||
| Infrastructure Corporation of America, Inc. (6%)* |
Roadway Maintenance, Repair and Engineering Services | Subordinated Note Due 10/15) |
10,769,120 | 9,566,843 | 9,566,843 | |||||||||||
| Common Stock Purchase Warrant (199,526 shares) | 980,000 | 980,000 | ||||||||||||||
|
|
|
|
|
|
|
|||||||||||
| 10,769,120 | 10,546,843 | 10,546,843 | ||||||||||||||
F-17
Table of Contents
TRIANGLE CAPITAL CORPORATION
Consolidated Schedule of Investments (Continued)
December 31, 2010
| Portfolio Company |
Industry |
Type of Investment(1)(2) |
Principal Amount |
Cost | Fair Value(3) |
|||||||||||
| Inland Pipe Rehabilitation Holding Company LLC (10%)* |
Cleaning and Repair Services | Subordinated Note (14% Cash, Due 01/14) | $ | 8,274,920 | $ | 7,621,285 | $ | 7,621,285 | ||||||||
| Subordinated Note (18% Cash, Due 01/14) | 3,905,108 | 3,861,073 | 3,861,073 | |||||||||||||
| Subordinated Note (15% Cash, Due 01/14) | 306,302 | 306,302 | 306,302 | |||||||||||||
| Subordinated Note (15.3% Cash, Due 01/14) | 3,500,000 | 3,465,000 | 3,465,000 | |||||||||||||
| Membership Interest Purchase Warrant (3.0%) | 853,500 | 2,982,600 | ||||||||||||||
|
|
|
|
|
|
|
|||||||||||
| 15,986,330 | 16,107,160 | 18,236,260 | ||||||||||||||
| Library Systems & Services, LLC (3%)* |
Municipal Business Services | Subordinated Note (12.5% Cash, 4.5% PIK, Due 06/15) | 5,250,000 | 5,104,255 | 5,104,255 | |||||||||||
| Common Stock Warrants (112 shares) | 58,995 | 535,000 | ||||||||||||||
|
|
|
|
|
|
|
|||||||||||
| 5,250,000 | 5,163,250 | 5,639,255 | ||||||||||||||
| McKenzie Sports Products, LLC (3%)* |
Taxidermy Manufacturer | Subordinated Note (13% Cash, 1% PIK, Due 10/17) | 6,010,667 | 5,893,359 | 5,893,359 | |||||||||||
|
|
|
|
|
|
|
|||||||||||
| 6,010,667 | 5,893,359 | 5,893,359 | ||||||||||||||
| Media Temple, Inc. (7%)* |
Web Hosting Services | Subordinated Note (12% Cash, 4% PIK, Due 04/15) | 8,800,000 | 8,624,776 | 8,624,776 | |||||||||||
| Convertible Note (8% Cash, 4% PIK, Due 04/15) | 3,200,000 | 2,668,581 | 2,668,581 | |||||||||||||
| Common Stock Purchase Warrant (28,000 Shares) | 536,000 | 536,000 | ||||||||||||||
|
|
|
|
|
|
|
|||||||||||
| 12,000,000 | 11,829,357 | 11,829,357 | ||||||||||||||
| Minco Technology Labs, LLC (3%)* |
Semiconductor Distribution | Subordinated Note (13% Cash, 3.25% PIK, Due 05/16) | 5,102,216 | 4,984,368 | 4,984,368 | |||||||||||
| Class A Units (5,000 Units) | 500,000 | 296,800 | ||||||||||||||
|
|
|
|
|
|
|
|||||||||||
| 5,102,216 | 5,484,368 | 5,281,168 | ||||||||||||||
| Novolyte Technologies, Inc. (5%)* |
Specialty Manufacturing | Subordinated Note (12% Cash, 5.5% PIK, Due 04/15) | 7,785,733 | 7,686,662 | 7,686,662 | |||||||||||
| Preferred Units (641 units) | 640,818 | 664,600 | ||||||||||||||
| Common Units (24,522 units) | 160,204 | 370,200 | ||||||||||||||
|
|
|
|
|
|
|
|||||||||||
| 7,785,733 | 8,487,684 | 8,721,462 | ||||||||||||||
| SRC, Inc. (5%)* |
Specialty Chemical Manufacturer | Subordinated Notes (12% Cash, 2% PIK, Due 09/14) | 9,001,000 | 8,697,200 | 8,697,200 | |||||||||||
| Common Stock Purchase Warrants | 123,800 | 123,800 | ||||||||||||||
|
|
|
|
|
|
|
|||||||||||
| 9,001,000 | 8,821,000 | 8,821,000 | ||||||||||||||
| Syrgis Holdings, Inc. (2%)* |
Specialty Chemical Manufacturer | Senior Notes (7.75%-10.75% Cash, Due 08/12-02/14) | 2,873,393 | 2,858,198 | 2,858,198 | |||||||||||
| Class C Units (2,114 units) | 1,000,000 | 962,200 | ||||||||||||||
|
|
|
|
|
|
|
|||||||||||
| 2,873,393 | 3,858,198 | 3,820,398 | ||||||||||||||
F-18
Table of Contents
TRIANGLE CAPITAL CORPORATION
Consolidated Schedule of Investments (Continued)
December 31, 2010
| Portfolio Company |
Industry |
Type of Investment(1)(2) |
Principal Amount |
Cost | Fair Value(3) |
|||||||||||
| TBG Anesthesia Management, LLC (6%)* |
Physician Management Services | Senior Note (13.5% Cash, Due 11/14) |
$ | 11,000,000 | $ | 10,612,766 | $ | 10,612,766 | ||||||||
| Warrant (263 shares) | 276,100 | 165,000 | ||||||||||||||
|
|
|
|
|
|
|
|||||||||||
| 11,000,000 | 10,888,866 | 10,777,766 | ||||||||||||||
| Top Knobs USA, Inc. (6%)* |
Hardware Designer and Distributor | Subordinated Note (12% Cash, 4.5% PIK, Due 05/17) | 9,910,331 | 9,713,331 | 9,713,331 | |||||||||||
| Common Stock (26,593 shares) | 750,000 | 750,000 | ||||||||||||||
|
|
|
|
|
|
|
|||||||||||
| 9,910,331 | 10,463,331 | 10,463,331 | ||||||||||||||
| TrustHouse Services Group, Inc. (3%)* |
Food Management Services | Subordinated Note (12% Cash, 2% PIK, Due 09/15) | 4,440,543 | 4,381,604 | 4,381,604 | |||||||||||
| Class A Units (1,495 units) | 475,000 | 492,900 | ||||||||||||||
| Class B Units (79 units) | 25,000 | | ||||||||||||||
|
|
|
|
|
|
|
|||||||||||
| 4,440,543 | 4,881,604 | 4,874,504 | ||||||||||||||
| Tulsa Inspection Resources, Inc. (3%)* |
Pipeline Inspection Services | Subordinated Note (14%-17.5% Cash, Due 03/14) | 5,810,588 | 5,490,797 | 5,490,797 | |||||||||||
| Common Unit (1 unit) | 200,000 | | ||||||||||||||
| Common Stock Warrants (8 shares) | 321,000 | | ||||||||||||||
|
|
|
|
|
|
|
|||||||||||
| 5,810,588 | 6,011,797 | 5,490,797 | ||||||||||||||
| Twin-Star International, Inc. (3%)* |
Consumer Home Furnishings Manufacturer | Subordinated Note (12% Cash, 1% PIK, Due 04/14) |
4,500,000 | 4,462,290 | 4,462,290 | |||||||||||
| Senior Note (4.53%, Due 04/13) | 1,088,962 | 1,088,962 | 1,088,962 | |||||||||||||
|
|
|
|
|
|
|
|||||||||||
| 5,588,962 | 5,551,252 | 5,551,252 | ||||||||||||||
| Wholesale Floors, Inc. (1%)* |
Commercial Services | Subordinated Note (12.5%Cash, 1.5% PIK, Due 06/14) | 3,739,639 | 3,387,525 | 2,632,100 | |||||||||||
| Membership Interest Purchase Warrant (4.0%) | 132,800 | | ||||||||||||||
|
|
|
|
|
|
|
|||||||||||
| 3,739,639 | 3,520,325 | 2,632,100 | ||||||||||||||
| Yellowstone Landscape Group, Inc. (7%)* |
Landscaping Services | Subordinated Note (12% Cash, 3% PIK, Due 04/14) | 12,438,838 | 12,250,147 | 12,250,147 | |||||||||||
|
|
|
|
|
|
|
|||||||||||
| 12,438,838 | 12,250,147 | 12,250,147 | ||||||||||||||
| Zoom Systems (4%)* |
Retail Kiosk Operator | Subordinated Note (12.5% Cash, 1.5% PIK, Due 12/14) | 8,125,222 | 7,956,025 | 7,956,025 | |||||||||||
| Royalty rights |
| | ||||||||||||||
|
|
|
|
|
|
|
|||||||||||
| 8,125,222 | 7,956,025 | 7,956,025 | ||||||||||||||
|
|
|
|
|
|
|
|||||||||||
| Subtotal Non Control / Non Affiliate Investments |
237,824,178 | 244,197,828 | 245,392,144 | |||||||||||||
F-19
Table of Contents
TRIANGLE CAPITAL CORPORATION
Consolidated Schedule of Investments (Continued)
December 31, 2010
| Portfolio Company |
Industry |
Type of Investment(1)(2) |
Principal Amount |
Cost | Fair Value(3) |
|||||||||||
| Affiliate Investments: |
||||||||||||||||
| American De-Rosa Lamparts, LLC and Hallmark Lighting (2%)* |
Wholesale and Distribution | Subordinated Note (5% PIK, Due 10/13) | $ | 5,475,141 | $ | 5,153,341 | $ | 3,985,700 | ||||||||
| Membership Units (6,516 Units) | 350,000 | | ||||||||||||||
|
|
|
|
|
|
|
|||||||||||
| 5,475,141 | 5,503,341 | 3,985,700 | ||||||||||||||
| AP Services, Inc. (4%)* |
Fluid Sealing Supplies and Services | Subordinated Note (12% Cash, 2% PIK, Due 09/15) |
5,834,877 | 5,723,194 | 5,723,194 | |||||||||||
| Class A Units (933 units) | 933,333 | 933,333 | ||||||||||||||
| Class B Units (496 units) | | | ||||||||||||||
|
|
|
|
|
|
|
|||||||||||
| 5,834,877 | 6,656,527 | 6,656,527 | ||||||||||||||
| Asset Point, LLC (3%)* |
Asset Management Software Provider | Senior Note (12% Cash, 5% PIK, Due 03/13) | 5,756,261 | 5,703,925 | 5,384,500 | |||||||||||
| Senior Note (12% Cash, 2% PIK, Due 07/15) | 605,185 | 605,185 | 478,100 | |||||||||||||
| Options to Purchase Membership Units (342,407 units) | 500,000 | | ||||||||||||||
| Membership Unit Warrants (356,506 units) | | | ||||||||||||||
|
|
|
|
|
|
|
|||||||||||
| 6,361,446 | 6,809,110 | 5,862,600 | ||||||||||||||
| Axxiom Manufacturing, Inc. (1%)* |
Industrial Equipment Manufacturer | Common Stock (136,400 shares) |
200,000 | 978,700 | ||||||||||||
| Common Stock Warrant (4,000 shares) | | 28,700 | ||||||||||||||
|
|
|
|
|
|||||||||||||
| 200,000 | 1,007,400 | |||||||||||||||
| Brantley Transportation, LLC (Brantley Transportation) and Pine Street Holdings, LLC (Pine Street)(4) (2%)* |
Oil and Gas Services | Subordinated Note Brantley Transportation (14% Cash, Due 12/12) |
|
3,800,000 |
|
3,738,821 | 3,546,600 | |||||||||
| Common Unit Warrants Brantley Transportation (4,560 common units) | 33,600 | | ||||||||||||||
| Preferred Units Pine Street (200 units) | 200,000 | | ||||||||||||||
| Common Unit Warrants Pine Street (2,220 units) | | | ||||||||||||||
|
|
|
|
|
|
|
|||||||||||
| 3,800,000 | 3,972,421 | 3,546,600 | ||||||||||||||
| Dyson Corporation (1%)* |
Custom Forging and Fastener Supplies | Class A Units (1,000,000 units) |
|
1,000,000
|
|
|
2,476,000
|
|
||||||||
|
|
|
|
|
|||||||||||||
| 1,000,000 | 2,476,000 | |||||||||||||||
| Equisales, LLC (4%)* |
Energy Products and Services | Subordinated Note (13% Cash, 4% PIK, Due 04/12) | 6,000,000 | 5,959,983 | 5,959,983 | |||||||||||
| Class A Units (500,000 units) | 480,900 | 569,300 | ||||||||||||||
|
|
|
|
|
|
|
|||||||||||
| 6,000,000 | 6,440,883 | 6,529,283 | ||||||||||||||
F-20
Table of Contents
TRIANGLE CAPITAL CORPORATION
Consolidated Schedule of Investments (Continued)
December 31, 2010
| Portfolio Company |
Industry |
Type of Investment(1)(2) |
Principal Amount |
Cost | Fair Value(3) |
|||||||||||
| Plantation Products, LLC (8%)* |
Seed Manufacturing | Subordinated Notes (13% Cash, 4.5% PIK, Due 06/16) | $ | 14,527,188 | $ | 14,164,688 | $ | 14,164,688 | ||||||||
| Preferred Units (1,127 units) | 1,127,000 | 1,127,000 | ||||||||||||||
| Common Units (92,000 units) | 23,000 | 23,000 | ||||||||||||||
|
|
|
|
|
|
|
|||||||||||
| 14,527,188 | 15,314,688 | 15,314,688 | ||||||||||||||
| QC Holdings, Inc.(0%)* |
Lab Testing Services | Common Stock (5,594 shares) | 563,602 | 505,500 | ||||||||||||
|
|
|
|
|
|||||||||||||
| 563,602 | 505,500 | |||||||||||||||
| Technology Crops International (3%)* |
Supply Chain Management Services | Subordinated Note (12% Cash, 5% PIK, Due 03/15) | 5,333,595 | 5,250,980 | 5,250,980 | |||||||||||
| Common Units (50 Units) | 500,000 | 612,200 | ||||||||||||||
|
|
|
|
|
|
|
|||||||||||
| 5,333,595 | 5,750,980 | 5,863,180 | ||||||||||||||
| Waste Recyclers Holdings, LLC (2%)* |
Environmental and Facilities Services | Class A Preferred Units (280 Units) | 2,251,100 | | ||||||||||||
| Class B Preferred Units (985,372 Units) | 3,304,218 | 2,384,100 | ||||||||||||||
| Class C Preferred Units (1,444,475 Units) | 1,499,531 | 1,530,300 | ||||||||||||||
| Common Unit Purchase Warrant (1,170,083 Units) | 748,900 | | ||||||||||||||
| Common Units (153,219 Units) | 180,783 | | ||||||||||||||
|
|
|
|
|
|||||||||||||
| 7,984,532 | 3,914,400 | |||||||||||||||
|
|
|
|
|
|
|
|||||||||||
| Subtotal Affiliate Investments |
47,332,247 | 60,196,084 | 55,661,878 | |||||||||||||
| Control Investments: |
||||||||||||||||
| FCL Graphics, Inc. (1%)* |
Commercial Printing Services | Senior Note (3.76% Cash, 2% PIK, Due 9/11) | 1,500,498 | 1,497,934 | 1,465,400 | |||||||||||
| Senior Note (7.79% Cash, 2% PIK, Due 9/11) | 2,045,228 | 2,041,167 | 1,081,100 | |||||||||||||
| 2nd Lien Note (2.79% Cash, 8% PIK, Due 12/11) | 3,470,254 | 2,996,287 | | |||||||||||||
| Preferred Shares (35,000 shares) | | | ||||||||||||||
| Common Shares (4,000 shares) |
| | ||||||||||||||
| Members Interests (3,839 Units) |
| | ||||||||||||||
|
|
|
|
|
|
|
|||||||||||
| 7,015,980 | 6,535,388 | 2,546,500 | ||||||||||||||
| Fire Sprinkler Systems, Inc. (0%)* |
Specialty Trade Contractors | Subordinated Notes (2% PIK, Due 04/11) |
3,065,981 | 2,626,072 | 750,000 | |||||||||||
| Common Stock (2,978 shares) |
294,624 | | ||||||||||||||
|
|
|
|
|
|
|
|||||||||||
| 3,065,981 | 2,920,696 | 750,000 | ||||||||||||||
F-21
Table of Contents
TRIANGLE CAPITAL CORPORATION
Consolidated Schedule of Investments (Continued)
December 31, 2010
| Portfolio Company |
Industry |
Type of Investment(1)(2) |
Principal Amount |
Cost | Fair Value(3) |
|||||||||||
| Fischbein, LLC (11%)* |
Packaging and Materials Handling Equipment Manufacturer | Subordinated Note (13% Cash, 5.5% PIK, Due 05/13) |
$ | 4,345,573 | $ | 4,268,333 | $ | 4,268,333 | ||||||||
| Class A-1 Common Units (558,140 units) | 558,140 | 2,200,600 | ||||||||||||||
| Class A Common Units (4,200,000 units) | 4,200,000 | 13,649,600 | ||||||||||||||
|
|
|
|
|
|
|
|||||||||||
| 4,345,573 | 9,026,473 | 20,118,533 | ||||||||||||||
| Weave Textiles, LLC (1%)* |
Specialty Woven Fabrics Manufacturer | Senior Note (12% PIK, Due 01/11) |
310,238 | 310,238 | 310,238 | |||||||||||
| Membership Units (425 units) | 855,000 | 1,211,300 | ||||||||||||||
|
|
|
|
|
|
|
|||||||||||
| 310,238 | 1,165,238 | 1,521,538 | ||||||||||||||
|
|
|
|
|
|
|
|||||||||||
| Subtotal Control Investments |
14,737,772 | 19,647,795 | 24,936,571 | |||||||||||||
|
|
|
|
|
|
|
|||||||||||
| Total Investments, |
$ | 299,894,197 | $ | 324,041,707 | $ | 325,990,593 | ||||||||||
|
|
|
|
|
|
|
|||||||||||
| * | Value as a percent of net assets |
| (1) | All debt investments are income producing. Common stock, preferred stock and all warrants are non income producing. |
| (2) | Disclosures of interest rates on subordinated notes include cash interest rates and payment in kind (PIK) interest rates. |
| (3) | All investments are restricted as to resale and were valued at fair value as determined in good faith by the Board of Directors. |
| (4) | Pine Street Holdings, LLC is the majority owner of Brantley Transportation, LLC and its sole business purpose is its ownership of Brantley Transportation, LLC. |
See accompanying notes.
F-22
Table of Contents
Triangle Capital Corporation
| 1. | Organization, Basis of Presentation and Summary of Significant Accounting Policies |
Organization
Triangle Capital Corporation (the Company) was incorporated on October 10, 2006 for the purposes of acquiring 100% of the equity interest in Triangle Mezzanine Fund LLLP (Triangle SBIC) and its general partner, Triangle Mezzanine LLC (TML), raising capital in an initial public offering, which was completed in February 2007 (the IPO) and thereafter operating as an internally managed Business Development Company (BDC) under the Investment Company Act of 1940 (the 1940 Act). On December 15, 2009, Triangle Mezzanine Fund II, LP (Triangle SBIC II) was organized as a limited partnership under the laws of the State of Delaware. Unless otherwise noted, the terms its or the Company refer to Triangle SBIC prior to the IPO and to Triangle Capital Corporation and its subsidiaries, including Triangle SBIC and Triangle SBIC II, after the IPO.
Triangle SBIC and Triangle SBIC II are specialty finance limited partnerships formed to make investments primarily in middle market companies located throughout the United States. On September 11, 2003, Triangle SBIC was licensed to operate as a Small Business Investment Company (SBIC) under the authority of the United States Small Business Administration (SBA). On May 26, 2010, Triangle SBIC II obtained its license to operate as an SBIC. As SBICs, both Triangle SBIC and Triangle SBIC II are subject to a variety of regulations concerning, among other things, the size and nature of the companies in which they may invest and the structure of those investments.
On February 21, 2007, concurrent with the closing of the IPO, the following formation transactions were consummated (the Formation Transactions):
| | The Company acquired 100% of the limited partnership interests in Triangle SBIC in exchange for approximately 1.9 million shares of the Companys common stock. Triangle SBIC became a wholly-owned subsidiary of the Company, retained its license under the authority of the SBA to operate as an SBIC and continues to hold its existing investments and make new investments with the proceeds of the IPO; and |
| | The Company acquired 100% of the equity interests in TML, and the management agreement between Triangle SBIC and Triangle Capital Partners, LLC was terminated. |
The IPO consisted of the sale of 4,770,000 shares of Common Stock at a price of $15 per share, resulting in net proceeds of approximately $64.7 million, after deducting offering costs totaling approximately $6.8 million. Upon completion of the IPO, the Company had 6,686,760 common shares outstanding.
As a result of completion of the IPO and formation transactions, Triangle SBIC became a 100% wholly-owned subsidiary of the Company. The General partner of Triangle SBIC is the New General Partner (which is wholly-owned by the Company) and the limited partners of Triangle SBIC are the Company (99.9%) and the New General Partner (0.1%).
The Company currently operates as a closedend, nondiversified investment company and has elected to be treated as a BDC under the 1940 Act. The Company is internally managed by its executive officers under the supervision of its Board of Directors. The Company does not pay management or advisory fees, but instead incurs the operating costs associated with employing executive management and investment and portfolio management professionals.
Basis of Presentation
The financial statements of the Company include the accounts of the Company and its wholly-owned subsidiaries, including Triangle SBIC and Triangle SBIC II. Neither Triangle SBIC nor Triangle SBIC II consolidates portfolio company investments. The effects of all intercompany transactions between the Company and its subsidiaries have been eliminated in consolidation.
F-23
Table of Contents
Triangle Capital Corporation
Notes to Financial Statements (Continued)
The accompanying financial statements have been prepared in accordance with accounting principles generally accepted in the United States (U.S. GAAP). The Formation Transactions discussed above involved an exchange of shares of the Companys common stock between companies under common control. In accordance with the guidance on exchanges of shares between entities under common control contained in Financial Accounting Standards Board (FASB) Accounting Standards Codification (ASC) Topic 805, Business Combinations (formerly Statement of Financial Accounting Standards (SFAS) No. 141, Business Combinations (SFAS 141), the Companys financial highlights for the year ended December 31, 2007 are presented as if the Formation Transactions had occurred as of January 1, 2007. The effects of all intercompany transactions between the Company and its subsidiaries have been eliminated in consolidation/combination. All financial data and information included in these financial statements have been presented on the basis described above.
Significant Accounting Policies
Use of Estimates
The preparation of financial statements in conformity with U.S. GAAP requires management to make estimates and assumptions that affect the amounts reported in the financial statements and accompanying notes. Actual results could differ from those estimates.
Valuation of Investments
The Company has established and documented processes and methodologies for determining the fair values of portfolio company investments on a recurring basis in accordance with FASB ASC Topic 820, Fair Value Measurements and Disclosures (ASC Topic 820). Under ASC Topic 820, a financial instruments categorization within the valuation hierarchy is based upon the lowest level of input that is significant to the fair value measurement. The three levels of valuation hierarchy established by ASC Topic 820 are defined as follows:
Level 1 inputs to the valuation methodology are quoted prices (unadjusted) for identical assets or liabilities in active markets.
Level 2 inputs to the valuation methodology include quoted prices for similar assets and liabilities in active markets, and inputs that are observable for the asset or liability, either directly or indirectly, for substantially the full term of the financial instrument.
Level 3 inputs to the valuation methodology are unobservable and significant to the fair value measurement.
The Companys investment portfolio is comprised of debt and equity instruments of privately held companies for which quoted prices falling within the categories of Level 1 and Level 2 inputs are not available. Therefore, the Company values all of its investments at fair value, as determined in good faith by the Board of Directors, using Level 3 inputs, as further described below. Due to the inherent uncertainty in the valuation process, the Board of Directors estimate of fair value may differ significantly from the values that would have been used had a ready market for the securities existed, and the differences could be material. In addition, changes in the market environment and other events that may occur over the life of the investments may cause the gains or losses ultimately realized on these investments to be different than the valuations currently assigned.
Debt and equity securities that are not publicly traded and for which a limited market does not exist are valued at fair value as determined in good faith by the Board of Directors. There is no single standard for determining fair value in good faith, as fair value depends upon circumstances of each individual case. In general, fair value is the amount that the Company might reasonably expect to receive upon the current sale of the security.
F-24
Table of Contents
Triangle Capital Corporation
Notes to Financial Statements (Continued)
Management evaluates the investments in portfolio companies using the most recent portfolio company financial statements and forecasts. Management also consults with the portfolio companys senior management to obtain further updates on the portfolio companys performance, including information such as industry trends, new product development and other operational issues.
In making the good faith determination of the value of debt securities, the Company starts with the cost basis of the security, which includes the amortized original issue discount, and payment in kind (PIK) interest, if any. The Company also uses a risk rating system to estimate the probability of default on the debt securities and the probability of loss if there is a default. The risk rating system covers both qualitative and quantitative aspects of the business and the securities held. In valuing debt securities, management utilizes an income approach model that considers factors including, but not limited to, (i) the portfolio investments current risk rating, (ii) the portfolio companys current trailing twelve months (TTM) results of operations as compared to the portfolio companys TTM results of operations as of the date the investment was made and the portfolio companys anticipated results for the next twelve months of operations, (iii) the portfolio companys current leverage as compared to its leverage as of the date the investment was made, (iv) publicly available information regarding current pricing and credit metrics for similar proposed and executed investment transactions of private companies and, (v) when management believes a relevant comparison exists, current pricing and credit metrics for similar proposed and executed investment transactions of publicly traded debt.
In valuing equity securities of private companies, the Company considers valuation methodologies consistent with industry practice, including but not limited to (i) valuation using a valuation model based on original transaction multiples and the portfolio companys recent financial performance, (ii) publicly available information regarding the valuation of the securities based on recent sales in comparable transactions of private companies and, (iii) when management believes there are comparable companies that are publicly traded, a review of these publicly traded companies and the market multiple of their equity securities.
Duff & Phelps, LLC (Duff & Phelps), an independent valuation firm, provides third party valuation consulting services to the Company which consist of certain limited procedures that the Company identified and requested Duff & Phelps to perform (hereinafter referred to as the procedures). The Company generally requests Duff & Phelps to perform the procedures on each portfolio company at least once in every calendar year and for new portfolio companies, at least once in the twelve-month period subsequent to the initial investment. In addition, the Company generally requests Duff & Phelps to perform the procedures on a portfolio company when there has been a significant change in the fair value of the investment. In certain instances, the Company may determine that it is not cost-effective, and as a result is not in the Companys stockholders best interest, to request Duff & Phelps to perform the procedures on one or more portfolio companies. Such instances include, but are not limited to, situations where the fair value of the Companys investment in the portfolio company is determined to be insignificant relative to the Companys total investment portfolio.
F-25
Table of Contents
Triangle Capital Corporation
Notes to Financial Statements (Continued)
The total number of investments and the percentage of the Companys portfolio that the Company asked Duff & Phelps to perform such procedures are summarized below by period:
| For the quarter ended: |
Total companies |
Percent of total investments at fair value(1) |
||||||
| March 31, 2009 |
7 | 26 | % | |||||
| June 30, 2009 |
6 | 20 | % | |||||
| September 30, 2009 |
7 | 24 | % | |||||
| December 31, 2009 |
8 | 40 | % | |||||
| March 31, 2010 |
7 | 25 | % | |||||
| June 30, 2010 |
8 | 29 | % | |||||
| September 30, 2010 |
8 | 26 | % | |||||
| December 31, 2010 |
9 | 29 | % | |||||
| March 31, 2011 |
11 | 34 | % | |||||
| June 30, 2011 |
13 | 26 | % | |||||
| September 30, 2011 |
11 | 31 | % | |||||
| December 31, 2011 |
12 | 22 | % | |||||
| (1) | Exclusive of the fair value of new investments made during the quarter |
Upon completion of the procedures, Duff & Phelps concluded that the fair value, as determined by the Board of Directors, of those investments subjected to the procedures appeared reasonable. The Board of Directors of Triangle Capital Corporation is ultimately and solely responsible for determining the fair value of the Companys investments in good faith.
Warrants
When originating a debt security, the Company will sometimes receive warrants or other equity related securities from the borrower. The Company determines the cost basis of the warrants or other equity related securities received based upon their respective fair values on the date of receipt in proportion to the total fair value of the debt and warrants or other equity related securities received. Any resulting difference between the face amount of the debt and its recorded fair value resulting from the assignment of value to the warrant or other equity instruments is treated as original issue discount and accreted into interest income over the life of the loan.
Realized Gain or Loss and Unrealized Appreciation or Depreciation of Portfolio Investments
Realized gains or losses are recorded upon the sale or liquidation of investments and are calculated as the difference between the net proceeds from the sale or liquidation, if any, and the cost basis of the investment using the specific identification method. Unrealized appreciation or depreciation reflects the difference between the fair value of the investments and the cost basis of the investments.
Investment Classification
In accordance with the provisions of the 1940 Act, the Company classifies investments by level of control. As defined in the 1940 Act, Control Investments are investments in those companies that the Company is deemed to Control. Affiliate Investments are investments in those companies that are Affiliated Companies of the Company, as defined in the 1940 Act, other than Control Investments. Non Control/Non Affiliate Investments are those that are neither Control Investments nor Affiliate Investments. Generally, under the 1940 Act, the Company is deemed to control a company in which it has invested if the Company owns
F-26
Table of Contents
Triangle Capital Corporation
Notes to Financial Statements (Continued)
more than 25.0% of the voting securities of such company or has greater than 50.0% representation on its board. The Company is deemed to be an affiliate of a company in which the Company has invested if it owns between 5.0% and 25.0% of the voting securities of such company.
Cash and Cash Equivalents
The Company considers all highly liquid investments with an original maturity of three months or less at the date of purchase to be cash equivalents.
Deferred Financing Fees
Costs incurred to issue long term debt are capitalized and are amortized over the term of the debt agreements using the effective interest method.
Depreciation
Furniture, fixtures and equipment are depreciated on a straight-line basis over an estimated useful life of five years. Software and computer equipment are depreciated over an estimated useful life of three years.
Investment Income
Interest income, adjusted for amortization of premium and accretion of original issue discount, is recorded on the accrual basis to the extent that such amounts are expected to be collected. Generally, when interest and/or principal payments on a loan become past due, or if the Company otherwise does not expect the borrower to be able to service its debt and other obligations, the Company will place the loan on non-accrual status and will generally cease recognizing interest income on that loan for financial reporting purposes, until all principal and interest has been brought current through payment or due to a restructuring such that the interest income is deemed to be collectible. The Company writes off any previously accrued and uncollected interest when it is determined that interest is no longer considered collectible. Dividend income is recorded on the ex dividend date.
Payment in Kind Interest
The Company currently holds, and expects to hold in the future, some loans in its portfolio that contain a payment in kind (PIK) interest provision. The PIK interest, computed at the contractual rate specified in each loan agreement, is added to the principal balance of the loan, rather than being paid to the Company in cash, and is recorded as interest income. Thus, the actual collection of PIK interest may be deferred until the time of debt principal repayment.
To maintain the Companys status as a Regulated Investment Company (RIC) for federal income tax purposes, PIK interest, which is a non-cash source of income, is included in the Companys taxable income and therefore affects the amount it is are required to pay to stockholders in the form of dividends, even though the Company has not yet collected the cash. Generally, when current cash interest and/or principal payments on a loan become past due, or if the Company otherwise does not expect the borrower to be able to service its debt and other obligations, the Company will place the loan on non-accrual status and will generally cease recognizing PIK interest income on that loan for financial reporting purposes until all principal and interest have been brought current through payment or due to a restructuring such that the interest income is deemed to be collectible. The Company writes off any accrued and uncollected PIK interest when it is determined that the PIK interest is no longer collectible.
F-27
Table of Contents
Triangle Capital Corporation
Notes to Financial Statements (Continued)
Fee Income
Loan origination, facility, commitment, consent and other advance fees received in connection with the loan agreements are recorded as deferred income and recognized as investment income over the term of the loan. Upon prepayment of a loan, any unamortized loan origination fees are recorded as interest income. In the general course of its business, the Company receives certain fees from portfolio companies, which are non-recurring in nature. Such fees include loan prepayment penalties, certain investment banking and structuring fees and loan waiver and amendment fees, and are recorded as investment income when received.
Income Taxes
The Company has elected for federal income tax purposes to be treated as a RIC under Subchapter M of the Internal Revenue Code of 1986, as amended (the Code). As a RIC, so long as certain minimum distribution, source-of-income and asset diversification requirements are met income taxes are generally required to be paid only on the portion of taxable income and gains that are not distributed (actually or constructively) and on certain built-in gains.
The company has certain wholly-owned taxable subsidiaries (the Taxable Subsidiaries), each of which holds one or more of its portfolio investments that are listed on the Consolidated Schedule of Investments. The Taxable Subsidiaries are consolidated for financial reporting purposes, such that the companys consolidated financial statements reflect the Companys investments in the portfolio companies owned by the Taxable Subsidiaries. The purpose of the Taxable Subsidiaries is to permit the Company to hold certain portfolio companies that are organized as limited liability companies (LLCs) (or other forms of pass through entities) while satisfying the RIC tax requirement that at least 90% of the RICs gross revenue for income tax purposes must consist of qualifying investment income. Absent the Taxable Subsidiaries, a proportionate amount of any gross income of an LLC (or other pass through entity) portfolio investment would flow through directly to the RIC. To the extent that such income did not consist of qualifying investment income, it could jeopardize the Companys ability to qualify as a RIC and therefore cause the Company to incur significant amounts of federal income taxes. When LLCs (or other pass-through entities) are owned by the Taxable Subsidiaries, their income is taxed to the Taxable Subsidiaries and does not flow through to the RIC, thereby helping the Company preserve its RIC status and resultant tax advantages. The Taxable Subsidiaries are not consolidated for income tax purposes and may generate income tax expense as a result of their ownership of the portfolio companies. This income tax expense is reflected in the Companys Statements of Operations.
Segments
The Company lends to and invests in customers in various industries. The Company separately evaluates the performance of each of its lending and investment relationships. However, because each of these loan and investment relationships has similar business and economic characteristics, they have been aggregated into a single lending and investment segment. All applicable segment disclosures are included in or can be derived from the Companys financial statements.
Concentration of Credit Risk
The Companys investees are generally lower middle market companies in a variety of industries. At both December 31, 2011 and 2010, there were no individual investments greater than 10% of the fair value of the Companys portfolio. Income, consisting of interest, dividends, fees, other investment income, and realization of gains or losses on equity interests, can fluctuate dramatically upon repayment of an investment or sale of an equity interest and in any given year can be highly concentrated among several investees.
F-28
Table of Contents
Triangle Capital Corporation
Notes to Financial Statements (Continued)
The Companys investments carry a number of risks including, but not limited to: 1) investing in lower middle market companies which have a limited operating history and financial resources; 2) investing in senior subordinated debt which ranks equal to or lower than debt held by other investors; 3) holding investments that are not publicly traded and are subject to legal and other restrictions on resale and other risks common to investing in below investment grade debt and equity instruments.
Public Offerings of Common Stock and Debt Securities
On April 23, 2009, the Company filed a prospectus supplement pursuant to which 1,200,000 shares of common stock were offered for sale at a price to the public of $10.75 per share. Pursuant to this offering, all shares were sold and delivered on April 27, 2009 resulting in net proceeds to the Company, after underwriting discounts and offering expenses, of approximately $11.7 million. On May 27, 2009, pursuant to the exercise of an overallotment option granted in connection with the offering, the underwriters involved purchased an additional 80,000 shares of the Companys common stock at the same public offering price, less underwriting discounts and commissions, resulting in net proceeds to the Company of approximately $0.8 million.
On August 7, 2009, the Company filed a prospectus supplement pursuant to which 1,300,000 shares of common stock were offered for sale at a price to the public of $10.42 per share. In addition, the underwriters involved were granted an overallotment option to purchase an additional 195,000 shares of the Companys common stock at the same public offering price. Pursuant to this offering, all shares (including the overallotment option shares) were sold and delivered on August 12, 2009 resulting in net proceeds to the Company, after underwriting discounts and offering expenses, of approximately $14.6 million.
On December 8, 2009, the Company filed a prospectus supplement pursuant to which 1,560,000 shares of common stock were offered for sale at a price to the public of $12.00 per share. In addition, the underwriters involved were granted an overallotment option to purchase an additional 234,000 shares of the Companys common stock at the same public offering price. Pursuant to this offering, all shares (including the overallotment option shares) were sold and delivered on December 11, 2009 resulting in net proceeds to the Company, after underwriting discounts and offering expenses, of approximately $20.2 million.
On September 21, 2010, the Company filed a prospectus supplement pursuant to which 2,400,000 shares of common stock were offered for sale at a price to the public of $15.80 per share. In addition, the underwriters involved were granted an overallotment option to purchase an additional 360,000 shares of the Companys common stock at the same public offering price. Pursuant to this offering, all shares (including the overallotment option shares) were sold and delivered on September 24, 2010 resulting in net proceeds to the Company, after underwriting discounts and offering expenses, of approximately $41.2 million.
On February 8, 2011, the Company filed a prospectus supplement pursuant to which 3,000,000 shares of common stock were offered for sale at a price to the public of $19.25 per share. In addition, the underwriters involved were granted an overallotment option to purchase an additional 450,000 shares of our common stock at the same public offering price. Pursuant to this offering, all shares (including the overallotment option shares) were sold and delivered on February 11, 2011 resulting in net proceeds to us, after underwriting discounts and offering expenses, of approximately $63.0 million.
On August 24, 2011, the Company filed a prospectus supplement pursuant to which 3,500,000 shares of common stock were offered for sale at a price to the public of $17.15 per share. In addition, the underwriters involved were granted an overallotment option to purchase an additional 525,000 shares of our common stock at the same public offering price. Pursuant to this offering, all shares (including the overallotment option shares) were sold and delivered on August 29, 2011 resulting in net proceeds to us, after underwriting discounts and offering expenses, of approximately $65.7 million.
F-29
Table of Contents
Triangle Capital Corporation
Notes to Financial Statements (Continued)
See Note 9 Subsequent Events for information on the Companys February 2012 public offering of common stock and the Companys March 2012 public offering of debt securities.
Dividends and Distributions
Dividends and distributions to common stockholders are approved by the Companys Board of Directors and the dividend payable is recorded on the ex-dividend date.
The Company has adopted a dividend reinvestment plan (DRIP) that provides for reinvestment of dividends on behalf of its stockholders, unless a stockholder elects to receive cash. As a result, when the Company declares a dividend, stockholders who have not opted out of the DRIP will have their dividends automatically reinvested in shares of the Companys common stock, rather than receiving cash dividends.
The table below summarizes the Companys dividends and distributions:
| Declared |
Record |
Payable |
Per Share Amount |
Amount paid in Cash |
DRIP | Total | ||||||||||||||
| May 9, 2007 |
May 31, 2007 | June 28, 2007 | 0.15 | 358,000 | 645,000 | 1,003,000 | ||||||||||||||
| August 8, 2007 |
August 30, 2007 | September 27, 2007 | 0.26 | 769,000 | 981,000 | 1,750,000 | ||||||||||||||
| November 7, 2007 |
November 29, 2007 | December 27, 2007 | 0.27 | 1,837,000 | | 1,837,000 | ||||||||||||||
| December 14, 2007 |
December 31, 2007 | January 28, 2008 | 0.30 | 2,041,000 | | 2,041,000 | ||||||||||||||
|
|
|
|
|
|
|
|
|
|||||||||||||
| Total 2007 dividends and distributions |
0.98 | 5,005,000 | 1,626,000 | 6,631,000 | ||||||||||||||||
| May 7, 2008 |
June 5, 2008 | June 26, 2008 | 0.31 | 2,144,000 | | 2,144,000 | ||||||||||||||
| July 21, 2008 |
August 14, 2008 | September 4, 2008 | 0.35 | 2,421,000 | | 2,421,000 | ||||||||||||||
| October 9, 2008 |
October 30, 2008 | November 20, 2008 | 0.38 | 2,629,000 | | 2,629,000 | ||||||||||||||
| December 7, 2008 |
December 23, 2008 | January 6, 2009 | 0.40 | 2,767,000 | | 2,767,000 | ||||||||||||||
|
|
|
|
|
|
|
|
|
|||||||||||||
| Total 2008 dividends and distributions |
1.44 | 9,961,000 | | 9,961,000 | ||||||||||||||||
| February 13, 2009 |
February 27, 2009 | March, 13, 2009 | 0.05 | 352,000 | | 352,000 | ||||||||||||||
| March 11, 2009 |
March 25, 2009 | April 8, 2009 | 0.40 | 2,817,000 | | 2,817,000 | ||||||||||||||
| June 16, 2009 |
July 9, 2009 | July 23, 2009 | 0.40 | 3,333,000 | | 3,333,000 | ||||||||||||||
| September 23, 2009 |
October 8, 2009 | October 22, 2009 | 0.41 | 3,030,000 | 1,000,000 | 4,030,000 | ||||||||||||||
| December 1, 2009 |
December 22, 2009 | January 5, 2010 | 0.41 | 3,583,000 | 1,215,000 | 4,798,000 | ||||||||||||||
|
|
|
|
|
|
|
|
|
|||||||||||||
| Total 2009 dividends and distributions |
1.67 | 13,115,000 | 2,215,000 | 15,330,000 | ||||||||||||||||
| March 11, 2010 |
March 25, 2010 | April 8, 2010 | 0.41 | 3,803,000 | 1,090,000 | 4,893,000 | ||||||||||||||
| June 1, 2010 |
June 15, 2010 | June 29, 2010 | 0.41 | 4,009,000 | 915,000 | 4,924,000 | ||||||||||||||
| August 25, 2010 |
September 8, 2010 | September 22, 2010 | 0.41 | 4,137,000 | 813,000 | 4,950,000 | ||||||||||||||
| December 01, 2010 |
December 15, 2010 | December 29, 2010 | 0.42 | 5,406,000 | 846,000 | 6,252,000 | ||||||||||||||
|
|
|
|
|
|
|
|
|
|||||||||||||
| Total 2010 dividends and distributions |
1.65 | 17,355,000 | 3,664,000 | 21,019,000 | ||||||||||||||||
| February 23, 2011 |
March 16, 2011 | March 30, 2011 | 0.42 | 6,679,000 | 1,094,000 | 7,773,000 | ||||||||||||||
| May 31, 2011 |
June 15, 2011 | June 29, 2011 | 0.44 | 7,156,000 | 1,015,000 | 8,171,000 | ||||||||||||||
| August 31, 2011 |
September 14, 2011 | September 28, 2011 | 0.44 | 8,993,000 | 973,000 | 9,966,000 | ||||||||||||||
| November 2, 2011 |
December 14, 2011 | December 28, 2011 | 0.47 | 9,543,000 | 1,133,000 | 10,676,000 | ||||||||||||||
|
|
|
|
|
|
|
|
|
|||||||||||||
| Total 2011 dividends and distributions |
1.77 | 32,371,000 | 4,215,000 | 36,586,000 | ||||||||||||||||
|
|
|
|
|
|
|
|
|
|||||||||||||
| Total dividends and distributions |
7.51 | 77,807,000 | 11,720,000 | 89,527,000 | ||||||||||||||||
|
|
|
|
|
|
|
|
|
|||||||||||||
F-30
Table of Contents
Triangle Capital Corporation
Notes to Financial Statements (Continued)
Per Share Amounts
Per share amounts included in the Statements of Operations are computed by dividing net investment income and net increase in net assets resulting from operations by the weighted average number of shares of common stock outstanding for the period. As the Company has no common stock equivalents outstanding, diluted per share amounts are the same as basic per share amounts. Net asset value per share is computed by dividing total net assets by the number of common shares outstanding as of the end of the period.
Recently Issued Accounting Standards
In April 2011, the FASB issued ASU No. 2011-02 A Creditors Determination of Whether a Restructuring is a Troubled Debt Restructuring, or ASU 2011-02. This standard amends previous guidance provided in Accounting Standards Codification 310-40 Receivables Troubled Debt Restructuring by Creditors and clarifies which loan modifications constitute troubled debt restructurings. It is intended to assist creditors in determining whether a modification of the terms of a receivable meets the criteria to be considered a troubled debt restructuring, both for purposes of recording an impairment loss and for disclosure of troubled debt restructurings. In evaluating whether a restructuring constitutes a troubled debt restructuring, a creditor must separately conclude that both of the following exist: (a) the restructuring constitutes a concession; and (b) the debtor is experiencing financial difficulties. ASU 2011-02 provides guidance to clarify whether the creditor has granted a concession and whether a debtor is experiencing financial difficulties. The new guidance is effective for interim and annual periods that began on or after June 15, 2011, and applies retrospectively to restructurings occurring on or after the beginning of the fiscal year of adoption. The adoption of ASU 2011-02 did not have a significant impact on our financial position or results of operations.
In May 2011, the FASB issued ASU No. 2011-04, Fair Value Measurements (Topic 820), Amendments to Achieve Common Fair Value Measurement and Disclosure Requirements in U.S. GAAP and IFRSs, or ASU 2011-04. ASU 2011-04 clarifies the application of existing fair value measurement and disclosure requirements, changes the application of some requirements for measuring fair value and requires additional disclosure for fair value measurements categorized in Level 3 of the fair value hierarchy. ASU 2011-04 is effective for interim and annual periods beginning after December 15, 2011. We will adopt this standard beginning on January 1, 2012. We are evaluating the impact, if any, that our adoption of this update may have on our financial position or results of operations. However, since this accounting standards update primarily requires expanded disclosure related to Category 3 financial assets and liabilities, we do not anticipate that the implementation of this standard will have a significant impact on our process for measuring fair values, our financial position or results of operations.
F-31
Table of Contents
Triangle Capital Corporation
Notes to Financial Statements (Continued)
| 2. | Investments |
Summaries of the composition of the Companys investment portfolio at cost and fair value as a percentage of total investments are shown in the following tables:
| Cost | Percentage of Total Portfolio |
Fair Value | Percentage of Total Portfolio |
|||||||||||||
| December 31, 2011: |
||||||||||||||||
| Subordinated debt and 2nd lien notes |
$ | 393,830,719 | 79 | % | $ | 387,169,056 | 76 | % | ||||||||
| Senior debt and 1st lien notes |
60,622,827 | 12 | 59,974,195 | 12 | ||||||||||||
| Equity shares |
34,741,728 | 7 | 43,972,024 | 9 | ||||||||||||
| Equity warrants |
8,272,380 | 2 | 15,043,300 | 3 | ||||||||||||
| Royalty rights |
874,400 | | 920,000 | | ||||||||||||
|
|
|
|
|
|
|
|
|
|||||||||
| $ | 498,342,054 | 100 | % | $ | 507,078,575 | 100 | % | |||||||||
|
|
|
|
|
|
|
|
|
|||||||||
| December 31, 2010: |
||||||||||||||||
| Subordinated debt and 2nd lien notes |
$ | 242,169,361 | 75 | % | $ | 234,049,688 | 72 | % | ||||||||
| Senior debt and 1st lien notes |
45,896,174 | 14 | 44,584,148 | 14 | ||||||||||||
| Equity shares |
29,115,890 | 9 | 38,719,699 | 12 | ||||||||||||
| Equity warrants |
5,985,882 | 2 | 7,902,458 | 2 | ||||||||||||
| Royalty rights |
874,400 | | 734,600 | | ||||||||||||
|
|
|
|
|
|
|
|
|
|||||||||
| $ | 324,041,707 | 100 | % | $ | 325,990,593 | 100 | % | |||||||||
|
|
|
|
|
|
|
|
|
|||||||||
During the year ended December 31, 2011, the Company made twenty-one new investments, including recapitalizations of existing portfolio companies, totaling $200.2 million, seven additional debt investments in existing portfolio companies of $24.3 million and five additional equity investments in existing portfolio companies totaling approximately $0.5 million. During the year ended December 31, 2010, the Company made seventeen new investments, including recapitalizations in existing portfolio companies, totaling $145.9 million, nine additional debt investments in existing portfolio companies of $27.1 million and five additional equity investments in existing portfolio companies totaling approximately $0.6 million. During the year ended December 31, 2009, the Company made seven new investments totaling $43.0 million, additional debt investments in three existing portfolio companies totaling $4.1 million and five additional equity investments in existing portfolio companies totaling approximately $1.4 million.
The following table presents the Companys financial instruments carried at fair value as of December 31, 2011 and 2010, on the consolidated balance sheet by ASC Topic 820 valuation hierarchy, as previously described:
| Fair Value at December 31, 2011 | ||||||||||||||||
| Level 1 | Level 2 | Level 3 | Total | |||||||||||||
| Portfolio company investments |
$ | | $ | | $ | 507,078,575 | $ | 507,078,575 | ||||||||
|
|
|
|
|
|
|
|
|
|||||||||
| $ | | $ | | $ | 507,078,575 | $ | 507,078,575 | |||||||||
|
|
|
|
|
|
|
|
|
|||||||||
| Fair Value at December 31, 2010 | ||||||||||||||||
| Level 1 | Level 2 | Level 3 | Total | |||||||||||||
| Portfolio company investments |
$ | | $ | | $ | 325,990,593 | $ | 325,990,593 | ||||||||
|
|
|
|
|
|
|
|
|
|||||||||
| $ | | $ | | $ | 325,990,593 | $ | 325,990,593 | |||||||||
|
|
|
|
|
|
|
|
|
|||||||||
F-32
Table of Contents
Triangle Capital Corporation
Notes to Financial Statements (Continued)
The following table reconciles the beginning and ending balances of the Companys portfolio company investments measured at fair value on a recurring basis using significant unobservable inputs (Level 3) for the years ended December 31, 2011 and 2010:
| Years Ended December 31, | ||||||||
| 2011 | 2010 | |||||||
| Fair value of portfolio, beginning of period |
$ | 325,990,593 | $ | 201,317,970 | ||||
| New investments |
224,996,843 | 173,581,930 | ||||||
| Proceeds from sales of investments |
(17,827,252 | ) | (5,433,709 | ) | ||||
| Loan origination fees received |
(4,364,689 | ) | (3,351,568 | ) | ||||
| Principal repayments received |
(48,517,940 | ) | (49,481,126 | ) | ||||
| Payment in kind interest earned |
10,753,607 | 5,979,858 | ||||||
| Payment in kind interest payments received |
(4,643,113 | ) | (3,710,551 | ) | ||||
| Accretion of loan discounts |
1,178,229 | 701,268 | ||||||
| Accretion of deferred loan origination revenue |
1,751,182 | 1,268,839 | ||||||
| Realized gain (loss) on investments |
10,973,487 | (5,454,327 | ) | |||||
| Unrealized gain (loss) on investments |
6,787,628 | 10,572,009 | ||||||
|
|
|
|
|
|||||
| Fair value of portfolio, end of period |
$ | 507,078,575 | $ | 325,990,593 | ||||
|
|
|
|
|
|||||
All realized and unrealized gains and losses are included in earnings (changes in net assets) and are reported on separate line items within the Companys statements of operations. Pre-tax net unrealized gains on investments of $12.6 million during the year ended December 31, 2011 are related to portfolio company investments that are still held by the Company as of December 31, 2011. Pre-tax net unrealized gains on investments of $9.2 million during the year ended December 31, 2010 are related to portfolio company investments that are still held by the Company as of December 31, 2010.
| 3. | Long Term Debt |
The Company had the following borrowings outstanding as of December 31, 2011 and December 31, 2010:
| Issuance/Pooling Date |
Maturity Date |
Prioritized Return (Interest) Rate |
December 31, 2011 |
December 31, 2010 |
||||||||
| SBA Debentures: |
||||||||||||
| September 28, 2005 |
September 1, 2015 | 5.796% | $ | | $ | 9,500,000 | ||||||
| March 28, 2007 |
March 1, 2017 | 6.231% | 4,000,000 | 4,000,000 | ||||||||
| March 26, 2008 |
March 1, 2018 | 6.214% | 6,410,000 | 6,410,000 | ||||||||
| September 24, 2008 |
September 1, 2018 | 6.455% | 50,900,000 | 50,900,000 | ||||||||
| March 25, 2009 |
March 1, 2019 | 5.337% | 22,000,000 | 22,000,000 | ||||||||
| March 24, 2010 |
March 1, 2020 | 4.825% | 6,800,000 | 6,800,000 | ||||||||
| September 22, 2010 |
September 1, 2020 | 3.687% | 32,590,000 | 32,590,000 | ||||||||
| March 29, 2011 |
March 1, 2021 | 4.474% | 75,400,000 | 63,400,000 | ||||||||
| September 21, 2011 |
September 1, 2021 | 3.392% | 19,100,000 | | ||||||||
| SBA LMI Debentures: |
||||||||||||
| September 14, 2010 |
March 1, 2016 | 2.508% | 7,037,504 | 6,864,866 | ||||||||
| Credit Facility: |
||||||||||||
| May 9, 2011 |
May 8, 2014 | Variable | 15,000,000 | | ||||||||
|
|
|
|
|
|||||||||
| $ | 239,237,504 | $ | 202,464,866 | |||||||||
|
|
|
|
|
|||||||||
F-33
Table of Contents
Triangle Capital Corporation
Notes to Financial Statements (Continued)
SBA and SBA LMI Debentures
Interest payments on SBA debentures are payable semiannually and there are no principal payments required on these debentures prior to maturity, nor do the debentures carry any prepayment penalties. The Companys SBA Low or Moderate Income (LMI) debentures are five-year deferred interest debentures that are issued at a discount to par. The accretion of discount on SBA LMI debentures is classified as interest expense in the Companys consolidated financial statements.
Under the Small Business Investment Act and current SBA policy applicable to SBICs, an SBIC (or group of SBICs under common control) can have outstanding at any time, SBA-guaranteed debentures up to two times (and in certain cases, up to three times) the amount of its regulatory capital. As of December 31, 2011, the maximum statutory limit on the dollar amount of outstanding SBA-guaranteed debentures that can be issued by a single SBIC is $150.0 million and by a group of SBICs under common control is $225.0 million. As of December 31, 2011, Triangle SBIC has issued the maximum $150.0 million of SBA- guaranteed debentures and Triangle SBIC II has issued the maximum $75.0 million in face amount of SBA-guaranteed debentures. In addition to a onetime 1.0% fee on the total commitment from the SBA, the Company also pays a onetime 2.425% fee on the amount of each SBA debenture issued and a one-time 2.0% fee on the amount of each SBA LMI debenture issued. These fees are capitalized as deferred financing costs and are amortized over the term of the debt agreements using the effective interest method. The weighted average interest rates for all SBA-guaranteed debentures as of December 31, 2011 and 2010 were 4.83% and 3.95%, respectively. As of December 31, 2011, all SBA debentures have been pooled. The weighted average interest rate as of December 31, 2010 included $139.1 million of pooled SBA-guaranteed debentures with a weighted average fixed interest rate of 5.29% and $63.4 million of unpooled SBA-guaranteed debentures with a weighted average interim interest rate of 1.00%.
Credit Facility
In May 2011, the Company entered into a three-year senior secured credit facility with an initial commitment of $50.0 million (the Credit Facility). In November 2011, we closed an expansion of the Credit Facility, which included the addition of one new lender, from $50.0 million to $75.0 million. The purpose of the Credit Facility is to provide additional liquidity in support of future investment and operational activities. The Credit Facility was arranged by BB&T Capital Markets and Fifth Third Bank and has an accordion feature which allows for an increase in the total loan size up to $90.0 million and also contains two one-year extension options, bringing the total potential commitment and funding period to five years from closing. The Credit Facility, which is structured to operate like a revolving credit facility, is secured primarily by Triangle Capital Corporations assets, excluding the assets of Triangle SBIC and Triangle SBIC II.
Borrowings under the Credit Facility bear interest, subject to the Companys election, on a per annum basis equal to (i) the applicable base rate plus 1.95% or ii) the applicable LIBOR rate plus 2.95%. The applicable base rate is equal to the greater of i) prime rate, ii) the federal funds rate plus 0.5% or iii) the adjusted one-month LIBOR plus 2.0%. The Company pays unused commitment fees of 0.375% per annum, which are included with Interest and other credit facility fees on the Companys Consolidated Statement of Operations. As of December 31, 2011, the Company had $15.0 million in borrowings outstanding under the Credit Facility with an interest rate of 5.2%.
The Credit Facility contains certain affirmative and negative covenants, including but not limited to i) maintaining a minimum interest coverage ratio, ii) maintaining a minimum liquidity ratio and iii) maintaining minimum consolidated tangible net worth. As of December 31, 2011, the Company was in compliance with all covenants of the Credit Facility.
F-34
Table of Contents
Triangle Capital Corporation
Notes to Financial Statements (Continued)
| 4. | Income Taxes |
The Company has elected to be treated as a RIC under Subchapter M of the Internal Revenue Code of 1986, as amended (the Code), and intends to make the required distributions to its stockholders as specified therein. In order to qualify as a RIC, the Company must meet certain minimum distribution, source-of-income and asset diversification requirements. If such requirements are met, then the Company is generally required to pay income taxes only on the portion of its taxable income and gains it does not distribute (actually or constructively) and certain built-in gains. The Company met its minimum distribution requirements for 2011, 2010 and 2009 and continually monitors its distribution requirements with the goal of ensuring compliance with the Code.
The minimum distribution requirements applicable to RICs require the Company to distribute to its stockholders at least 90% of its investment company taxable income (ICTI), as defined by the Code, each year. Depending on the level of ICTI earned in a tax year, the Company may choose to carry forward ICTI in excess of current year distributions into the next tax year and pay a 4% excise tax on such excess. Any such carryover ICTI must be distributed before the end of that next tax year through a dividend declared prior to filing the final tax return related to the year which generated such ICTI.
ICTI generally differs from net investment income for financial reporting purposes due to temporary and permanent differences in the recognition of income and expenses. The Company may be required to recognize ICTI in certain circumstances in which it does not receive cash. For example, if the Company holds debt obligations that are treated under applicable tax rules as having original issue discount (such as debt instruments issued with warrants), the Company must include in ICTI each year a portion of the original issue discount that accrues over the life of the obligation, regardless of whether cash representing such income is received by the Company in the same taxable year. The Company may also have to include in ICTI other amounts that it has not yet received in cash, such as i) PIK interest income and ii) interest income from investments that have been classified as non-accrual for financial reporting purposes. Interest income on non-accrual investments is not recognized for financial reporting purposes, but generally is recognized in ICTI. Because any original issue discount or other amounts accrued will be included in the Companys ICTI for the year of accrual, the Company may be required to make a distribution to its stockholders in order to satisfy the minimum distribution requirements, even though the Company will not have received and may not ever receive any corresponding cash amount. ICTI also excludes net unrealized appreciation or depreciation, as investment gains or losses are not included in taxable income until they are realized.
Permanent differences between ICTI and net investment income for financial reporting purposes are reclassified among capital accounts in the financial statements to reflect their tax character. Differences in classification may also result from the treatment of short-term gains as ordinary income for tax purposes. During the years ended December 31, 2011, 2010 and 2009, the Company reclassified for book purposes amounts arising from permanent book/tax differences primarily related to differences in the tax basis and book basis of investments sold and non-deductible taxes paid during the year as follows:
| Years Ended December 31, | ||||||||||||
| 2011 | 2010 | 2009 | ||||||||||
| Additional paid-in capital |
$ | 584,146 | $ | (171,918 | ) | $ | (29,996 | ) | ||||
| Investment income in excess of distributions |
$ | 638,083 | $ | 3,385,585 | $ | 34,125 | ||||||
| Accumulated realized gains on investments |
$ | (1,222,229 | ) | $ | (3,213,667 | ) | $ | (4,129 | ) | |||
In addition, the Company has certain wholly-owned taxable subsidiaries (the Taxable Subsidiaries), each of which holds one or more of its portfolio investments that are listed on the Consolidated Schedule of Investments. The Taxable Subsidiaries are consolidated for financial reporting purposes, such that the Companys consolidated
F-35
Table of Contents
Triangle Capital Corporation
Notes to Financial Statements (Continued)
financial statements reflect the Companys investments in the portfolio companies owned by the Taxable Subsidiaries. The purpose of the Taxable Subsidiaries is to permit the Company to hold certain portfolio companies that are organized as limited liability companies (LLCs) (or other forms of pass-through entities) and still satisfy the RIC tax requirement that at least 90% of the RICs gross revenue for income tax purposes must consist of investment income. Absent the Taxable Subsidiaries, a proportionate amount of any gross income of an LLC (or other pass-through entity) portfolio investment would flow through directly to the RIC. To the extent that such income did not consist of investment income, it could jeopardize the Companys ability to qualify as a RIC and therefore cause the Company to incur significant amounts of federal income taxes. When LLCs (or other pass-through entities) are owned by the Taxable Subsidiaries, their income is taxed to the Taxable Subsidiaries and does not flow through to the RIC, thereby helping the Company preserve its RIC status and resultant tax advantages. The Taxable Subsidiaries are not consolidated for income tax purposes and may generate income tax expense as a result of their ownership of the portfolio companies. This income tax expense is reflected in the Companys Statements of Operations.
For income tax purposes, distributions paid to stockholders are reported as ordinary income, long term capital gains, return of capital or a combination thereof. The tax character of distributions paid for the years ended December 31, 2011, 2010 and 2009 was as follows:
| For the Year Ended December 31, | ||||||||||||
| 2011 | 2010 | 2009 | ||||||||||
| Ordinary income |
$ | 35,954,170 | $ | 20,078,591 | $ | 14,614,821 | ||||||
| Distributions of long-term capital gains |
| 448,164 | 356,495 | |||||||||
|
|
|
|
|
|
|
|||||||
| Distributions on a tax basis |
$ | 35,954,170 | $ | 20,526,755 | $ | 14,971,316 | ||||||
|
|
|
|
|
|
|
|||||||
During the year ended December 31, 2011, the Company utilized net capital loss carryforwards of $8,244,376.
The Company intends to retain some or all of our realized net long-term capital gains in excess of realized net short-term capital losses, but to generally designate the retained net capital gain as a deemed distribution. In that case, among other consequences, the Company will pay tax on the retained amount, each U.S. stockholder will be required to include his, her or its share of the deemed distribution in income as if it had been actually distributed to the U.S. stockholder, and the U.S. stockholder will be entitled to claim a credit equal to his, her or its allocable share of the tax paid thereon by us. For the year ended December 31, 2011, the Company elected to designate retained net capital gains of $1,414,949, or approximately $0.06 per share, as a deemed distribution, which will be allocated to stockholders of record as of December 31, 2011. The Company paid U.S. federal income taxes of $495,233, or approximately $0.02 per share, related to the retained capital gains.
At December 31, 2011, 2010 and 2009, the components of distributable earnings on a tax basis detailed below differ from the amounts reflected in the Companys Statement of Assets and Liabilities by temporary and other book/tax differences, primarily relating to depreciation expense, stock-based compensation, accruals of defaulted debt investment interest and the tax treatment of certain partnership investments, as follows:
| As of December 31, | ||||||||||||
| 2011 | 2010 | 2009 | ||||||||||
| Undistributed net investment income |
$ | 8,041,850 | $ | 4,007,334 | $ | 1,344,215 | ||||||
| Accumulated capital (loss) gains |
| (8,244,376 | ) | 448,164 | ||||||||
| Other permanent differences relating to the Companys formation |
1,975,543 | 1,975,543 | 1,975,543 | |||||||||
| Other temporary differences |
(840,620 | ) | (892,961 | ) | (1,001,062 | ) | ||||||
| Unrealized appreciation (depreciation) |
6,790,138 | 15,935 | (10,448,630 | ) | ||||||||
|
|
|
|
|
|
|
|||||||
| Components of distributable earnings at year end |
$ | 15,966,911 | $ | (3,138,525 | ) | $ | (7,681,770 | ) | ||||
|
|
|
|
|
|
|
|||||||
F-36
Table of Contents
Triangle Capital Corporation
Notes to Financial Statements (Continued)
For federal income tax purposes, the cost of investments owned at December 31, 2011 and 2010 was approximately $500.7 million and $325.8 million, respectively.
| 5. | Equity Compensation Plan |
The Companys Board of Directors and stockholders have approved the Triangle Capital Corporation Amended and Restated 2007 Equity Incentive Plan (the Plan), under which there are 900,000 shares of the Companys Common Stock authorized for issuance. Under the Plan, the Board (or compensation committee, if delegated administrative authority by the Board) may award stock options, restricted stock or other stock based incentive awards to executive officers, employees and directors. Equity-based awards granted under the Plan to independent directors generally will vest over a one-year period and equity-based awards granted under the Plan to executive officers and employees generally will vest ratably over a four-year period.
The Company accounts for its equity-based compensation plan using the fair value method, as prescribed by ASC Topic 718, Stock Compensation. Accordingly, for restricted stock awards, the Company measures the grant date fair value based upon the market price of the Companys common stock on the date of the grant and amortizes this fair value to compensation expense over the requisite service period or vesting term.
The following table presents information with respect to the Plan for the years ended December 31, 2011, 2010 and 2009:
| Years Ended December 31, | ||||||||||||||||||||||||
| 2011 | 2010 | 2009 | ||||||||||||||||||||||
| Number of Shares |
Weighted-Average Grant-Date Fair Value per Share |
Number of Shares |
Weighted-Average Grant-Date Fair Value per Share |
Number of Shares |
Weighted-Average Grant-Date Fair Value per Share |
|||||||||||||||||||
| Unvested shares, beginning of period |
302,698 | $ | 11.40 | 219,813 | $ | 10.76 | 110,800 | $ | 11.11 | |||||||||||||||
| Shares granted during the period |
161,174 | $ | 20.37 | 152,944 | $ | 12.01 | 144,812 | $ | 10.58 | |||||||||||||||
| Shares vested during the period |
(104,317 | ) | $ | 11.53 | (70,059 | ) | $ | 10.72 | (35,799 | ) | $ | 11.11 | ||||||||||||
| Shares forfeited during the period |
| | | | | | ||||||||||||||||||
|
|
|
|
|
|
|
|||||||||||||||||||
| Unvested shares, end of period |
359,555 | $ | 15.39 | 302,698 | $ | 11.40 | 219,813 | $ | 10.76 | |||||||||||||||
|
|
|
|
|
|
|
|||||||||||||||||||
In the years ended December 31, 2011, 2010 and 2009 the Company recognized equity-based compensation expense of approximately $1.9 million, $1.2 million and $0.7 million, respectively. This expense is included in general and administrative expenses in the Companys consolidated statements of operations.
As of December 31, 2011, there was approximately $3.8 million of total unrecognized compensation cost, related to the Companys non-vested restricted shares. This cost is expected to be recognized over a weighted-average period of approximately 1.8 years.
| 6. | Commitments and Contingencies |
In the normal course of business, the Company is party to financial instruments with off-balance sheet risk, consisting primarily of unused commitments to extend credit, in the form of loans, to the Companys portfolio companies. The balance of unused commitments to extend credit as of December 31, 2011 and 2010 was approximately $17.1 million and $5.1 million, respectively. Since these commitments may expire without being drawn upon, the total commitment amount does not necessarily represent future cash requirements.
F-37
Table of Contents
Triangle Capital Corporation
Notes to Financial Statements (Continued)
The Companys headquarters is leased under an agreement that expires on December 31, 2013. Rent expense for the years ended December 31, 2011, 2010 and 2009 was approximately $290,000, $283,000 and $282,000, respectively, and the rent commitments for the two years ending December 31, 2013 are as follows:
| Years ending December 31, |
Rent Commitment | |||
| 2012 |
$ | 294,531 | ||
| 2013 |
301,368 | |||
|
|
|
|||
| Total |
$ | 595,899 | ||
|
|
|
|||
| 7. | Financial Highlights |
| Years Ended December 31, | ||||||||||||||||||||
| 2011 (Consolidated) |
2010 (Consolidated) |
2009 (Consolidated) |
2008 (Consolidated) |
2007 (Consolidated) |
||||||||||||||||
| Per share data: |
||||||||||||||||||||
| Net asset value at beginning of period |
$ | 12.09 | $ | 11.03 | $ | 13.22 | $ | 13.74 | $ | 13.44 | ||||||||||
| Net investment income(1) |
2.06 | 1.58 | 1.63 | 1.54 | 0.96 | |||||||||||||||
| Net realized gain (loss) on investments(1) |
0.56 | (0.43 | ) | 0.05 | 0.21 | (0.09 | ) | |||||||||||||
| Net unrealized appreciation (depreciation) on investments(1) |
0.33 | 0.86 | (1.20 | ) | (0.62 | ) | 0.45 | |||||||||||||
|
|
|
|
|
|
|
|
|
|
|
|||||||||||
| Total increase from investment operations(1) |
2.95 | 2.01 | 0.48 | 1.13 | 1.32 | |||||||||||||||
| Cash dividends/distributions declared |
(1.77 | ) | (1.65 | ) | (1.67 | ) | (1.44 | ) | (0.98 | ) | ||||||||||
| Taxes paid on deemed distribution of long term capital gains |
(0.02 | ) | | | | | ||||||||||||||
| Common stock offerings |
1.61 | 0.67 | (0.53 | ) | | | ||||||||||||||
| Stock-based compensation(1) |
(0.04 | ) | (0.05 | ) | 0.08 | 0.04 | | |||||||||||||
| Shares issued pursuant to Dividend Reinvestment Plan |
0.03 | 0.08 | 0.10 | | 0.24 | |||||||||||||||
| Distribution to partners(1) |
| | | | (0.03 | ) | ||||||||||||||
| Income tax provision(1) |
(0.05 | ) | (0.02 | ) | (0.02 | ) | (0.02 | ) | (0.01 | ) | ||||||||||
| Other(2) |
(0.12 | ) | 0.02 | (0.63 | ) | (0.23 | ) | (0.24 | ) | |||||||||||
|
|
|
|
|
|
|
|
|
|
|
|||||||||||
| Net asset value at end of period |
$ | 14.68 | $ | 12.09 | $ | 11.03 | $ | 13.22 | $ | 13.74 | ||||||||||
|
|
|
|
|
|
|
|
|
|
|
|||||||||||
| Market value at end of period(3) |
$ | 19.12 | $ | 19.00 | $ | 12.09 | $ | 10.20 | $ | 12.40 | ||||||||||
|
|
|
|
|
|
|
|
|
|
|
|||||||||||
| Shares outstanding at end of period |
22,774,726 | 14,928,987 | 11,702,511 | 6,917,363 | 6,803,863 | |||||||||||||||
| Net assets at end of period |
$ | 334,286,955 | $ | 180,479,159 | $ | 129,099,192 | $ | 91,514,982 | $ | 93,472,353 | ||||||||||
| Average net assets(4) |
$ | 270,041,765 | $ | 145,386,905 | $ | 98,085,844 | $ | 94,584,281 | $ | 92,765,399 | ||||||||||
| Ratio of total operating expenses to average net assets |
9 | % | 11 | % | 14 | % | 11 | % | 7 | % | ||||||||||
| Ratio of net investment income to average net assets |
15 | % | 14 | % | 14 | % | 11 | % | 7 | % | ||||||||||
| Portfolio turnover ratio |
11 | % | 23 | % | 12 | % | 13 | % | 13 | % | ||||||||||
| Total return(5) |
10 | % | 71 | % | 35 | % | (6 | %) | (11 | %) | ||||||||||
| (1) | Weighted average basic per share data. |
| (2) | Represents the impact of the different share amounts used in calculating per share data as a result of calculating certain per share data based upon the weighted average basic shares outstanding during the period and certain per share data based on the shares outstanding as of a period end or transaction date. |
| (3) | Represents the closing price of the Companys common stock on the last day of the period. |
F-38
Table of Contents
Triangle Capital Corporation
Notes to Financial Statements (Continued)
| (4) | Average net assets for the year ended December 31, 2007 are presented as if the IPO and Formation Transactions had occurred on January 1, 2007. See Note 1 for a further description of the basis of presentation of the Companys financial statements. |
| (5) | The total return for the years ended December 31, 2011, 2010, 2009 and 2008 equals the change in the market value of the Companys common stock during the period, plus dividends declared per share during the period, divided by the market value of the Companys common stock at the beginning of the period. The total return for the year ended December 31, 2007 equals the change in the market value of the Companys common stock from the IPO price of $15.00 per share plus dividends declared per share during the period, divided by the IPO price. Total return is not annualized. |
| 8. | Selected Quarterly Financial Data (Unaudited) |
The following tables set forth certain quarterly financial information for each of the eight quarters in the two years ended December 31, 2011. Results for any quarter are not necessarily indicative of results for the full year or for any future quarter.
| Quarter Ended | ||||||||||||||||
|
March 31, 2011 |
June 30, 2011 |
September 30, 2011 |
December 31, 2011 |
|||||||||||||
| Total investment income |
$ | 12,425,397 | $ | 16,413,746 | $ | 16,220,810 | $ | 18,304,028 | ||||||||
| Net investment income |
7,728,127 | 10,223,521 | 10,392,256 | 11,994,589 | ||||||||||||
| Net increase in net assets resulting from operations |
12,351,241 | 14,545,231 | 17,470,243 | 12,404,322 | ||||||||||||
| Net investment income per share |
$ | 0.46 | $ | 0.55 | $ | 0.52 | $ | 0.53 | ||||||||
| Quarter Ended | ||||||||||||||||
|
March 31, 2010 |
June 30, 2010 |
September 30, 2010 |
December 31, 2010 |
|||||||||||||
| Total investment income |
$ | 7,484,907 | $ | 8,294,147 | $ | 9,787,085 | $ | 10,419,355 | ||||||||
| Net investment income |
3,793,684 | 4,558,624 | 5,612,455 | 6,184,710 | ||||||||||||
| Net increase in net assets resulting from operations |
4,149,329 | 6,867,280 | 7,183,182 | 7,190,758 | ||||||||||||
| Net investment income per share |
$ | 0.32 | $ | 0.38 | $ | 0.46 | $ | 0.42 | ||||||||
| 9. | Subsequent Events |
In February 2012, the Companys Board of Directors granted 227,631 restricted shares of the Companys common stock to certain employees. These restricted shares had a total grant date fair value of approximately $4.3 million, which will be expensed on a straight-line basis over each respective awards vesting period.
In February 2012, the Company filed a prospectus supplement pursuant to which 3,700,000 shares of common stock were offered for sale at a price to the public of $19.00 per share. In addition, the underwriters involved were granted an overallotment option to purchase an additional 555,000 shares of our common stock at the same public offering price. Pursuant to this offering, all shares (including the overallotment option shares) were sold and delivered on February 13, 2012 resulting in net proceeds to the Company, after underwriting discounts and offering expenses, of approximately $77.1 million.
In February 2012, the Company invested $6.3 million in subordinated debt with warrants of Stella Environmental Services, LLC (Stella). Stella manages waste transfer station operations. Under the terms of the investment, Stella will pay interest on the subordinated debt at a rate of 15.5% per annum.
F-39
Table of Contents
Triangle Capital Corporation
Notes to Financial Statements (Continued)
In February 2012, the Company filed a prospectus supplement pursuant to which $60.0 million in aggregate principal amount of 7.00% senior unsecured notes due 2019 were offered. The notes will mature on March 15, 2019, and may be redeemed in whole or in part at any time or from time to time at the Companys option on or after March 15, 2015. The notes will bear interest at a rate of 7.00% per year payable quarterly on March 15, June 15, September 15 and December 15 of each year, beginning June 15, 2012. The Company also granted the underwriters a 30-day option to purchase up to an additional $9.0 million in aggregate principal amount of notes to cover overallotments, if any. Pursuant to this offering, $60.0 million of the notes were sold and delivered on March 2, 2012 resulting in net proceeds to the Company, after underwriting discounts and offering expenses, of approximately $57.9 million.
In March 2012, the Company invested $12.0 million in first lien debt and equity of United Allergy Labs (UAL). UAL tests for and treats allergies using immunotherapy. Under the terms of the investment, UAL will pay interest on the debt at a rate of 14.0% per annum.
In March 2012, the Company prepaid $10.4 million in SBA guaranteed debentures that had a weighted average interest rate of 6.2%.
F-40
Table of Contents
EXHIBIT INDEX
| Number |
Exhibit |
|
| 3.1 | Articles of Amendment and Restatement of the Registrant (Filed as Exhibit (a)(3) to the Registrants Registration Statement on Form N-2/N-5 (File No. 333-138418) filed with the Securities and Exchange Commission on December 29, 2006 and incorporated herein by reference). | |
| 3.2 | Third Amended and Restated Bylaws of the Registrant (Filed as Exhibit 3.2 to the Registrants Quarterly Report on Form 10-Q filed with the Securities and Exchange Commission on May 4, 2011 and incorporated herein by reference). | |
| 3.3 | Certificate of Domestic Limited Partnership of Triangle Mezzanine Fund LLLP (Filed as Exhibit (a)(4) to the Registrants Registration Statement on Form N-2/N-5 (File No. 333-138418) filed with the Securities and Exchange Commission on February 13, 2007 and incorporated herein by reference). | |
| 3.4 | Second Amended and Restated Agreement of Limited Partnership of Triangle Mezzanine Fund LLLP (Filed as Exhibit 3.4 to the Registrants Quarterly Report on Form 10-Q filed with the Securities and Exchange Commission on November 7, 2007 and incorporated herein by reference). | |
| 4.1 | Form of Common Stock Certificate (Filed as Exhibit (d) to the Registrants Registration Statement on Form N-2/N-5 (File No. 333-138418) filed with the Securities and Exchange Commission on February 15, 2007 and incorporated herein by reference). | |
| 4.2 | Triangle Capital Corporation Dividend Reinvestment Plan (Filed as Exhibit 4.2 to the Registrants Annual Report on Form 10-K for the year ended December 31, 2007 filed with the Securities and Exchange Commission on March 12, 2008 and incorporated herein by reference). | |
| 4.3 | Agreement to Furnish Certain Instruments (Filed as Exhibit 4.19 to the Registrants Annual Report on Form 10-K for the year ended December 31, 2008 filed with the Securities and Exchange Commission on February 25, 2009 and incorporated herein by reference). | |
| 4.4 | Indenture, dated March 2, 2012 between the Registrant and the Bank of New York Mellon Trust Company, N.A. (Filed as Exhibit (d)(5) to the Registrants Post-Effective Amendment No. 2 on Form N-2 filed with the Securities and Exchange Commission on March 2, 2012 and incorporated herein by reference). | |
| 4.5 | First Supplemental Indenture, dated March 2, 2012 between the Registrant and the Bank of New York Mellon Trust Company, N.A. (Filed as Exhibit (d)(6) to the Registrants Post-Effective Amendment No. 2 on Form N-2 filed with the Securities and Exchange Commission on March 2, 2012 and incorporated herein by reference). | |
| 4.6 | Form of 7.00% Senior Note due 2019 (Filed as Exhibit (d)(7) to the Registrants Post-Effective Amendment No. 2 on Form N-2 filed with the Securities and Exchange Commission on March 2, 2012 and incorporated herein by reference). | |
| 10.1 | Triangle Capital Corporation Amended and Restated 2007 Equity Incentive Plan (Filed as Exhibit 10.1 to the Registrants Current Report on Form 8-K filed with the Securities and Exchange Commission on May 9, 2008 and incorporated herein by reference). | |
| 10.2 | Form of Triangle Capital Corporation Non-employee Director Restricted Share Award Agreement (Filed as Exhibit 10.2 to the Registrants Current Report on Form 8-K filed with the Securities and Exchange Commission on May 9, 2008 and incorporated herein by reference). | |
| 10.3 | Form of Triangle Capital Corporation Executive Officer Restricted Share Award Agreement (Filed as Exhibit 10.3 to the Registrants Annual Report on Form 10-K filed with the Securities and Exchange Commission on March 9, 2011 and incorporated herein by reference). | |
Table of Contents
| Number |
Exhibit |
|
| 10.4 | Custodian Agreement between the Registrant and U.S. Bank National Association (Filed as Exhibit 10.7 to the Registrants Annual Report on Form 10-K for the year ended December 31, 2006 filed with the Securities and Exchange Commission on March 29, 2007 and incorporated herein by reference). | |
| 10.5 | Amendment to Custody Agreement between the Registrant and U.S. Bank National Association dated February 5, 2008 (Filed as Exhibit 10.9 to the Registrants Annual Report on Form 10-K for the year ended December 31, 2007 filed with the Securities and Exchange Commission on March 12, 2008 and incorporated herein by reference). | |
| 10.6 | Custodial Agreement between the Registrant and Branch Banking and Trust Company dated January 26, 2012. (Filed as Exhibit (j)(3) to the Registrants Post-Effective Amendment No. 2 on Form N-2 filed with the Securities and Exchange Commission on March 2, 2012 and incorporated herein by reference) | |
| 10.7 | Custody Services Agreement between the Registrant and Fifth Third Institutional Services dated January 6, 2012. (Filed as Exhibit (j)(4) to the Registrants Post-Effective Amendment No. 2 on Form N-2 filed with the Securities and Exchange Commission on March 2, 2012 and incorporated herein by reference) | |
| 10.8 | Stock Transfer Agency Agreement between the Registrant and The Bank of New York (Filed as Exhibit 10.11 to the Registrants Annual Report on Form 10-K for the year ended December 31, 2007 filed with the Securities and Exchange Commission on March 12, 2008 and incorporated herein by reference). | |
| 10.9 | Office Lease Agreement between 3700 Glenwood LLC and the Registrant dated March 27, 2008 (Filed as Exhibit (k)(6) to the Registrants Registration Statement on Form N-2 (File No. 333-151930) filed with the Securities and Exchange Commission on August 13, 2008 and incorporated herein by reference). | |
| 10.10 | Credit Agreement between the Registrant, Branch Banking and Trust Company, BB&T Capital Markets and Fifth Third Bank dated May 9, 2011 (Incorporated by reference to Exhibit 10.1 to the Registrants Current Report on Form 8-K, filed on May 11, 2011). | |
| 10.11 | Supplement and Joinder Agreement between the Registrant, Branch Banking and Trust Company, Fifth Third Bank and Morgan Stanley Bank, N.A. dated November 1, 2011 (Incorporated by reference to Exhibit 10.1 to the Registrants Current Report on Form 8-K, filed on November 2, 2011). | |
| 10.12 | General Security Agreement between the Registrant, ARC Industries Holdings, Inc., Brantley Holdings, Inc., Energy Hardware Holdings, Inc., Minco Holdings, Inc., Peaden Holdings, Inc., Technology Crops Holdings, Inc. and Branch Banking and Trust Company dated May 9, 2011 (Incorporated by reference to Exhibit 10.2 to the Registrants Current Report on Form 8-K, filed on May 11, 2011). | |
| 10.13 | Equity Pledge Agreement between the Registrant, ARC Industries Holdings, Inc., Brantley Holdings, Inc., Energy Hardware Holdings, Inc., Minco Holdings, Inc., Peaden Holdings, Inc., Technology Crops Holdings, Inc. and Branch Banking and Trust Company dated May 9, 2011 (Incorporated by reference to Exhibit 10.3 to the Registrants Current Report on Form 8-K, filed on May 11, 2011). | |
| 14.1 | Code of Business Conduct and Ethics (Filed as Exhibit 14.1 to the Registrants Annual Report on Form 10-K filed with the Securities and Exchange Commission on March 9, 2011 and incorporated herein by reference). | |
| 21.1 | List of Subsidiaries.* | |
| 23.1 | Consent of Ernst & Young LLP.* | |
Table of Contents
| Number |
Exhibit |
|
| 31.1 | Chief Executive Officer Certification Pursuant to Rule 13a-14 of the Securities Exchange Act of 1934, as adopted pursuant to Section 302 of the Sarbanes-Oxley Act of 2002.* | |
| 31.2 | Chief Financial Officer Certification Pursuant to Rule 13a-14 of the Securities Exchange Act of 1934, as adopted pursuant to Section 302 of the Sarbanes-Oxley Act of 2002.* | |
| 32.1 | Chief Executive Officer Certification pursuant to Section 1350, Chapter 63 of Title 18, United States Code, as adopted pursuant to Section 906 of the Sarbanes-Oxley Act of 2002.* | |
| 32.2 | Chief Financial Officer Certification pursuant to Section 1350, Chapter 63 of Title 18, United States Code, as adopted pursuant to Section 906 of the Sarbanes-Oxley Act of 2002.* | |
| | Management contract or compensatory plan or arrangement. |
| * | Filed herewith. |