10-K: Annual report pursuant to Section 13 and 15(d)
Published on February 27, 2019
UNITED STATES SECURITIES AND EXCHANGE COMMISSION
Washington, D.C. 20549
Form 10-K
(Mark One)
þ |
ANNUAL REPORT PURSUANT TO SECTION 13 OR 15(d) OF THE SECURITIES EXCHANGE ACT OF 1934 |
For the fiscal year ended December 31, 2018 |
|
OR
¨ |
TRANSITION REPORT PURSUANT TO SECTION 13 OR 15(d) OF THE SECURITIES EXCHANGE ACT OF 1934 |
For the transition period from to |
|
Commission file number 814-00733
Barings BDC, Inc.
(Exact name of registrant as specified in its charter)
Maryland |
06-1798488 |
|
|
(State or other jurisdiction of
incorporation or organization)
|
(I.R.S. Employer
Identification No.)
|
|
300 South Tryon Street, Suite 2500 Charlotte, North Carolina |
28202
(Zip Code)
|
|
(Address of principal executive offices) |
||
Registrant’s telephone number, including area code:
(704) 805-7200
Securities registered pursuant to Section 12(b) of the Act:
Title of Each Class |
Name of Each Exchange on Which Registered |
|
Common Stock, par value $0.001 per share |
The New York Stock Exchange |
|
Securities registered pursuant to Section 12(g) of the Act:
None
Indicate by check mark if the registrant is a well-known seasoned issuer, as defined in Rule 405 of the Securities Act. Yes ¨ No R
Indicate by check mark if the registrant is not required to file reports pursuant to Section 13 or Section 15(d) of the Act. Yes ¨ No R
Indicate by check mark whether the registrant (1) has filed all reports required to be filed by Section 13 or 15(d) of the Securities Exchange Act of 1934 during the preceding 12 months (or for such shorter period that the registrant was required to file such reports), and (2) has been subject to such filing requirements for the past 90 days. Yes þ No ¨
Indicate by check mark whether the registrant has submitted electronically every Interactive Data File required to be submitted pursuant to Rule 405 of Regulation S-T during the preceding 12 months (or for such shorter period that the registrant was required to submit such files). Yes ¨ No ¨
Indicate by check mark if disclosure of delinquent filers pursuant to Item 405 of Regulation S-K is not contained herein, and will not be contained, to the best of registrant’s knowledge, in definitive proxy or information statements incorporated by reference in Part III of this Form 10-K or any amendment to this Form 10-K. ¨
Indicate by check mark whether the registrant is a large accelerated filer, an accelerated filer, a non-accelerated filer, a smaller reporting company, or an emerging growth company. See the definitions of "large accelerated filer," "accelerated filer," "smaller reporting company," and "emerging growth company" in Rule 12b-2 of the Exchange Act. (Check one):
Large accelerated filer þ
|
Accelerated filer ¨
|
Non-accelerated filer ¨
|
Smaller reporting company ¨
|
|||
Emerging growth company ¨
|
||||||
If an emerging growth company, indicate by check mark if the registrant has elected not to use the extended transition period for complying with any new or revised financial accounting standards provided pursuant to Section 13(a) of the Exchange Act. ¨
| ||||||
Indicate by check mark whether the registrant is a shell company (as defined in Rule 12b-2 of the Act). Yes ¨ No þ
The aggregate market value of the voting common stock held by non-affiliates of the registrant (assuming solely for the purpose of this disclosure that all executive officers, directors and 10% or more stockholders of the registrant are “affiliates”) as of June 29, 2018, based on the closing price on that date of $11.50 on the New York Stock Exchange, was $532,780,648.
The number of shares outstanding of the registrant’s common stock on February 27, 2019 was 51,284,064.
DOCUMENTS INCORPORATED BY REFERENCE
Portions of the registrant’s definitive proxy statement relating to the registrant's 2019 Annual Meeting of Stockholders, to be filed with the Securities and Exchange Commission within 120 days following the end of the registrant's fiscal year, are incorporated by reference in Part III of this Annual Report on Form 10-K as indicated herein.
BARINGS BDC, INC.
TABLE OF CONTENTS
ANNUAL REPORT ON FORM 10-K
For the Fiscal Year Ended December 31, 2018
Page |
||
PART I |
||
Item 1. |
||
Item 1A. |
||
Item 1B. |
||
Item 2. |
||
Item 3. |
||
Item 4. |
||
PART II |
||
Item 5. |
||
Item 6. |
||
Item 7. |
||
Item 7A. |
||
Item 8. |
||
Item 9. |
||
Item 9A. |
||
Item 9B. |
||
PART III |
||
Item 10. |
||
Item 11. |
||
Item 12. |
||
Item 13. |
||
Item 14. |
||
PART IV |
||
Item 15. |
||
2
FORWARD-LOOKING STATEMENTS
This Annual Report on Form 10-K contains forward-looking statements regarding the plans and objectives of management for future operations. Any such forward-looking statements may involve known and unknown risks, uncertainties and other factors which may cause our actual results, performance or achievements to be materially different from future results, performance or achievements expressed or implied by any forward-looking statements. Forward-looking statements, which involve assumptions and describe our future plans, strategies and expectations, are generally identifiable by use of the words "may," "will," "should," "expect," "anticipate," "estimate," "believe," "intend," "target," "goals," "plan," "forecast," "project," other variations on these words or comparable terminology, or the negative of these words. These forward-looking statements are based on assumptions that may be incorrect, and we cannot assure you that the projections included in these forward-looking statements will come to pass. Our actual results could differ materially from those expressed or implied by the forward-looking statements as a result of various factors, including the factors discussed in Item 1A entitled "Risk Factors" in Part I of this Annual Report on Form 10-K and elsewhere in this Annual Report on Form 10-K. Other factors that could cause actual results to differ materially include changes in the economy and future changes in laws or regulations and conditions in our operating areas.
We have based the forward-looking statements included in this Annual Report on Form 10-K on information available to us on the date of this Annual Report on Form 10-K, and we assume no obligation to update any such forward-looking statements, unless we are required to do so by applicable law. However, you are advised to consult any additional disclosures that we may make directly to you or through reports that we in the future may file with the Securities and Exchange Commission, including subsequent annual reports on Form 10-K, quarterly reports on Form 10-Q and current reports on Form 8-K.
3
PART I
Item 1. Business.
Organization
We are a Maryland corporation incorporated on October 10, 2006. We currently operate as a closed-end, non-diversified investment company and have elected to be treated as a business development company ("BDC") under the Investment Company Act of 1940, as amended (the "1940 Act"). Our wholly-owned subsidiary, Triangle Mezzanine Fund LLLP ("Triangle SBIC") has also elected to be treated as a BDC under the 1940 Act. We have elected for federal income tax purposes to be treated as a regulated investment company ("RIC") under the Internal Revenue Code of 1986, as amended (the "Code"), for tax purposes.
Our headquarters are in Charlotte, North Carolina, and our Internet address is www.baringsbdc.com. We are not including the information contained on our website as a part of, or incorporating it by reference into, this Annual Report on Form 10-K. We make available free of charge through our website our Annual Reports on Form 10-K, Quarterly Reports on Form 10-Q, Current Reports on Form 8-K, and any amendments to these reports, as soon as reasonably practicable after we electronically file such material with, or furnish such material to, the Securities and Exchange Commission (the "SEC"). Copies of this Annual Report and other reports are also available without charge upon written request to us.
The Asset Sale and Externalization Transactions
On April 3, 2018, we entered into an asset purchase agreement (the "Asset Purchase Agreement"), with BSP Asset Acquisition I, LLC (the "Asset Buyer"), an affiliate of Benefit Street Partners L.L.C. ("BSP"), pursuant to which we agreed to sell our December 31, 2017 investment portfolio to the Asset Buyer for gross proceeds of $981.2 million in cash, subject to certain adjustments to take into account portfolio activity and other matters occurring since December 31, 2017 (such transaction referred to herein as the "Asset Sale Transaction").
Also on April 3, 2018, we entered into a stock purchase and transaction agreement (the "Externalization Agreement"), with Barings LLC ("Barings") through which Barings agreed to become our investment adviser in exchange for (1) a payment by Barings of $85.0 million, or approximately $1.78 per share, directly to our stockholders, (2) an investment by Barings of $100.0 million in newly issued shares of our common stock at net asset value and (3) a commitment from Barings to purchase up to $50.0 million of shares of our common stock in the open market at prices up to and including our then-current net asset value per share for a two-year period, after which Barings agreed to use any remaining funds from the $50.0 million to purchase additional newly-issued shares of our common stock at the greater of our then-current net asset value per share or market price (collectively, the "Externalization Transaction"). The Asset Sale Transaction and the Externalization Transaction are collectively referred to as the "Transactions." The Transactions were approved by our stockholders at our July 24, 2018 special meeting of stockholders (the "2018 Special Meeting").
The Asset Sale Transaction closed on July 31, 2018. The gross cash proceeds received from the Asset Buyer and certain affiliates of the Asset Buyer in connection with the Asset Sale Transaction were approximately $793.3 million, after adjustments to take into account portfolio activity and other matters occurring since December 31, 2017, as described in greater detail in the Asset Purchase Agreement. Adjustments to the purchase price included, among other things, approximately $208.8 million of principal payments and prepayments, sales proceeds and distributions related to our investment portfolio that were received and retained by us between December 31, 2017 and the closing of the Asset Sale Transaction, offset by approximately $29.5 million of loans and equity investments originated by us between December 31, 2017 and the closing of the Asset Sale Transaction.
In connection with the closing of the Asset Sale Transaction, we caused notices to be issued to the holders of our December 2022 Notes and March 2022 Notes (each as defined in our consolidated financial statements for the fiscal year ended December 31, 2018 and notes thereto) regarding the redemption of all $80.5 million in aggregate principal amount of the December 2022 Notes and all $86.3 million in aggregate principal amount of the March 2022 Notes, in each case, on August 30, 2018. The December 2022 Notes and the March 2022 Notes were redeemed at 100% of their principal amount ($25.00 per Note), plus the accrued and unpaid interest thereon from June 15, 2018 to, but excluding, August 30, 2018. In furtherance of the redemption, on July 31, 2018, we irrevocably deposited with The Bank of New York Mellon Trust Company, N.A., as trustee under the indenture and supplements thereto relating to the December 2022 Notes and the March 2022 Notes, funds in trust for the purposes of redeeming all of the issued and outstanding December 2022 Notes and March 2022 Notes and paying all sums due and payable under the indenture and supplements thereto. As a result, our obligations under the indenture and supplements
4
thereto relating to the December 2022 Notes and the March 2022 Notes were satisfied and discharged as of July 31, 2018, except with respect to those obligations that the indenture expressly provides shall survive the satisfaction and discharge of the indenture. In addition, in connection with the closing of the Asset Sale Transaction, we terminated our senior secured credit facility entered into in May 2015, and subsequently amended in May 2017 (the "May 2017 Credit Facility").
Our wholly-owned subsidiaries, Triangle SBIC, Triangle Mezzanine Fund II LP ("Triangle SBIC II"), and Triangle Mezzanine Fund III LP ("Triangle SBIC III"), are specialty finance limited partnerships that were formed to make investments primarily in lower middle-market companies located throughout the United States. Each of Triangle SBIC, Triangle SBIC II and Triangle SBIC III held licenses to operate as Small Business Investment Companies ("SBICs"), under the authority of the United States Small Business Administration ("SBA"). In connection with the closing of the Asset Sale Transaction, we repaid all of our outstanding SBA-guaranteed debentures and delivered necessary materials to the SBA to surrender the SBIC licenses held by Triangle SBIC, Triangle SBIC II, and Triangle SBIC III.
The Externalization Transaction closed on August 2, 2018 (the "Externalization Closing"). Effective as of the Externalization Closing, we changed our name from Triangle Capital Corporation to Barings BDC, Inc. and on August 3, 2018, began trading on the New York Stock Exchange ("NYSE") under the symbol "BBDC."
In connection with the closing of the Externalization Transaction, we entered into an investment advisory agreement (the "Advisory Agreement") and an administration agreement (the "Administration Agreement") with Barings, pursuant to which Barings serves as our investment adviser and administrator and manages our investment portfolio which initially consisted primarily of the cash proceeds received in connection with the Asset Sale Transaction. In addition, on August 2, 2018, we issued 8,529,917 shares of our common stock to Barings at a price of $11.723443 per share, or an aggregate of $100.0 million in cash.
Furthermore, on August 7, 2018, we launched a $50.0 million issuer tender offer (the "Tender Offer"). Pursuant to the Tender Offer, on September 11, 2018, we purchased 4,901,961 shares of our common stock at a purchase price of $10.20 per share, for an aggregate cost of approximately $50.0 million, excluding fees and expenses relating to the Tender Offer. The shares of common stock purchased in the Tender Offer represented approximately 8.7% of our issued and outstanding shares at the time of the Tender Offer.
On September 24, 2018, Barings entered into a Rule 10b5-1 Purchase Plan (the "10b5-1 Plan") that qualified for the safe harbors provided by Rules 10b5-1 and 10b-18 under the Securities Exchange Act of 1934, as amended (the “Exchange Act”). Pursuant to the 10b5-1 Plan, an independent broker made purchases of shares of our common stock on the open market on behalf of Barings in accordance with purchase guidelines specified in the 10b5-1 Plan. The 10b5-1 Plan was established in accordance with Barings obligation under the Externalization Agreement to enter into a trading plan pursuant to which Barings committed to purchase $50.0 million in value of shares in open market transactions through an independent broker. The maximum aggregate purchase price of all shares purchased under the 10b5-1 Plan was $50.0 million. As of December 31, 2018, Barings had purchased 4,045,248 shares of our common stock pursuant to the 10b5-1 Plan and owned a total of 12,600,627 shares of our common stock, or 24.6% of the total shares outstanding. On February 11, 2019, Barings fulfilled its obligations under the 10b5-1 Plan to purchase an aggregate amount of $50.0 million in shares of our common stock and the 10b5-1 Plan terminated in accordance with its terms. Upon completion of the 10b5-1 Plan, Barings had purchased 5,084,302 shares of our common stock pursuant to the 10b5-1 Plan and owned a total of 13,639,681 shares of our common stock, or 26.6% of the total shares outstanding.
As previously disclosed in our definitive proxy statement relating to the Transactions, filed with the SEC on June 1, 2018, and any supplements thereto, collectively referred to as the 2018 Special Meeting Proxy Statement, all of the existing officers and directors resigned effective as of the closing of the Externalization Transaction. In addition, our Board of Directors (the "Board") approved the election of, effective from and after the closing of the Externalization Transaction, directors identified by Barings and the appointment of each such director to a director class selected by Barings, as disclosed in the 2018 Special Meeting Proxy Statement. The Board has also appointed new officers of the Company as identified by Barings, effective from and after the closing of the Externalization Transaction. Refer to the 2018 Special Meeting Proxy Statement for more information.
From 2007 through the date of the Externalization Transaction, we were internally managed by our executive officers under the supervision of the Board. During this period, we did not pay management or advisory fees, but instead incurred the operating costs associated with employing executive management and investment and portfolio management professionals. On August 2, 2018, we entered into the Advisory Agreement and became an externally-managed BDC managed by Barings. An externally-managed BDC generally does not have any employees, and its
5
investment and management functions are provided by an outside investment adviser and administrator under an advisory agreement and administration agreement. Instead of directly compensating employees, we pay Barings for investment and management services pursuant to the terms of the Advisory Agreement and the Administration Agreement. Under the terms of the Advisory Agreement, the fees paid to Barings for managing our affairs are determined based upon an objective and fixed formula, as compared with the subjective and variable nature of the costs associated with employing management and employees in an internally-managed BDC structure, which include bonuses that cannot be directly tied to Company performance because of restrictions on incentive compensation under the 1940 Act.
Overview of Our Business
Prior to the Transactions, our business was to provide capital to lower middle-market companies located primarily in the United States. We focused on investments in companies with a history of generating revenues and positive cash flows, an established market position and a proven management team with a strong operating discipline. Our target portfolio company had annual revenues between $20.0 million and $300.0 million and annual earnings before interest, taxes, depreciation and amortization, as adjusted ("Adjusted EBITDA") between $5.0 million and $75.0 million. We invested primarily in senior and subordinated debt securities of privately held companies, generally secured by security interests in portfolio company assets. In addition, we generally invested in one or more equity instruments of the borrower, such as direct preferred or common equity interests. Our investments generally ranged from $5.0 million to $50.0 million per portfolio company. The securities in which we invested would be rated below investment grade if they were rated. Such below investment grade securities are often referred to as "high yield" or "junk."
Beginning August 2, 2018, Barings shifted our investment focus to invest in syndicated senior secured loans, bonds and other fixed income securities. Over time, Barings expects to transition our portfolio to senior secured private debt investments in performing, well-established middle-market businesses that operate across a wide range of industries. Generally, these securities would also be rated below investment grade if they were rated. Barings’ existing SEC exemptive relief under Sections 17(d) and 57(i) of the 1940 Act and Rule 17d-1 thereunder, granted on October 19, 2017 (the "Exemptive Relief"), permits us and Barings’ affiliated private funds and SEC-registered funds to co-invest in Barings-originated loans, which allows Barings to implement its senior secured private debt investment strategy for us on an accelerated timeline.
Barings employs fundamental credit analysis, and targets investments in businesses with relatively low levels of cyclicality and operating risk. The holding size of each position will generally be dependent upon a number of factors including total facility size, pricing and structure, and the number of other lenders in the facility. Barings has experienced managing levered vehicles, both public and private, and will seek to enhance our returns through the use of leverage with a prudent approach that prioritizes capital preservation. Barings believes this strategy and approach offers attractive risk/return with lower volatility given the potential for fewer defaults and greater resilience through market cycles.
We generate revenues in the form of interest income, primarily from our investments in debt securities, loan origination and other fees and dividend income. Fees generated in connection with our debt investments are recognized over the life of the loan using the effective interest method or, in some cases, recognized as earned. Our syndicated senior secured loans generally bear interest between LIBOR plus 300 basis points and LIBOR plus 400 points. As we transition to senior secured private debt investments, such investments will generally have terms of between five and seven years. Our senior secured private debt investments generally will bear interest between LIBOR plus 450 basis points and LIBOR plus 650 basis points per annum. From time to time, certain of our investments may have a form of interest, referred to as payment-in-kind ("PIK") interest, that is not paid currently but is instead accrued and added to the loan balance and paid at the end of the term. As of December 31, 2018, we had investments in 139 portfolio companies, with an aggregate cost of approximately $1,173.9 million.
Relationship with Our Adviser, Barings
Our investment adviser, Barings, a wholly-owned subsidiary of Massachusetts Mutual Life Insurance Company ("MassMutual"), is a leading global asset management firm and is registered with the SEC as an investment adviser under the Investment Advisers Act of 1940, as amended (the "Advisers Act"). Barings’ primary investment capabilities include fixed income, private credit, real estate, equity, and alternative investments. Subject to the overall supervision of the Board, Barings’ Global Private Finance Group ("Barings GPFG") manages our day-to-day operations, and provides investment advisory and management services to us. Barings GPFG is part of
6
Barings' $225 billion Global Fixed Income Platform that invests in liquid, private and structured credit. Barings GPFG manages private funds and separately managed accounts, along with multiple public vehicles.
Among other things, Barings (i) determines the composition of our portfolio, the nature and timing of the changes therein and the manner of implementing such changes; (ii) identifies, evaluates and negotiates the structure of the investments made by us; (iii) executes, closes, services and monitors the investments that we make; (iv) determines the securities and other assets that we will purchase, retain or sell; (v) performs due diligence on prospective portfolio companies and (vi) provides us with such other investment advisory, research and related services as we may, from time to time, reasonably require for the investment of our funds.
Under the terms of the Administration Agreement, Barings has agreed to perform (or oversee, or arrange for, the performance of) the administrative services necessary for our operation, including, but not limited to, office facilities, equipment, clerical, bookkeeping and record keeping services at such office facilities and such other services as Barings, subject to review by the Board, will from time to time determine to be necessary or useful to perform its obligations under the Administration Agreement. Barings will also, on our behalf and subject to the Board’s approval, arrange for the services of, and oversee, custodians, depositories, transfer agents, dividend disbursing agents, other stockholder servicing agents, accountants, attorneys, underwriters, brokers and dealers, corporate fiduciaries, insurers, banks and such other persons in any such other capacity deemed to be necessary or desirable. Barings is responsible for the financial and other records that we are required to maintain and will prepare all reports and other materials required to be filed with the SEC or any other regulatory authority.
Stockholder Approval of Reduced Asset Coverage Ratio
On July 24, 2018, our stockholders voted at the 2018 Special Meeting to approve a proposal to authorize us to be subject to a reduced asset coverage ratio of at least 150% under the 1940 Act. As a result of the stockholder approval at the 2018 Special Meeting, effective July 25, 2018, our applicable asset coverage ratio under the 1940 Act has been decreased to 150% from 200%. As a result, we are now permitted under the 1940 Act to incur indebtedness at a level that is more consistent with a portfolio of senior secured debt.
Our Business Strategy
We seek attractive returns by generating current income primarily from directly-originated debt investments in middle-market companies located primarily in the United States. Our strategy includes the following components:
• |
Leveraging Barings GPFG's Origination and Portfolio Management Resources. Barings GPFG has over 70 investment professionals located in seven different offices in the U.S., Europe, Australia/New Zealand and Asia. These regional investment teams have been working together in their respective regions for a number of years and have extensive experience advising, investing in and lending to companies across changing market cycles. In addition, the individual members of these teams have diverse investment backgrounds, with prior experience at investment banks, commercial banks, and privately and publicly held companies. We believe this diverse experience provides an in-depth understanding of the strategic, financial and operational challenges and opportunities of middle-market companies.
|
• |
Utilizing Long-Standing Relationships to Source Investments. Barings GPFG has worked diligently over decades to build strategic relationships with private equity firms globally. Barings GPFG's long history of providing consistent, predictable capital to middle-market sponsors, even in periods of market dislocation, has earned Barings and us a reputation as a reliable partner. Barings GPFG also maintains extensive personal relationships with entrepreneurs, financial sponsors, attorneys, accountants, investment bankers, commercial bankers and other non-bank providers of capital who refer prospective portfolio companies to us. These relationships historically have generated significant investment opportunities. We believe that this network of relationships will continue to produce attractive investment opportunities.
|
• |
Focusing on the Middle-Market. We primarily invest in middle-market transactions. These companies tend to be privately owned, often by a private equity sponsor, and are companies that typically generate annual Adjusted EBITDA of $10.0 million to $75.0 million.
|
• |
Providing One-Stop Customized Financing Solutions. Barings GPFG's ability to commit to and originate larger hold positions (in excess of $200 million) in a given transaction is a differentiator to middle-market private equity sponsors. In today's market, it has become increasingly important to have the ability to underwrite an entire transaction, providing financial sponsors with certainty of close. Barings GPFG offers a variety of financing structures and has the flexibility to structure investments to meet the needs of our portfolio companies. Currently, we invest primarily in senior secured loans. In addition, in certain limited
|
7
instances, we may invest in equity instruments of our portfolio companies, such as direct preferred or common equity interests.
• |
Applying Consistent Underwriting Policies and Active Portfolio Management. We believe robust due diligence on each investment is paramount due to the lack of an active secondary market. With limited ability to liquidate holdings, private credit investors must take a longer-term, “originate-to-hold” investment approach. Barings GPFG has implemented underwriting policies and procedures that are followed for each potential transaction. This consistent and proven fundamental underwriting process includes a thorough analysis of each potential portfolio company’s competitive position, financial performance, management team operating discipline, growth potential and industry attractiveness, which Barings GPFG believes allows them to better assess the company’s prospects. After closing, Barings GPFG maintains ongoing access to both the sponsor and to portfolio company management in order to closely monitor investments and suggest or require remedial actions as needed to avoid a default.
|
• |
Maintaining Portfolio Diversification. While we focus our investments in middle-market companies, we seek to invest across various industries. Barings GPFG monitors our investment portfolio to ensure we have acceptable industry balance, using industry and market metrics as key indicators. By monitoring our investment portfolio for industry balance, we seek to reduce the effects of economic downturns associated with any particular industry or market sector. Notwithstanding our intent to invest across a variety of industries, we may from time to time hold securities of a single portfolio company that comprise more than 5.0% of our total assets and/or more than 10.0% of the outstanding voting securities of the portfolio company. For that reason, we are classified as a non-diversified management investment company under the 1940 Act.
|
Investments
Debt Investments
The terms of our debt investments are tailored to the facts and circumstances of each transaction and prospective portfolio company, negotiating a structure that seeks to protect lender rights and manage risk while creating incentives for the portfolio company to achieve its business plan. We also seek to limit the downside risks of our investments by negotiating covenants that are designed to protect our investments while affording our portfolio companies as much flexibility in managing their businesses as possible. Such restrictions may include affirmative and negative covenants, default penalties, lien protections, change of control provisions, put rights and a pledge of the operating companies' stock which provides us with additional exit options in downside scenarios. Other lending protections may include term loan amortization, excess cash flow sweeps (effectively additional term loan amortization), limitations on a company’s ability to make acquisitions, maximums on capital expenditures and limits on allowable dividends and distributions. Further, up-front closing fees of typically 1-3% of the loan amount act effectively as pre-payment protection given the cost to a company to refinance early. Additionally, we typically include call protection provisions effective for the first six to twelve months of an investment to enhance our potential total return.
Prior to the Transactions, we invested in senior and subordinated debt securities of privately-held lower middle-market companies, generally secured by security interests in portfolio company assets. Our senior and subordinated debt investments generally had terms of three to seven years, did not have scheduled amortization and were due at maturity. Our legacy senior secured debt investments generally provided for variable interest at rates ranging from LIBOR plus 550 basis points to LIBOR plus 950 basis points per annum. In addition, our legacy subordinated debt investments generally provided for fixed interest rates between 10.0% and 15.0% per annum. Our subordinated debt investments generally were secured by a second priority security interest in the assets of the borrower and generally included an equity component, such as common stock in the portfolio company. In addition, certain loan investments had PIK interest.
Beginning August 2, 2018, Barings shifted our investment focus to initially invest the proceeds from the Asset Sale Transaction and the stock sale to Barings in syndicated senior secured loans, bonds and other fixed income securities. Over time, Barings expects to transition our portfolio to senior secured private debt investments in performing, well-established middle-market businesses that operate across a wide range of industries. As of December 31, 2018, approximately $845.6 million, or 78.5% of our investment portfolio (excluding our investment in short-term money market funds), was invested in syndicated senior secured loans, and approximately $231.0 million, or 21.5% of our investment portfolio (excluding our investment in short-term money market funds) was invested in senior secured, middle-market, private debt investments. Our syndicated senior secured loans generally bear interest at rates ranging from LIBOR plus 300 basis points to LIBOR plus 400 points per annum. Our senior
8
secured, middle-market, private debt investments generally have terms of between five and seven years, and generally bear interest at rates ranging from LIBOR plus 450 basis points to LIBOR plus 650 basis points per annum. At December 31, 2018, the weighted average yield on our syndicated senior secured loan portfolio was approximately 5.8%, and the weighted average yield on our senior secured, middle-market, private debt portfolio was approximately 7.6%.
Equity Investments
On a limited basis, we may acquire equity interests in portfolio companies. In such cases, we generally seek to structure our equity investments as non-control investments to provide us with minority rights.
Investment Criteria
We utilize the following criteria and guidelines in evaluating investment opportunities. However, not all of these criteria and guidelines have been, or will be, met in connection with each of our investments.
• |
Established Companies With Positive Cash Flow. We seek to invest in later-stage or mature companies with a proven history of generating positive cash flows. We typically focus on companies with a history of profitability and trailing twelve-month Adjusted EBITDA ranging from $10.0 million to $75.0 million.
|
• |
Experienced Management Teams. Based on our prior investment experience, we believe that a management team with significant experience with a portfolio company or relevant industry experience is essential to the long-term success of the portfolio company. We believe management teams with these attributes are more likely to manage the companies in a manner that protects our debt investment.
|
• |
Strong Competitive Position. We seek to invest in companies that have developed strong positions within their respective markets, are well positioned to capitalize on growth opportunities and compete in industries with barriers to entry. We also seek to invest in companies that exhibit a competitive advantage, which may help to protect their market position and profitability.
|
• |
Varied Customer and Supplier Bases. We prefer to invest in companies that have varied customer and supplier bases. Companies with varied customer and supplier bases are generally better able to endure economic downturns, industry consolidation and shifting customer preferences.
|
• |
Significant Invested Capital. We believe the existence of significant underlying equity value provides important support to investments. We seek to identify portfolio companies that we believe have well-structured capital beyond the layer of the capital structure in which we invest.
|
Investment Process
Our investment origination and portfolio monitoring activities are performed by Barings GPFG. Barings GPFG has an investment committee that is responsible for all aspects of the investment process. The investment committee is comprised of six members, including our Chief Executive Officer, Eric Lloyd and our President, Ian Fowler. The investment process is designed to maximize risk-adjusted returns, minimize non-performing assets and avoid investment losses. In addition, the investment process is also designed to provide sponsors and prospective portfolio companies with efficient and predictable deal execution.
9
Origination
Our origination process is summarized in the following chart:
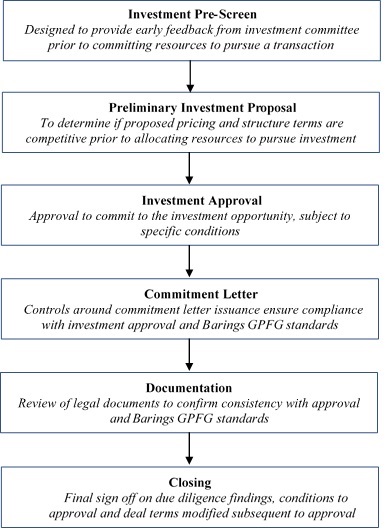
Investment Pre-Screen
The investment pre-screen process begins with a review of an offering memorandum or other high-level prospect information by an investment originator. A fundamental bottoms-up credit analysis is prepared and independent third-party research is gathered in addition to the information received from the sponsor. The investment group focuses on a prospective investment's fundamentals, sponsor/source and proposed investment structure. This review may be followed by a discussion between the investment originator and an investment group head to identify investment opportunities that should be passed on, either because they fall outside of Barings GPFG's stated investment strategy or offer an unacceptable risk-adjusted return. If the originator and investment group head agree that an investment opportunity is worth pursuing, a credit analyst assists the originator with preparation of a screening memorandum. The screening memorandum is discussed internally with the investment group head and other senior members of the investment group, and in certain instances, the investment group head may elect to review the screening memorandum with the investment committee prior to the preliminary investment proposal.
Preliminary Investment Proposal
Following the screening memorandum discussion, if the decision is made by the investment group head to pursue an investment opportunity, key pricing and structure terms may be communicated to the prospective borrower verbally or via a non-binding standard preliminary term sheet in order to determine whether the proposed terms are competitive.
Investment Approval
Upon acceptance by a sponsor/prospective borrower of preliminary key pricing and structure terms, the investment process continues with formal due diligence. The investment team attends meetings with the prospective portfolio company’s management, reviews historical and forecasted financial information and third-party diligence reports, conducts research to support preparation of proprietary financial models including both base case and downside scenarios, valuation analyses, and ultimately, an underwriting memorandum for review by the investment committee. In order for an investment to be made by us, the investment must be approved by a majority affirmative vote of the investment committee.
10
Commitment Letter
For investments that require written confirmation of commitment, commitment letters must be approved by Barings GPFG's general counsel. Commitment letters include customary conditions as well as any conditions specified by the investment committee. Such conditions could include, but are not limited to, specific confirmatory due diligence, minimum pre-close Adjusted EBITDA, minimum capitalization, satisfactory documentation, satisfactory legal due diligence and absence of material adverse change. Unless specified by the investment committee as a condition to approval, commitment letters need not include final investment committee approval as a condition precedent.
Documentation
Once an investment opportunity has been approved, negotiation of definitive legal documents occurs, usually simultaneously with completion of any third-party confirmatory due diligence. Typically, legal documentation will be reviewed by Barings GPFG’s general counsel or by outside legal counsel to ensure that our security interest can be perfected and that all other terms of the definitive loan documents are consistent with the terms approved by the investment committee.
Closing
Prior to closing, a closing memorandum is provided to the investment committee. The closing memorandum addresses final investment structure and pricing terms, the sources and uses of funds, any variances from the original approved terms, an update related to the prospect’s financial performance and, if warranted, updates to internal financial models. The closing memorandum also addresses each of the specific conditions to the approval of the investment by the investment committee, including results of confirmatory due diligence with any exceptions or abnormalities highlighted, and includes an analysis of financial covenants with a comparison to the financial forecast prepared by management.
Portfolio Management and Investment Monitoring
Our portfolio management and investment monitoring processes are overseen by Barings GPFG. Barings GPFG's portfolio management process is designed to maximize risk-adjusted returns and identify non-performing assets well in advance of potentially adverse events in order to mitigate investment losses. Key aspects of the Barings GPFG investment and portfolio management process include:
• |
Culture of Risk Management. The investment team that approves an investment monitors the investment's performance through repayment. We believe this practice encourages accountability by connecting investment team members with the long-term performance of the investment. This also allows us to leverage the underwriting process, namely the comprehensive understanding of the risk factors associated with the investment that an investment team develops during underwriting. In addition, we foster continuous interaction between investment teams and the investment committee. This frequent communication encourages the early escalation of issues to members of the investment committee to leverage their experience and expertise well in advance of potentially adverse events.
|
• |
Ongoing Monitoring. Each portfolio company is assigned to an analyst who is responsible for the ongoing monitoring of the investment. Upon receipt of information (financial or otherwise) relating to an investment, a preliminary review is performed by the analyst in order to assess whether the information raises any issues that require urgent attention. Particular consideration is given to information which may impact the value of an asset. In the event that something material is identified, the analyst is responsible for notifying the relevant members of the deal team and investment committee.
|
• |
Quarterly Portfolio Reviews. All investments are reviewed on at least a quarterly basis. The quarterly portfolio reviews provide a forum to evaluate the current status of each asset and identify any recent or long-term performance trends, either positive or negative, that may affect its current valuation.
|
• |
Watchlist Reviews. Certain credits are deemed to be on the “Watchlist” and are reviewed on a more frequent basis. These reviews typically occur monthly but can occur more or less frequently based on situational factors and the availability of updated information from the company. During these reviews, the investment team provides an update on the situation and discusses potential courses of action with the investment committee to ensure any mitigating steps are taken in a timely manner.
|
• |
Sponsor Relationships. We invest primarily in transactions backed by a private equity sponsor and when evaluating investment opportunities, we take into account the strength of the sponsor (e.g., track record,
|
11
sector expertise, strategy, governance, follow-on investment capacity, relationship with Barings GPFG). Having a strong relationship and staying in close contact with sponsors and management during not only the underwriting process but also throughout the life of the investment allows us to engage the sponsor and management early to address potential covenant breaks or other issues.
• |
Robust Investment and Portfolio Management System. Barings' investment and portfolio management system serves as the central repository of data used for investment management, including both company-level metrics (e.g., probability of default, EBITDA, geography) and asset-level metrics (e.g., price, spread/coupon, seniority). Barings GPFG portfolio management has established a required set of data that analysts must update quarterly, or more frequently when appropriate, in order to produce a one-page summary for each company, known as tearsheets, which are used during quarterly portfolio reviews.
|
Valuation Process and Determination of Net Asset Value
The most significant estimate inherent in the preparation of our financial statements is the valuation of investments and the related amounts of unrealized appreciation and depreciation of investments recorded. We have a valuation policy, as well as established and documented processes and methodologies for determining the fair values of portfolio company investments on a recurring (quarterly) basis in accordance with the 1940 Act and FASB ASC Topic 820, Fair Value Measurements and Disclosures ("ASC Topic 820"). Our current valuation policy and processes were established by Barings and were approved by the Board.
The fair value is the price that would be received to sell an asset or paid to transfer a liability in an orderly transaction between a willing buyer and a willing seller at the measurement date. For our portfolio securities, fair value is generally the amount that we might reasonably expect to receive upon the current sale of the security. The fair value measurement assumes that the sale occurs in the principal market for the security, or in the absence of a principal market, in the most advantageous market for the security. If no market for the security exists or if we do not have access to the principal market, the security should be valued based on the sale occurring in a hypothetical market.
Under ASC Topic 820, there are three levels of valuation inputs, as follows:
Level 1 Inputs – include quoted prices (unadjusted) in active markets for identical assets or liabilities.
Level 2 Inputs – include quoted prices for similar assets and liabilities in active markets, and inputs that are observable for the asset or liability, either directly or indirectly, for substantially the full term of the financial instrument.
Level 3 Inputs – include inputs that are unobservable and significant to the fair value measurement.
A financial instrument is categorized within the ASC Topic 820 valuation hierarchy based upon the lowest level of input to the valuation process that is significant to the fair value measurement. For example, a Level 3 fair value measurement may include inputs that are observable (Levels 1 and 2) and unobservable (Level 3). Therefore, unrealized appreciation and depreciation related to such investments categorized as Level 3 investments within the tables below may include changes in fair value that are attributable to both observable inputs (Levels 1 and 2) and unobservable inputs (Level 3).
Our investment portfolio includes certain debt and equity instruments of privately held companies for which quoted prices or other inputs falling within the categories of Level 1 and Level 2 are generally not available. In such cases, we determine the fair value of our investments in good faith primarily using Level 3 inputs. In certain cases, quoted prices or other observable inputs exist, and if so, we assess the appropriateness of the use of these third-party quotes in determining fair value based on (i) our understanding of the level of actual transactions used by the broker to develop the quote and whether the quote was an indicative price or binding offer and (ii) the depth and consistency of broker quotes and the correlation of changes in broker quotes with underlying performance of the portfolio company.
There is no single standard for determining fair value in good faith, as fair value depends upon the specific circumstances of each individual investment. The recorded fair values of our Level 3 investments may differ significantly from fair values that would have been used had an active market for the securities existed. In addition, changes in the market environment and other events that may occur over the life of the investments may cause the gains or losses ultimately realized on these investments to be different than the valuations currently assigned. For a discussion of the risks inherent in determining the value of securities for which readily available market values do not exist, see “Risk Factors — Risks Relating to Our Business and Structure — Our investment portfolio is and will
12
continue to be recorded at fair value as determined in good faith by our Board of Directors and, as a result, there is and will continue to be uncertainty as to the value of our portfolio investments” included in Item 1A of Part I of this Annual Report.
Investment Valuation Process Prior to the Transactions
Prior to the Transactions, our valuation process was led by our executive officers. The valuation process began with a quarterly review of each investment in our investment portfolio by our executive officers and our investment committee. Valuations of each portfolio security were then prepared by our investment professionals, who had direct responsibility for the origination, management and monitoring of each investment. Each investment valuation was subject to (i) a review by the lead investment officer responsible for the portfolio company investment and (ii) a peer review by a second investment officer or executive officer. Generally, any investment that was valued below cost was subjected to review by one of our executive officers. After the peer review was complete, we engaged two independent valuation firms, collectively referred to as the Valuation Firms, to provide third-party reviews of certain investments, as described further below. Finally, the Board had the responsibility for reviewing and approving, in good faith, the fair value of our investments in accordance with the 1940 Act.
The Valuation Firms provided third-party valuation consulting services to us which consisted of certain limited procedures that we identified and requested the Valuation Firms to perform (referred to herein as the "Procedures"). The Procedures were performed with respect to each portfolio company at least once in every calendar year and for new portfolio companies, at least once in the twelve-month period subsequent to the initial investment. In addition, the Procedures were generally performed with respect to a portfolio company when there was a significant change in the fair value of the investment. In certain instances, we determined that it was not cost-effective, and as a result was not in our stockholders’ best interest, to request the Valuation Firms to perform the Procedures on one or more portfolio companies. Such instances included, but were not limited to, situations where the fair value of the investment in the portfolio company was determined to be insignificant relative to the total investment portfolio. Upon completion of the Procedures, the Valuation Firms would reach a conclusion as to whether, with respect to each investment reviewed by each Valuation Firm, the fair value of those investments subjected to the Procedures appeared reasonable.
Investment Valuation Process Subsequent to the Transactions
Barings has established a Pricing Committee that is responsible for the approval, implementation and oversight of the processes and methodologies that relate to the pricing and valuation of assets we hold. Barings uses internal pricing models, in accordance with internal pricing procedures established by the Pricing Committee, to price an asset in the event an acceptable price cannot be obtained from an approved external source.
Barings reviews its valuation methodologies on an ongoing basis and updates are made accordingly to meet changes in the marketplace. Barings has established internal controls to ensure our validation process is operating in an effective manner. Barings (1) maintains valuation and pricing procedures that describe the specific methodology used for valuation and (2) approves and documents exceptions and overrides of valuations. In addition, the Pricing Committee performs an annual review of valuation methodologies.
Our money market fund investments are generally valued using Level 1 inputs and our syndicated senior secured loans are generally valued using Level 2 inputs. Our senior secured private middle-market debt investments will generally be valued using Level 3 inputs.
An independent valuation firm is engaged to perform the Procedures with respect to portfolio investments. The Procedures are generally performed with respect to each portfolio investment each quarter beginning in the quarter after the investment is made. In certain instances, we determine that it is not cost-effective, and as a result is not in our stockholders' best interest, to request independent valuation firms to perform the Procedures on certain portfolio investments. Such instances include, but are not limited to, situations where the fair value of the investment in the portfolio company is determined to be insignificant relative to the total investment portfolio. Finally, the Board has the responsibility for reviewing and approving, in good faith, the fair value of our investments in accordance with the 1940 Act.
We did not engage any independent valuation firms to perform the Procedures for the third quarter of 2018 as our investment portfolio consisted primarily of newly-originated investments. Beginning in the fourth quarter of 2018, we engaged an independent valuation firm to perform the Procedures noted above with respect to certain of our portfolio investments. For a further discussion of the Procedures both before and after the Transactions, see the section entitled “Critical Accounting Policies and Use of Estimates — Investment Valuation” included in
13
“Management’s Discussion and Analysis of Financial Condition and Results of Operations” included in Item 7 of Part II of this Annual Report.
Investment Valuation Inputs and Techniques
Currently, our valuation techniques are based upon both observable and unobservable pricing inputs. Observable inputs reflect market data obtained from independent sources, while unobservable inputs reflect our market assumptions. Our assessment of the significance of a particular input to the fair value measurement in its entirety requires judgment and considers factors specific to the financial instrument.
We determine the estimated fair value of our loans and investments using primarily an income approach. Generally, a vendor is the preferred source of pricing a loan, however, to the extent the vendor price is unavailable or not relevant and reliable, we may use broker quotes. We attempt to maximize the use of observable inputs and minimize the use of unobservable inputs. The availability of observable inputs can vary from investment to investment and is affected by a wide variety of factors, including the type of security, whether the security is new and not yet established in the marketplace, the liquidity of markets, and other characteristics particular to the security.
Enterprise Value Waterfall Approach
In valuing equity securities, we estimate fair value using an "Enterprise Value Waterfall" valuation model. We estimate the enterprise value of a portfolio company and then allocate the enterprise value to the portfolio company’s securities in order of their relative liquidation preference. In addition, the model assumes that any outstanding debt or other securities that are senior to our equity securities are required to be repaid at par. Generally, the waterfall proceeds flow from senior debt tranches of the capital structure to junior and subordinated debt, followed by each class or preferred stock and finally the common stock. Additionally, we may estimate the fair value of a debt security using the Enterprise Value Waterfall approach when we do not expect to receive full repayment.
To estimate the enterprise value of the portfolio company, we primarily use a valuation model based on a transaction multiple, which generally is the original transaction multiple, and measures of the portfolio company’s financial performance. In addition, we consider other factors, including but not limited to (i) offers from third parties to purchase the portfolio company, (ii) the implied value of recent investments in the equity securities of the portfolio company, (iii) publicly available information regarding recent sales of private companies in comparable transactions and (iv) when management believes there are comparable companies that are publicly traded, we perform a review of these publicly traded companies and the market multiple of their equity securities. For certain non-performing assets, we may utilize the liquidation or collateral value of the portfolio company's assets in our estimation of enterprise value.
The significant Level 3 inputs to the Enterprise Value Waterfall model are (i) an appropriate transaction multiple and (ii) a measure of the portfolio company’s financial performance, which generally is either Adjusted EBITDA, or revenues. Such inputs can be based on historical operating results, projections of future operating results or a combination thereof. The operating results of a portfolio company may be unaudited, projected or pro forma financial information and may require adjustments for certain non-recurring items. In determining the operating results input, we utilize the most recent portfolio company financial statements and forecasts available as of the valuation date. Management also consults with the portfolio company’s senior management to obtain updates on the portfolio company’s performance, including information such as industry trends, new product development, loss of customers and other operational issues. Additionally, we consider some or all of the following factors:
• |
financial standing of the issuer of the security; |
• |
comparison of the business and financial plan of the issuer with actual results; |
• |
the size of the security held; |
• |
pending reorganization activity affecting the issuer, such as merger or debt restructuring; |
• |
ability of the issuer to obtain needed financing; |
• |
changes in the economy affecting the issuer; |
• |
financial statements and reports from portfolio company senior management and ownership; |
• |
the type of security, the security’s cost at the date of purchase and any contractual restrictions on the disposition of the security; |
14
• |
information as to any transactions or offers with respect to the security and/or sales to third parties of similar securities; |
• |
the issuer’s ability to make payments and the type of collateral; |
• |
the current and forecasted earnings of the issuer; |
• |
statistical ratios compared to lending standards and to other similar securities; |
• |
pending public offering of common stock by the issuer of the security; |
• |
special reports prepared by analysts; and |
• |
any other factors we deem pertinent with respect to a particular investment. |
Fair value measurements using the Enterprise Value Waterfall model can be sensitive to changes in one or more of the inputs. Assuming all other inputs to the Enterprise Value Waterfall model remain constant, any increase (decrease) in either the transaction multiple, Adjusted EBITDA or revenues for a particular equity security would result in a higher (lower) fair value for that security.
Income Approach
Prior to the Externalization Transaction, in valuing debt securities, we utilized an "Income Approach" model that considered factors including, but not limited to, (i) the stated yield on the debt security, (ii) the portfolio company’s current Adjusted EBITDA as compared to the portfolio company’s historical or projected Adjusted EBITDA as of the date the investment was made and the portfolio company’s anticipated Adjusted EBITDA for the next twelve months of operations, (iii) the portfolio company’s current Leverage Ratio (defined as the portfolio company’s total indebtedness divided by Adjusted EBITDA) as compared to its Leverage Ratio as of the date the investment was made, (iv) publicly available information regarding current pricing and credit metrics for similar proposed and executed investment transactions of private companies and (v) when management believes a relevant comparison exists, current pricing and credit metrics for similar proposed and executed investment transactions of publicly traded debt. In addition, we used a risk rating system to estimate the probability of default on the debt securities and the probability of loss if there is a default. This risk rating system covered both qualitative and quantitative aspects of the business and the securities held.
We considered the factors above, particularly any significant changes in the portfolio company’s results of operations and leverage, and developed an expectation of the yield that a hypothetical market participant would require when purchasing the debt investment, which we refer to herein as the Required Rate of Return. The Required Rate of Return, along with the Leverage Ratio and Adjusted EBITDA, were the significant Level 3 inputs to the Income Approach model. For investments where the Leverage Ratio and Adjusted EBITDA had not fluctuated significantly from the date the investment was made or had not fluctuated significantly from management’s expectations as of the date the investment was made, and where there had been no significant fluctuations in the market pricing for such investments, we may have concluded that the Required Rate of Return was equal to the stated rate on the investment and therefore, the debt security was appropriately priced. In instances where we determined that the Required Rate of Return was different from the stated rate on the investment, we discounted the contractual cash flows on the debt instrument using the Required Rate of Return in order to estimate the fair value of the debt security.
Fair value measurements using the Income Approach model can be sensitive to changes in one or more of the inputs. Assuming all other inputs to the Income Approach model remain constant, any increase (decrease) in the Required Rate of Return or Leverage Ratio inputs for a particular debt security would result in a lower (higher) fair value for that security. Assuming all other inputs to the Income Approach model remain constant, any increase (decrease) in the Adjusted EBITDA input for a particular debt security would result in a higher (lower) fair value for that security.
Subsequent to the Transactions, we utilize a similar Income Approach model in valuing our private debt investment portfolio, which consists of middle-market senior secured loans with floating reference rates. As vendor and broker quotes have not historically been consistently relevant and reliable, the fair value is determined using an internal index-based pricing model that takes into account both the movement in the spread of a performing credit index as well as changes in the credit profile of the borrower. The implicit yield for each debt investment is calculated at the date the investment is made. This calculation takes into account the acquisition price (par less any upfront fee) and the relative maturity assumptions of the underlying asset. As of each balance sheet date, the implied yield for each investment is reassessed, taking into account changes in the discount margin of the baseline index,
15
probabilities of default and any changes in the credit profile of the issuer of the security, such as fluctuations in operating levels and leverage. If there is an observable price available on a comparable security/issuer, it is used to calibrate the internal model. The implied yield used within the model is considered a significant unobservable input. As such, these assets are generally classified within Level 3. If the valuation process for a particular debt investment results in a value above par, the value is typically capped at the greater of the principal amount plus any prepayment penalty in effect or 100% of par on the basis that a market participant is likely unwilling to pay a greater amount than that at which the borrower could refinance.
Market Approach
We value our syndicated senior secured loans using values provided by independent pricing services that have been approved by the Barings' Pricing Committee. The prices received from these pricing service providers are based on yields or prices of securities of comparable quality, type, coupon and maturity and/or indications as to value from dealers and exchanges. We seek to obtain two prices from the pricing services with one price representing the primary source and the other representing an independent control valuation. We evaluate the prices obtained from brokers or pricing vendors based on available market information, including trading activity of the subject or similar securities, or by performing a comparable security analysis to ensure that fair values are reasonably estimated. We also perform back-testing of valuation information obtained from pricing vendors and brokers against actual prices received in transactions. In addition to ongoing monitoring and back-testing, we perform due diligence procedures surrounding pricing vendors to understand their methodology and controls to support their use in the valuation process.
Quarterly Net Asset Value Determination
We determine the net asset value per share of our common stock on at least a quarterly basis, and more frequently if we are required to do so pursuant to an equity offering or pursuant to federal laws and regulations. The net asset value per share is equal to the value of our total assets minus total liabilities and any preferred stock outstanding divided by the total number of shares of common stock outstanding.
Managerial Assistance
As a BDC, we offer, and must provide upon request, managerial assistance to certain of our portfolio companies. This assistance typically involves, among other things, monitoring the operations of our portfolio companies, participating in board and management meetings, consulting with and advising officers of portfolio companies and providing other organizational and financial guidance. Barings provides such services on our behalf to portfolio companies that request this assistance. We may receive fees for these services.
Exit Strategies/Refinancing
While we generally exit most investments through the refinancing or repayment of our debt, we typically assist our portfolio companies in developing and planning exit opportunities, including any sale or merger of our portfolio companies. We may also assist in the structure, timing, execution and transition of these exit strategies.
Competition
We compete for investments with a number of investment funds including public funds, private equity funds, other BDCs, as well as traditional financial services companies such as commercial banks and other sources of financing. Some of these entities have greater financial and managerial resources than we do. In addition, some of our competitors may have higher risk tolerances or different risk assessments, which could allow them to consider more investments and establish more relationships than we do. Furthermore, many of our competitors are not subject to the regulatory restrictions that the 1940 Act imposes on us as a BDC.
We use the expertise of the investment professionals of Barings to assess investment risks and determine appropriate pricing for our investments in portfolio companies. We believe the relationship we have with Barings enables us to learn about, and compete for financing opportunities with companies in middle-market businesses that operate across a wide range of industries. For additional information concerning the competitive risks we face, see "Risk Factors — Risks Relating to Our Business and Structure — We operate in a highly competitive market for investment opportunities, which could reduce returns and result in losses" included in Item 1A of Part I of this Annual Report.
Brokerage Allocation and Other Practices
16
We did not pay any brokerage commissions during the three years ended December 31, 2018 in connection with the acquisition and/or disposal of our investments. We generally acquire and dispose of our investments in privately negotiated transactions; therefore, we infrequently use brokers in the normal course of our business. Barings is primarily responsible for the execution of any publicly traded securities portion of our portfolio transactions and the allocation of brokerage commissions. We do not expect to execute transactions through any particular broker or dealer, but will seek to obtain the best net results for us, taking into account such factors as price (including the applicable brokerage commission or dealer spread), size of order, difficulty of execution, and operational facilities of the firm and the firm’s risk and skill in positioning blocks of securities. While we will generally seek reasonably competitive trade execution costs, we will not necessarily pay the lowest spread or commission available. Subject to applicable legal requirements, if we use a broker, we may select a broker based partly upon brokerage or research services provided to us. In return for such services, we may pay a higher commission than other brokers would charge if we determine in good faith that such commission is reasonable in relation to the services provided.
Dividend Reinvestment Plan
We have adopted a dividend reinvestment plan that provides for reinvestment of our distributions on behalf of our common stockholders, unless a common stockholder elects to receive cash as provided below. As a result, if the Board authorizes, and we declare, a cash dividend, then our common stockholders who have not “opted out” of our dividend reinvestment plan will have their cash dividends automatically reinvested in additional shares of our common stock, rather than receiving the cash dividends.
No action will be required on the part of a registered common stockholder to have his or her cash dividend reinvested in shares of our common stock. A registered common stockholder may elect to receive an entire dividend in cash by notifying Computershare, Inc., the “Plan Administrator” and our transfer agent and registrar, in writing so that such notice is received by the Plan Administrator no later than the record date for dividends to common stockholders. The Plan Administrator will set up an account for shares acquired through the plan for each common stockholder who has not elected to receive dividends in cash and hold such shares in non-certificated form. Upon request by a common stockholder participating in the plan, received in writing not less than 10 days prior to the record date, the Plan Administrator will, instead of crediting shares to the participant’s account, issue a certificate registered in the participant’s name for the number of whole shares of our common stock and a check for any fractional share. Those common stockholders whose shares are held by a broker or other financial intermediary may receive dividends in cash by notifying their broker or other financial intermediary of their election.
We intend to use primarily newly issued shares to implement the plan, so long as our shares are trading at or above net asset value. If our shares are trading below net asset value, we intend to purchase shares in the open market in connection with our implementation of the plan. If we use newly issued shares to implement the plan, the number of shares to be issued to a common stockholder is determined by dividing the total dollar amount of the dividend payable to such common stockholder by the market price per share of our common stock at the close of regular trading on the NYSE on the dividend payment date. Market price per share on that date will be the closing price for such shares on the NYSE or, if no sale is reported for such day, at the average of their reported bid and asked prices. If we purchase shares in the open market to implement the plan, the number of shares to be issued to a common stockholder is determined by dividing the total dollar amount of the dividend payable to such common stockholder by the average price per share for all shares purchased by the Plan Administrator in the open market in connection with the dividend. The number of shares of our common stock to be outstanding after giving effect to payment of the dividend cannot be established until the value per share at which additional shares will be issued has been determined and elections of our common stockholders have been tabulated.
There will be no brokerage charges or other charges to common stockholders who participate in the plan. However, certain brokerage firms may charge brokerage charges or other charges to their customers. We will pay the Plan Administrator’s fees under the plan. If a participant elects by written notice to the Plan Administrator to have the Plan Administrator sell part or all of the shares held by the Plan Administrator in the participant’s account and remit the proceeds to the participant, the Plan Administrator is authorized to deduct a $15.00 transaction fee plus a $0.10 per share brokerage commission from the proceeds.
Common stockholders who receive dividends in the form of stock generally are subject to the same federal, state and local tax consequences as are common stockholders who elect to receive their dividends in cash. A common stockholder’s basis for determining gain or loss upon the sale of stock received in a dividend from us will be equal to the total dollar amount of the dividend payable to the common stockholder. Any stock received in a dividend will have a holding period for tax purposes commencing on the day following the day on which the shares
17
are credited to the U.S. common stockholder’s account. Stock received in a dividend may generate a wash sale if such shareholder sold out stock at a realized loss within 30 days either before or after such dividend.
Participants may terminate their accounts under the plan by notifying the Plan Administrator via its website at www.computershare.com/investor, by filling out the transaction request form located at the bottom of their statement and sending it to the Plan Administrator at Computershare, Inc., P.O. Box 505000, Louisville, Kentucky 40233 or by calling the Plan Administrator at (866) 228-7201.
We may terminate the plan upon notice in writing mailed to each participant at least 30 days prior to any record date for the payment of any dividend by us. All correspondence concerning the plan should be directed to the Plan Administrator by mail at Computershare, Inc., P.O. Box 505000, Louisville, Kentucky 40233.
Employees
The services necessary for our business are provided by individuals who are employees of Barings, pursuant to the terms of our Advisory Agreement and our Administration Agreement. Each of our executive officers is an employee of Barings and our day-to-day investment activities are managed by Barings. In addition, as of December 31, 2018, we employed two administrative professionals.
Management Agreements
On August 2, 2018, we entered into the Advisory Agreement and the Administration Agreement with Barings, an investment adviser registered under the Advisers Act. Our then-current board of directors unanimously approved the Advisory Agreement at an in-person meeting on March 22, 2018. Our stockholders approved the Advisory Agreement at the 2018 Special Meeting.
Advisory Agreement
Pursuant to the Advisory Agreement, Barings manages our day-to-day operations and provides us with investment advisory services. Among other things, Barings (i) determines the composition of our portfolio, the nature and timing of the changes therein and the manner of implementing such changes; (ii) identifies, evaluates and negotiates the structure of our investments; (iii) executes, closes, services and monitors the investments that we make; (iv) determines the securities and other assets that we will purchase, retain or sell; (v) performs due diligence on prospective portfolio companies and (vi) provides us with such other investment advisory, research and related services as we may, from time to time, reasonably require for the investment of our funds.
The Advisory Agreement provides that, absent fraud, willful misfeasance, bad faith or gross negligence in the performance of its duties or by reason of the reckless disregard of its duties and obligations, Barings, and its officers, managers, partners, agents, employees, controlling persons, members and any other person or entity affiliated with Barings (collectively, the "IA Indemnified Parties"), are entitled to indemnification from us for any damages, liabilities, costs, demands, charges, claims and expenses (including reasonable attorneys’ fees and amounts reasonably paid in settlement) incurred by the IA Indemnified Parties in or by reason of any pending, threatened or completed action, suit, investigation or other proceeding (including an action or suit by or in the right of us or our security holders) arising out of any actions or omissions or otherwise based upon the performance of any of Barings' duties or obligations under the Advisory Agreement or otherwise as our investment adviser.
Barings' services under the Advisory Agreement are not exclusive, and Barings is generally free to furnish similar services to other entities so long as its performance under the Advisory Agreement is not adversely affected.
Under the Advisory Agreement, we pay Barings (i) a base management fee (the "Base Management Fee") and (ii) an incentive fee (the "Incentive Fee") as compensation for the investment advisory and management services it provides us thereunder.
Base Management Fee
The Base Management Fee is calculated based on our gross assets, including assets purchased with borrowed funds or other forms of leverage and excluding cash and cash equivalents, at an annual rate of:
• |
1.0% for the period from August 2, 2018 through December 31, 2018; |
• |
1.125% for the period commencing on January 1, 2019 through December 31, 2019; and |
• |
1.375% for all periods thereafter. |
18
The Base Management Fee is payable quarterly in arrears on a calendar quarter basis. The Base Management Fee is calculated based on the average value of our gross assets, excluding cash and cash equivalents, at the end of the two most recently completed calendar quarters prior to the quarter for which such fees are being calculated. Base Management Fees for any partial month or quarter are appropriately pro-rated.
Incentive Fee
The Incentive Fee is comprised of two parts: (1) a portion based on our pre-incentive fee net investment income (the "Income-Based Fee") and (2) a portion based on the net capital gains received on our portfolio of securities on a cumulative basis for each calendar year, net of all realized capital losses and all unrealized capital depreciation for that same calendar year (the "Capital Gains Fee").
The Income-Based Fee is calculated as follows:
(i) |
For each quarter from and after August 2, 2018 through December 31, 2019 (the "Pre-2020 Period"), the Income-Based Fee is calculated and payable quarterly in arrears based on the Pre-Incentive Fee Net Investment Income for the immediately preceding calendar quarter for which such fees are being calculated. In respect of the Pre-2020 Period, "Pre-Incentive Fee Net Investment Income" means interest income, dividend income and any other income (including any other fees, such as commitment, origination, structuring, diligence, managerial assistance and consulting fees or other fees that we receive from portfolio companies) accrued during the relevant calendar quarter, minus our operating expenses for such quarter (including the Base Management Fee, expenses payable under the Administration Agreement, any interest expense and any dividends paid on any issued and outstanding preferred stock, but excluding the Incentive Fee). Pre-Incentive Fee Net Investment Income includes, in the case of investments with a deferred interest feature (such as original issue discount, debt instruments with payment-in-kind interest and zero coupon securities), accrued income not yet received in cash. Pre-Incentive Fee Net Investment Income does not include any realized capital gains, realized capital losses or unrealized capital appreciation or depreciation. |
(ii) |
For each quarter beginning on and after January 1, 2020 (the "Post-2019 Period"), the Income-Based Fee will be calculated and payable quarterly in arrears based on the Pre-Incentive Fee Net Investment Income for the immediately preceding calendar quarter and the eleven preceding calendar quarters (or such fewer number of preceding calendar quarters counting each calendar quarter beginning on or after January 1, 2020) (each such period will be referred to as the "Trailing Twelve Quarters") for which such fees are being calculated and will be payable promptly following the filing of the Company’s financial statements for such quarter. In respect of the Post-2019 Period, "Pre-Incentive Fee Net Investment Income" means interest income, dividend income and any other income (including any other fees, such as commitment, origination, structuring, diligence, managerial assistance and consulting fees or other fees that we receive from portfolio companies) accrued during the relevant Trailing Twelve Quarters, minus our operating expenses for such Trailing Twelve Quarters (including the Base Management Fee, expenses payable under the Administration Agreement, any interest expense and any dividends paid on any issued and outstanding preferred stock, but excluding the Incentive Fee) divided by the number of quarters that comprise the relevant Trailing Twelve Quarters. Pre-Incentive Fee Net Investment Income includes, in the case of investments with a deferred interest feature (such as original issue discount, debt instruments with payment-in-kind interest and zero coupon securities), accrued income not yet received in cash. Pre-Incentive Fee Net Investment Income does not include any realized capital gains, realized capital losses or unrealized capital appreciation or depreciation. |
(iii) |
Pre-Incentive Fee Net Investment Income, expressed as a rate of return on the value of our net assets (defined as total assets less senior securities constituting indebtedness and preferred stock) at the end of the calendar quarter for which such fees are being calculated, is compared to a "hurdle rate", expressed as a rate of return on the value of our net assets at the end of the most recently completed calendar quarter, of 2% per quarter (8% annualized). We pay Barings the Income-Based Fee with respect to our Pre-Incentive Fee Net Investment Income in each calendar quarter as follows: |
(1) |
(a) With respect to the Pre-2020 Period, no Income-Based Fee for any calendar quarter in which our Pre-Incentive Fee Net Investment Income (as defined in paragraph (i) above) does not exceed the hurdle rate; |
19
(b) With respect to the Post-2019 Period, no Income-Based Fee for any calendar quarter in which our Pre-Incentive Fee Net Investment Income (as defined in paragraph (ii) above) does not exceed the hurdle rate;
(2) |
(a) With respect to the Pre-2020 Period, 100% of our Pre-Incentive Fee Net Investment Income (as defined in paragraph (i) above) for any calendar quarter with respect to that portion of the Pre-Incentive Fee Net Investment Income for such quarter, if any, that exceeds the hurdle rate but is less than 2.5% (10% annualized) (the "Pre-2020 Catch-Up Amount"). The Pre-2020 Catch-Up Amount is intended to provide Barings with an incentive fee of 20% on all of our Pre-Incentive Fee Net Investment Income (as defined in paragraph (i) above) when our Pre-Incentive Fee Net Investment Income (as defined in paragraph (i) above) reaches 2% per quarter (8% annualized); |
(b) With respect to the Post-2019 Period, 100% of our Pre-Incentive Fee Net Investment Income (as defined in paragraph (ii) above) with respect to that portion of the Pre-Incentive Fee Net Investment Income (as defined in paragraph (ii) above), if any, that exceeds the hurdle rate but is less than 2.5% (10% annualized) (the "Post-2019 Catch-Up Amount"). The Post-2019 Catch-Up Amount is intended to provide Barings with an incentive fee of 20% on all of our Pre-Incentive Fee Net Investment Income (as defined in paragraph (ii) above) when our Pre-Incentive Fee Net Investment Income (as defined in paragraph (ii) above) reaches 2% per quarter (8% annualized);
(3) |
(a) With respect to the Pre-2020 Period, 20% of the amount of our Pre-Incentive Fee Net Investment Income (as defined in paragraph (i) above) for any calendar quarter with respect to that portion of the Pre-Incentive Fee Net Investment Income (as defined in paragraph (i) above) for such quarter, if any, that exceeds the Pre-2020 Catch-Up Amount; and |
(b) With respect to the Post-2019 Period, 20% of the amount of our Pre-Incentive Fee Net Investment Income (as defined in paragraph (ii) above) for any calendar quarter with respect to that portion of the Pre-Incentive Fee Net Investment Income (as defined in paragraph (ii) above), if any, that exceeds the Post-2019 Catch-Up Amount.
However, with respect to the Post-2019 Period, the Income-Based Fee paid to Barings will not be in excess of the Incentive Fee Cap. With respect to the Post-2019 Period, the "Incentive Fee Cap" for any quarter is an amount equal to (a) 20% of the Cumulative Net Return (as defined below) during the relevant Trailing Twelve Quarters minus (b) the aggregate Income-Based Fee that was paid in respect of the first eleven calendar quarters (or the portion thereof) included in the relevant Trailing Twelve Quarters.
Cumulative Net Return means (x) the aggregate net investment income in respect of the relevant Trailing Twelve Quarters minus (y) any Net Capital Loss (as defined below), if any, in respect of the relevant Trailing Twelve Quarters. If, in any quarter, the Incentive Fee Cap is zero or a negative value, we pay no Income-Based Fee to Barings for such quarter. If, in any quarter, the Incentive Fee Cap for such quarter is a positive value but is less than the Income-Based Fee that is payable to Barings for such quarter (before giving effect to the Incentive Fee Cap) calculated as described above, we pay an Income-Based Fee to Barings equal to the Incentive Fee Cap for such quarter. If, in any quarter, the Incentive Fee Cap for such quarter is equal to or greater than the Income-Based Fee that is payable to Barings for such quarter (before giving effect to the Incentive Fee Cap) calculated as described above, we pay an Income-Based Fee to Barings equal to the Income-Based Fee calculated as described above for such quarter without regard to the Incentive Fee Cap.
Net Capital Loss in respect of a particular period means the difference, if positive, between (i) aggregate capital losses, whether realized or unrealized, in such period and (ii) aggregate capital gains, whether realized or unrealized, in such period.
The Capital Gains Fee will be determined and payable in arrears as of the end of each calendar year (or upon termination of the Advisory Agreement), commencing with the calendar year ending on December 31, 2018, and is calculated at the end of each applicable year by subtracting (1) the sum of our cumulative aggregate realized capital losses and aggregate unrealized capital depreciation from (2) our cumulative aggregate realized capital gains, in each case calculated from August 2, 2018. If such amount is positive at the end of such year, then the Capital Gains Fee payable for such year is equal to 20% of such amount, less the cumulative aggregate amount of Capital Gains Fees paid in all prior years. If such amount is negative, then there is no Capital Gains Fee payable for such year. If the Advisory Agreement is terminated as of a date that is not a calendar year end, the termination date will be treated as though it were a calendar year end for purposes of calculating and paying a Capital Gains Fee.
20
Payment of Company Expenses
Under the Advisory Agreement, all investment professionals of Barings and its staff, when and to the extent engaged in providing services required to be provided by Barings under the Advisory Agreement, and the compensation and routine overhead expenses of such personnel allocable to such services, are provided and paid for by Barings and not by us, except that all costs and expenses of its operations and transactions, including, without limitation, those items listed in the Advisory Agreement, will be borne by us.
Duration and Termination of Advisory Agreement
The Advisory Agreement has an initial term of two years. Thereafter, it will continue to renew automatically for successive annual periods so long as such continuance is specifically approved at least annually by: (i) the vote of the Board, or by the vote of stockholders holding a majority of our outstanding voting securities; and (ii) the vote of a majority of our independent directors, in either case, in accordance with the requirements of the 1940 Act. The Advisory Agreement may be terminated at any time, without the payment of any penalty, upon 60 days’ written notice, by: (a) by vote of a majority of the Board or by vote of a majority of our outstanding voting securities (as defined in the 1940 Act); or (b) Barings. Furthermore, the Advisory Agreement will automatically terminate in the event of its "assignment" (as such term is defined for purposes of Section 15(a)(4) of the 1940 Act).
Administration Agreement
Under the terms of the Administration Agreement, Barings performs (or oversees, or arranges for, the performance of) the administrative services necessary for our operation, including, but not limited to, office facilities, equipment, clerical, bookkeeping and record-keeping services at such office facilities and such other services as Barings, subject to review by the Board, from time to time, determines to be necessary or useful to perform its obligations under the Administration Agreement. Barings also, on our behalf and subject to the Board’s approval, arranges for the services of, and oversees, custodians, depositories, transfer agents, dividend disbursing agents, other stockholder servicing agents, accountants, attorneys, underwriters, brokers and dealers, corporate fiduciaries, insurers, banks and such other persons in any such other capacity deemed to be necessary or desirable.
We are required to reimburse Barings for the costs and expenses incurred and billed to us by Barings in performing its obligations and providing personnel and facilities under the Administration Agreement, or such lesser amount as may be agreed to in writing by us and Barings from time to time. If we and Barings agree to a reimbursement amount for any period which is less than the full amount otherwise permitted under the Administration Agreement, then Barings will not be entitled to recoup any difference thereof in any subsequent period or otherwise. The costs and expenses incurred by Barings on our behalf under the Administration Agreement include, but are not limited to:
• |
the allocable portion of Barings' rent for our Chief Financial Officer and Chief Compliance Officer and their respective staffs, which is based upon the allocable portion of the usage thereof by such personnel in connection with their performance of administrative services under the Administration Agreement; |
• |
the allocable portion of the salaries, bonuses, benefits and expenses of our Chief Financial Officer and Chief Compliance Officer and their respective staffs, which is based upon the allocable portion of the time spent by such personnel in connection with performing administrative services for us under the Administration Agreement; |
• |
the actual cost of goods and services used for us and obtained by Barings from entities not affiliated with us, which is reasonably allocated to us on the basis of assets, revenues, time records or other methods conforming with generally accepted accounting principles; |
• |
all fees, costs and expenses associated with the engagement of a sub-administrator, if any; and |
• |
costs associated with (a) the monitoring and preparation of regulatory reporting, including registration statements and amendments thereto, prospectus supplements, and tax reporting, (b) the coordination and oversight of service provider activities and the direct cost of such contractual matters related thereto and (c) the preparation of all financial statements and the coordination and oversight of audits, regulatory inquiries, certifications and sub-certifications. |
The Administration Agreement has an initial term of two years, and thereafter will continue automatically for successive annual periods so long as such continuance is specifically approved at least annually by the Board,
21
including a majority of the independent directors. The Administration Agreement may be terminated at any time, without the payment of any penalty, by vote of our directors, or by Barings, upon 60 days’ written notice to the other party. The Administration Agreement may not be assigned by a party without the consent of the other party.
Election to be Regulated as a Business Development Company and Regulated Investment Company
Both we and Triangle SBIC individually are closed-end, non-diversified management investment companies that have elected to be treated as BDCs under the 1940 Act. In addition, we have elected to be treated as a RIC under Subchapter M of the Code. Our election to be regulated as a BDC and our election to be treated as a RIC for U.S. federal income tax purposes have a significant impact on our operations. Some of the most important effects on our operations of our election to be regulated as a BDC and our election to be treated as a RIC are outlined below.
• |
We report our investments at market value or fair value with changes in value reported through our consolidated statements of operations. |
In accordance with the requirements of Article 6 of Regulation S-X, we report all of our investments, including debt investments, at market value or, for investments that do not have a readily available market value, at their “fair value” as determined in good faith by the Board. Changes in these values are reported through our statements of operations under the caption of “net unrealized appreciation (depreciation) of investments.” See “Valuation Process and Determination of Net Asset Value” above.
• |
We intend to distribute substantially all of our income to our stockholders. We generally will be required to pay income taxes only on the portion of our taxable income we do not distribute, actually or constructively, to stockholders. |
As a RIC, so long as we meet certain minimum distribution, source-of-income and asset diversification requirements, we generally are required to pay U.S. federal income taxes only on the portion of our taxable income and gains we do not distribute (actually or constructively) and certain built-in gains. We intend to distribute to our stockholders substantially all of our income. We may, however, make deemed distributions to our stockholders of any retained net long-term capital gains. If this happens, our stockholders will be treated as if they received an actual distribution of the net capital gains and reinvested the net after-tax proceeds in us. Our stockholders also may be eligible to claim a tax credit (or, in certain circumstances, a tax refund) equal to their allocable share of the corporate-level U.S. federal income tax we pay on the deemed distribution. See “Material U.S. Federal Income Tax Considerations.” We met the minimum distribution requirements for 2016, 2017 and 2018 and continually monitor our distribution requirements with the goal of ensuring compliance with the Code.
In addition, we have one wholly-owned taxable subsidiary, or the Taxable Subsidiary, which holds a portion of one or more of our portfolio investments that are listed on the Consolidated Schedule of Investments. The Taxable Subsidiary is consolidated for financial reporting purposes in accordance with U.S. GAAP, so that our consolidated financial statements reflect our investments in the portfolio companies owned by the Taxable Subsidiary. The purpose of the Taxable Subsidiary is to permit us to hold certain interests in portfolio companies that are organized as partnerships or limited liability companies, or LLCs (or other forms of pass-through entities) and still satisfy the RIC tax requirement that at least 90.0% of our gross income for U.S. federal income tax purposes must consist of qualifying investment income. Absent the Taxable Subsidiary, a proportionate amount of any gross income of a partnership or LLC (or other pass-through entity) portfolio investment would flow through directly to us. To the extent that such income did not consist of investment income, it could jeopardize our ability to qualify as a RIC and therefore cause us to incur significant amounts of corporate-level U.S. federal income taxes. Where interests in partnerships or LLCs (or other pass-through entities) are owned by the Taxable Subsidiary, however, the income from such interests is taxed to the Taxable Subsidiary and does not flow through to us, thereby helping us preserve our RIC status and resultant tax advantages. The Taxable Subsidiary is not consolidated for U.S. federal income tax purposes and may generate income tax expense as a result of its ownership of the portfolio companies. This income tax expense, if any, is reflected in our Statement of Operations.
• |
Our ability to use leverage as a means of financing our portfolio of investments is limited. |
As a BDC, and as a result of the stockholder vote to approve the proposal to authorize us to be subject to the reduced asset coverage ratio of at least 150% under the 1940 Act, we are required to meet a coverage ratio of total assets to total senior securities of at least 150%. For this purpose, senior securities include all borrowings and any preferred stock we may issue in the future. Additionally, our ability to continue to utilize leverage as a means of financing our portfolio of investments may be limited by this asset coverage test.
22
• |
We are required to comply with the provisions of the 1940 Act applicable to business development companies. |
As a BDC, we are required to have a majority of directors who are not “interested” persons under the 1940 Act. In addition, we are required to comply with other applicable provisions of the 1940 Act, including those requiring the adoption of a code of ethics, fidelity bonding and investment custody arrangements. See “Regulation of Business Development Companies” below.
Exemptive Relief
As a BDC, we are required to comply with certain regulatory requirements. For example, we generally are not permitted to make loans to companies controlled by Barings or other funds managed by Barings. We are also not permitted to make any co-investments with Barings or its affiliates (including any fund managed by Barings or an investment adviser controlling, controlled by or under common control with Barings) without exemptive relief from the SEC, subject to certain exceptions. The Exemptive Relief that the SEC has granted to Barings permits certain present and future funds, including us, advised by Barings (or an investment adviser controlling, controlled by or under common control with Barings) to co-invest in suitable negotiated investments. Co-investments made under the Exemptive Relief are subject to compliance with the conditions and other requirements contained in the Exemptive Relief, which could limit our ability to participate in a co-investment transaction.
Regulation of Business Development Companies
The following is a general summary of the material regulatory provisions affecting BDCs. It does not purport to be a complete description of all of the laws and regulations affecting BDCs.
Both we and Triangle SBIC individually have elected to be regulated as BDCs under the 1940 Act. The 1940 Act contains prohibitions and restrictions relating to transactions between BDCs and their affiliates, principal underwriters and affiliates of those affiliates or underwriters. The 1940 Act requires that a majority of the directors be persons other than “interested persons,” as that term is defined in the 1940 Act. In addition, the 1940 Act provides that we may not change the nature of our business so as to cease to be, or to withdraw our election as, a BDC unless approved by a majority of our outstanding voting securities.
In addition, the 1940 Act defines “a majority of the outstanding voting securities” as the lesser of (i) 67.0% or more of the voting securities present at a meeting if the holders of more than 50.0% of our outstanding voting securities are present or represented by proxy, or (ii) 50.0% of our voting securities.
Qualifying Assets
Under the 1940 Act, a BDC may not acquire any asset other than assets of the type listed in Section 55(a) of the 1940 Act, which are referred to as qualifying assets, unless, at the time the acquisition is made, qualifying assets represent at least 70.0% of the company’s total assets. The principal categories of qualifying assets relevant to our business are any of the following:
(1) Securities purchased in transactions not involving any public offering from the issuer of such securities, which issuer (subject to certain limited exceptions) is an eligible portfolio company, or from any person who is, or has been during the preceding 13 months, an affiliated person of an eligible portfolio company, or from any other person, subject to such rules as may be prescribed by the SEC. An eligible portfolio company is defined in the 1940 Act and rules adopted pursuant thereto as any issuer which:
(a) is organized under the laws of, and has its principal place of business in, the United States;
(b) is not an investment company (other than an SBIC wholly-owned by the BDC) or a company that would be an investment company but for exclusions under the 1940 Act for certain financial companies such as banks, brokers, commercial finance companies, mortgage companies and insurance companies; and
(c) satisfies any of the following:
(i) does not have any class of securities with respect to which a broker or dealer may extend margin credit;
(ii) is controlled by a BDC or a group of companies including a BDC and the BDC has an affiliated person who is a director of the eligible portfolio company;
23
(iii) is a small and solvent company having total assets of not more than $4.0 million and capital and surplus of not less than $2.0 million;
(iv) does not have any class of securities listed on a national securities exchange; or
(v) has a class of securities listed on a national securities exchange, but has an aggregate market value of outstanding voting and non-voting common equity of less than $250.0 million.
(2) Securities in companies that were eligible portfolio companies when we made our initial investment if certain other requirements are satisfied.
(3) Securities of any eligible portfolio company that we control.
(4) Securities purchased in a private transaction from a U.S. issuer that is not an investment company or from an affiliated person of the issuer, or in transactions incident thereto, if the issuer is in bankruptcy and subject to reorganization or if the issuer, immediately prior to the purchase of its securities, was unable to meet its obligations as they came due without material assistance (other than conventional lending or financing arrangements).
(5) Securities of an eligible portfolio company purchased from any person in a private transaction if there is no ready market for such securities and we already own 60.0% of the outstanding equity of the eligible portfolio company.
(6) Securities received in exchange for or distributed on or with respect to securities described in (1) through (5) above, or pursuant to the exercise of warrants or rights relating to such securities.
(7) Cash, cash equivalents, U.S. government securities or high-quality debt securities maturing in one year or less from the time of investment.
In addition, a BDC must have been organized and have its principal place of business in the United States and must be operated for the purpose of making investments in the types of securities described in (1), (2), (3) or (4) above.
Managerial Assistance to Portfolio Companies
In order to count portfolio securities as qualifying assets for the purpose of the 70.0% test, we must either control the issuer of the securities or must offer to make available to the issuer of the securities (other than small and solvent companies described above) significant managerial assistance; except that, where we purchase such securities in conjunction with one or more other persons acting together, one of the other persons in the group may make available such managerial assistance. Making available “significant managerial assistance” means, among other things, any arrangement whereby we, through our directors, officers or employees, offer to provide, and, if accepted, do so provide, significant guidance and counsel concerning the management, operations or business objectives and policies of a portfolio company. Barings provides such managerial assistance on our behalf to portfolio companies that request this assistance. We may receive fees for these services.
Temporary Investments
Pending investment in other types of “qualifying assets,” as described above, our investments may consist of cash, cash equivalents, U.S. government securities or high-quality debt securities maturing in one year or less from the time of investment, which we refer to, collectively, as temporary investments, so that 70.0% of our assets are qualifying assets. We may invest in U.S. Treasury bills or in repurchase agreements, provided that such agreements are fully collateralized by cash or securities issued by the U.S. Government or its agencies. A repurchase agreement involves the purchase by an investor, such as us, of a specified security and the simultaneous agreement by the seller to repurchase it at an agreed-upon future date and at a price that is greater than the purchase price by an amount that reflects an agreed-upon interest rate. There is no percentage restriction on the proportion of our assets that may be invested in such repurchase agreements. However, if more than 25.0% of our total assets constitute repurchase agreements from a single counterparty, we would not meet the asset diversification tests required to maintain our tax treatment as a RIC for U.S. federal income tax purposes. Thus, we do not intend to enter into repurchase agreements with a single counterparty in excess of this limit. Our management team will monitor the creditworthiness of the counterparties with which we enter into repurchase agreement transactions.
24
Senior Securities
The Small Business Credit Availability Act (“SBCAA”), which was signed into law on March 23, 2018, among other things, amended Section 61(a) of the 1940 Act to add a new Section 61(a)(2) that reduces the asset coverage requirement applicable BDCs from 200% to 150% so long as the BDC meets certain disclosure requirements and obtains certain approvals. On July 24, 2018, our stockholders voted at the 2018 Special Meeting to approve a proposal to authorize us to be subject to a reduced asset coverage ratio of at least 150% under the 1940 Act. As a result of the stockholder approval at the 2018 Special Meeting, effective July 25, 2018, our applicable asset coverage ratio under the 1940 Act decreased to 150% from 200%. Thus, we are permitted, under specified conditions, to issue multiple classes of debt and one class of stock senior to our common stock if our asset coverage, as defined in the 1940 Act, is at least equal to 150% immediately after each such issuance. In addition, while any senior securities remain outstanding (other than senior securities representing indebtedness issued in consideration of a privately arranged loan which is not intended to be publicly distributed), we must make provisions to prohibit any distribution to our stockholders or the repurchase of such securities or shares unless we meet the applicable asset coverage ratios at the time of the distribution or repurchase. We may also borrow amounts up to 5.0% of the value of our total assets for temporary or emergency purposes without regard to asset coverage. For a discussion of the risks associated with leverage, see “Risk Factors — Risks Relating to Our Business and Structure — Because we intend to distribute substantially all of our income to our stockholders to maintain our tax treatment as a regulated investment company, we will continue to need additional capital to finance our growth and regulations governing our operation as a business development company will affect our ability to, and the way in which we, raise additional capital and make distributions” included in Item 1A of Part I of this Annual Report.
Code of Business Conduct and Ethics and Corporate Governance Guidelines
We and Barings have adopted a code of ethics (the “Global Code of Ethics Policy”) and corporate governance guidelines, which collectively cover ethics and business conduct. These documents apply to our and Barings' directors, officers and employees, including our principal executive officer, principal financial officer, principal accounting officer or controller, and any person performing similar functions, and establish procedures for personal investments and restrict certain personal securities transactions. Personnel subject to the Global Code of Ethics Policy and corporate governance guidelines may invest in securities for their personal investment accounts, including securities that may be purchased or held by us, so long as such investments are made in accordance with the code's requirements. Our Global Code of Ethics Policy and corporate governance guidelines are publicly available on the Investor Relations section of our website under "Corporate Governance" at https://ir.barings.com/governance-docs. We will report any amendments to or waivers of a required provision of our Global Code of Ethics Policy and corporate governance guidelines on our website or in a Current Report on Form 8-K. Information contained on our website is not incorporated by reference into this Annual Report on Form 10-K, and you should not consider that information to be part of this Annual Report on Form 10-K.
Compliance Policies and Procedures
We and Barings have adopted and implemented written policies and procedures reasonably designed to prevent violation of the U.S. federal securities laws, and are required to review these compliance policies and procedures annually for their adequacy and the effectiveness of their implementation, and to designate a chief compliance officer to be responsible for administering such policies and procedures. Melissa LaGrant serves as our Chief Compliance Officer.
Proxy Voting Policies and Procedures
We delegate our proxy voting responsibilities to Barings. Barings votes proxies relating to our portfolio securities in a manner which we believe will be in the best interest of our stockholders. Barings reviews on a case-by-case basis each proposal submitted to a stockholder vote to determine its impact on the portfolio securities held by us. Although Barings generally votes against proposals that may have a negative impact on our portfolio securities, they may vote for such a proposal if there exists compelling long-term reasons to do so.
The proxy voting decisions of Barings are made by the investment professionals who are responsible for monitoring each of its clients’ investments. To ensure that their vote is not the product of a conflict of interest, Barings requires that: (i) anyone involved in the decision making process disclose to our chief compliance officer any potential conflict that he or she is aware of and any contact that he or she has had with any interested party regarding a proxy vote; and (ii) employees involved in the decision making process or vote administration are prohibited from revealing how we intend to vote on a proposal in order to reduce any attempted influence from interested parties.
25
Stockholders may, without charge, obtain information regarding how we voted proxies with respect to our portfolio securities by making a written request for proxy voting information to: Chief Compliance Officer, 300 South Tryon Street, Suite 2500, Charlotte, North Carolina 28202 or by calling our investor relations department at 888-401-1088.
Other
We may also be prohibited under the 1940 Act from knowingly participating in certain transactions with our affiliates without the prior approval of those members of the Board who are not interested persons and, in some cases, prior approval by the SEC. The 1940 Act prohibits us from making certain negotiated co-investments with affiliates unless we receive an order from the SEC permitting us to do so. Barings' existing Exemptive Relief permits us and Barings' affiliated private funds and SEC-registered funds to co-invest in loans originated by Barings, which allows Barings to implement its senior secured private debt investment strategy for us on an accelerated timeline.
We are periodically examined by the SEC for compliance with the 1940 Act.
We are required to provide and maintain a bond issued by a reputable fidelity insurance company to protect us against larceny and embezzlement. Furthermore, as a BDC, we are prohibited from protecting any director or officer against any liability to us or our stockholders arising from willful misfeasance, bad faith, gross negligence or reckless disregard of the duties involved in the conduct of such person’s office.
We and Barings are required to adopt and implement written policies and procedures reasonably designed to prevent violation of the federal securities laws, review these policies and procedures annually for their adequacy and the effectiveness of their implementation, and to designate a chief compliance officer to be responsible for administering the policies and procedures. See “Compliance Policies and Procedures" above.
Securities Exchange Act of 1934 and Sarbanes-Oxley Act Compliance
We are subject to the reporting and disclosure requirements of the Exchange Act, including the filing of quarterly, annual and current reports, proxy statements and other required items. In addition, we are subject to the Sarbanes-Oxley Act of 2002 (the "Sarbanes-Oxley Act"), which imposes a wide variety of regulatory requirements on publicly-held companies and their insiders. For example:
• |
pursuant to Rule 13a-14 of the Exchange Act, our Chief Executive Officer and Chief Financial Officer are required to certify the accuracy of the financial statements contained in our periodic reports; |
• |
pursuant to Item 307 of Regulation S-K, our periodic reports are required to disclose our conclusions about the effectiveness of our disclosure controls and procedures; |
• |
pursuant to Rule 13a-15 of the Exchange Act, our management is required to prepare a report regarding its assessment of our internal control over financial reporting, and separately, our independent registered public accounting firm audits our internal controls over financial reporting; and |
• |
pursuant to Item 308 of Regulation S-K and Rule 13a-15 of the Exchange Act, our periodic reports must disclose whether there were significant changes in our internal control over financial reporting or in other factors that could significantly affect these controls subsequent to the date of their evaluation, including any corrective actions with regard to significant deficiencies and material weaknesses. |
The New York Stock Exchange Corporate Governance Regulations
The NYSE has adopted corporate governance regulations that listed companies must comply with. We believe we currently are in compliance with such corporate governance listing standards. We intend to monitor our compliance with all future listing standards and to take all necessary actions to ensure that we stay in compliance.
26
Material U.S. Federal Income Tax Considerations
The following discussion is a general summary of the material U.S. federal income tax considerations applicable to us and to an investment in our shares. This summary does not purport to be a complete description of the income tax considerations applicable to us or to investors in such an investment. For example, we have not described tax consequences that we assume to be generally known by investors or certain considerations that may be relevant to certain types of holders subject to special treatment under U.S. federal income tax laws, including stockholders subject to the alternative minimum tax, tax-exempt organizations, insurance companies, dealers in securities, pension plans and trusts, financial institutions, U.S. stockholders (as defined below) whose functional currency is not the U.S. dollar, persons who mark-to-market our shares and persons who hold our shares as part of a “straddle,” “hedge” or “conversion” transaction. This summary assumes that investors hold shares of our common stock as capital assets (within the meaning of the Code). The discussion is based upon the Code, Treasury regulations, and administrative and judicial interpretations, each as of the date of this Annual Report on Form 10-K and all of which are subject to change, possibly retroactively, which could affect the continuing validity of this discussion. This summary does not discuss any aspects of U.S. estate or gift tax or foreign, state or local tax. It does not discuss the special treatment under U.S. federal income tax laws that could result if we invested in tax-exempt securities or certain other investment assets.
For purposes of our discussion, a “U.S. stockholder” means a beneficial owner of shares of our common stock that is for U.S. federal income tax purposes:
• |
a citizen or individual resident of the United States; |
• |
a corporation, or other entity treated as a corporation for U.S. federal income tax purposes, created or organized in or under the laws of the United States or any state thereof or the District of Columbia; |
• |
an estate, the income of which is subject to U.S. federal income taxation regardless of its source; or |
• |
a trust if (i) a U.S. court is able to exercise primary supervision over the administration of such trust and one or more U.S. persons have the authority to control all substantial decisions of the trust or (ii) it has a valid election in place to be treated as a U.S. person. |
For purposes of our discussion, a “Non-U.S. stockholder” means a beneficial owner of shares of our common stock that is neither a U.S. stockholder nor a partnership (including an entity treated as a partnership for U.S. federal income tax purposes).
If an entity treated as a partnership for U.S. federal income tax purposes (a “partnership”) holds shares of our common stock, the tax treatment of a partner or member of the partnership will generally depend upon the status of the partner or member and the activities of the partnership. A prospective stockholder that is a partner or member in a partnership holding shares of our common stock should consult his, her or its tax advisors with respect to the purchase, ownership and disposition of shares of our common stock.
Tax matters are very complicated and the tax consequences to an investor of an investment in our shares will depend on the facts of his, her or its particular situation. We encourage investors to consult their own tax advisors regarding the specific consequences of such an investment, including tax reporting requirements, the applicability of U.S. federal, state, local and foreign tax laws, eligibility for the benefits of any applicable tax treaty and the effect of any changes in the tax laws.
Election to be Taxed as a RIC
We have qualified and elected to be treated as a RIC under Subchapter M of the Code commencing with our taxable year ended December 31, 2007. As a RIC, we generally are not subject to corporate-level U.S. federal income taxes on any income that we distribute to our stockholders from our tax earnings and profits. To qualify as a RIC, we must, among other things, meet certain source-of-income and asset diversification requirements (as described below). In addition, in order to obtain RIC tax treatment, we must distribute to our stockholders, for each taxable year, at least 90% of our "investment company taxable income" ("ICTI"), which is generally our net ordinary income plus the excess, if any, of realized net short-term capital gain over realized net long-term capital loss, (the "Annual Distribution Requirement"). Even if we qualify for tax treatment as a RIC, we generally will be subject to corporate-level U.S. federal income tax on our undistributed taxable income and could be subject to U.S. federal excise, state, local and foreign taxes.
27
Taxation as a RIC
Provided that we qualify for tax treatment as a RIC, we will not be subject to U.S. federal income tax on the portion of our ICTI and net capital gain (which we define as net long-term capital gain in excess of net short-term capital loss) that we timely distribute to stockholders. We will be subject to U.S. federal income tax at the regular corporate rates on any income or capital gain not distributed (or deemed distributed) to our stockholders.
We will be subject to a 4% nondeductible U.S. federal excise tax on certain undistributed income unless we distribute in a timely manner an amount at least equal to the sum of (i) 98.0% of our ordinary income for each calendar year, (ii) 98.2% of our capital gain net income for the calendar year and (iii) any income recognized, but not distributed, in preceding years and on which we paid no U.S. federal income tax.
In order to qualify for tax treatment as a RIC for U.S. federal income tax purposes, we must, among other things:
• |
meet the Annual Distribution Requirement; |
• |
qualify to be treated as a BDC or be registered as a management investment company under the 1940 Act at all times during each taxable year; |
• |
derive in each taxable year at least 90% of our gross income from dividends, interest, payments with respect to certain securities loans, gains from the sale or other disposition of stock or other securities or foreign currencies or other income derived with respect to our business of investing in such stock, securities or currencies and net income derived from an interest in a “qualified publicly traded partnership” (as defined in the Code), or the 90% Income Test; and |
• |
diversify our holdings so that at the end of each quarter of the taxable year: |
• |
at least 50% of the value of our assets consists of cash, cash equivalents, U.S. Government securities, securities of other RICs, and other securities if such other securities of any one issuer do not represent more than 5% of the value of our assets or more than 10% of the outstanding voting securities of the issuer (which for these purposes includes the equity securities of a “qualified publicly traded partnership”); and |
• |
no more than 25% of the value of our assets is invested in the securities, other than U.S. Government securities or securities of other RICs, (i) of one issuer (ii) of two or more issuers that are controlled, as determined under applicable tax rules, by us and that are engaged in the same or similar or related trades or businesses or (iii) of one or more “qualified publicly traded partnerships,” or the Diversification Tests. |
To the extent that we invest in entities treated as partnerships for U.S. federal income tax purposes (other than a “qualified publicly traded partnership”), we generally must include the items of gross income derived by the partnerships for purposes of the 90% Income Test, and the income that is derived from a partnership (other than a “qualified publicly traded partnership”) will be treated as qualifying income for purposes of the 90% Income Test only to the extent that such income is attributable to items of income of the partnership which would be qualifying income if realized by us directly. In addition, we generally must take into account our proportionate share of the assets held by partnerships (other than a “qualified publicly traded partnership”) in which we are a partner for purposes of the Diversification Tests.
In order to meet the 90% Income Test, we have established several special purpose corporations, and in the future may establish additional such corporations, to hold assets from which we do not anticipate earning dividend, interest or other qualifying income under the 90% Income Test (the "Taxable Subsidiaries"). Any investments held through a Taxable Subsidiary generally are subject to U.S. federal income and other taxes, and therefore we can expect to achieve a reduced after-tax yield on such investments.
We may be required to recognize taxable income in circumstances in which we do not receive a corresponding payment in cash. For example, if we hold debt obligations that are treated under applicable tax rules as having original issue discount (such as debt instruments with PIK interest or, in certain cases, increasing interest rates or issued with warrants), we must include in income each year a portion of the original issue discount that accrues over the life of the obligation, regardless of whether cash representing such income is received by us in the same taxable year. We may also have to include in income other amounts that we have not yet received in cash, such as deferred loan origination fees that are paid after origination of the loan or are paid in non-cash compensation such as warrants
28
or stock. We anticipate that a portion of our income may constitute original issue discount or other income required to be included in taxable income prior to receipt of cash.
Because any original issue discount or other amounts accrued will be included in our ICTI for the year of the accrual, we may be required to make a distribution to our stockholders in order to satisfy the Annual Distribution Requirement and to avoid the 4.0% U.S. federal excise tax, even though we will not have received any corresponding cash amount. As a result, we may have difficulty meeting the Annual Distribution Requirement necessary to obtain and maintain RIC tax treatment under the Code. We may have to sell some of our investments at times and/or at prices we would not consider advantageous, raise additional debt or equity capital or forgo new investment opportunities for this purpose. If we are not able to obtain cash from other sources, we may fail to qualify for RIC tax treatment and thus become subject to corporate-level income tax.
Furthermore, a portfolio company in which we invest may face financial difficulty that requires us to work-out, modify or otherwise restructure our investment in the portfolio company. Any such restructuring may result in unusable capital losses and future non-cash income. Any restructuring may also result in our recognition of a substantial amount of non-qualifying income for purposes of the 90% Income Test, such as cancellation of indebtedness income in connection with the work-out of a leveraged investment (which, while not free from doubt, may be treated as non-qualifying income) or the receipt of other non-qualifying income.
Gain or loss realized by us from warrants acquired by us as well as any loss attributable to the lapse of such warrants generally will be treated as capital gain or loss. Such gain or loss generally will be long-term or short-term, depending on how long we held a particular warrant.
Investments by us in non-U.S. securities may be subject to non-U.S. income, withholding and other taxes, and therefore, our yield on any such securities may be reduced by such non-U.S. taxes. Stockholders will generally not be entitled to claim a credit or deduction with respect to non-U.S. taxes paid by us.
If we purchase shares in a “passive foreign investment company,” or PFIC, we may be subject to U.S. federal income tax on a portion of any “excess distribution” or gain from the disposition of such shares even if such income is distributed as a taxable dividend by us to our stockholders. Additional charges in the nature of interest may be imposed on us in respect of deferred taxes arising from such distributions or gains. If we invest in a PFIC and elect to treat the PFIC as a “qualified electing fund” under the Code, or QEF, in lieu of the foregoing requirements, we will be required to include in income each year a portion of the ordinary earnings and net capital gain of the QEF, even if such income is not distributed to it. Alternatively, we can elect to mark-to-market at the end of each taxable year our shares in a PFIC; in this case, we will recognize as ordinary income any increase in the value of such shares and as ordinary loss any decrease in such value to the extent it does not exceed prior increases included in income. Under either election, we may be required to recognize in a year income in excess of our distributions from PFICs and our proceeds from dispositions of PFIC stock during that year, and such income will nevertheless be subject to the Annual Distribution Requirement and will be taken into account for purposes of the 4% U.S. federal excise tax. In addition, under recently proposed regulations, income required to be included as a result of a QEF election would not be qualifying income for purposes of the 90% Income Test unless we receive a distribution of such income from the PFIC in the same taxable year to which the inclusion relates.
Under Section 988 of the Code, gain or loss attributable to fluctuations in exchange rates between the time we accrue income, expenses, or other liabilities denominated in a foreign currency and the time we actually collect such income or pay such expenses or liabilities are generally treated as ordinary income or loss. Similarly, gain or loss on foreign currency forward contracts and the disposition of debt denominated in a foreign currency, to the extent attributable to fluctuations in exchange rates between the acquisition and disposition dates, are also treated as ordinary income or loss.
We are authorized to borrow funds and to sell assets in order to satisfy distribution requirements. Under the 1940 Act, we are not permitted to make distributions to our stockholders while our debt obligations and other senior securities are outstanding unless certain “asset coverage” tests are met. See “Regulation of Business Development Companies — Qualifying Assets” and “Regulation of Business Development Companies — Senior Securities" above. Moreover, our ability to dispose of assets to meet our distribution requirements may be limited by (i) the illiquid nature of our portfolio and/or (ii) other requirements relating to our tax treatment as a RIC, including the Diversification Tests. If we dispose of assets in order to meet the Annual Distribution Requirement or to avoid the excise tax, we may make such dispositions at times that, from an investment standpoint, are not advantageous.
If we fail to satisfy the Annual Distribution Requirement or otherwise fail to qualify for tax treatment as a RIC in any taxable year, we will be subject to tax in that year on all of our taxable income, regardless of whether we
29
make any distributions to our stockholders. In that case, all of such income will be subject to corporate-level U.S. federal income tax, reducing the amount available to be distributed to our stockholders. See “Failure To Obtain RIC Tax Treatment" below.
As a RIC, we are not allowed to carry forward or carry back a net operating loss for purposes of computing our ICTI in other taxable years. U.S. federal income tax law generally permits a RIC to carry forward (i) the excess of its net short-term capital loss over its net long-term capital gain for a given year as a short-term capital loss arising on the first day of the following year and (ii) the excess of its net long-term capital loss over its net short-term capital gain for a given year as a long-term capital loss arising on the first day of the following year. Future transactions we engage in may cause our ability to use any capital loss carryforwards, and unrealized losses once realized, to be limited under Section 382 of the Code. Certain of our investment practices may be subject to special and complex U.S. federal income tax provisions that may, among other things, (i) disallow, suspend or otherwise limit the allowance of certain losses or deductions, (ii) convert lower taxed long-term capital gain and qualified dividend income into higher taxed short-term capital gain or ordinary income, (iii) convert an ordinary loss or a deduction into a capital loss (the deductibility of which is more limited), (iv) cause us to recognize income or gain without a corresponding receipt of cash, (v) adversely affect the time as to when a purchase or sale of stock or securities is deemed to occur, (vi) adversely alter the characterization of certain complex financial transactions and (vii) produce income that will not be qualifying income for purposes of the 90% Income Test. We will monitor our transactions and may make certain tax elections in order to mitigate the effect of these provisions.
As described above, to the extent that we invest in equity securities of entities that are treated as partnerships for U.S. federal income tax purposes, the effect of such investments for purposes of the 90% Income Test and the Diversification Tests will depend on whether or not the partnership is a “qualified publicly traded partnership” (as defined in the Code). If the entity is a “qualified publicly traded partnership,” the net income derived from such investments will be qualifying income for purposes of the 90% Income Test and will be “securities” for purposes of the Diversification Tests. If the entity is not treated as a “qualified publicly traded partnership,” however, the consequences of an investment in the partnership will depend upon the amount and type of income and assets of the partnership allocable to us. The income derived from such investments may not be qualifying income for purposes of the 90% Income Test and, therefore, could adversely affect our tax treatment as a RIC. We intend to monitor our investments in equity securities of entities that are treated as partnerships for U.S. federal income tax purposes to prevent our disqualification from tax treatment as a RIC.
We may invest in preferred securities or other securities the U.S. federal income tax treatment of which may not be clear or may be subject to recharacterization by the IRS. To the extent the tax treatment of such securities or the income from such securities differs from the expected tax treatment, it could affect the timing or character of income recognized, requiring us to purchase or sell securities, or otherwise change our portfolio, in order to comply with the tax rules applicable to RICs under the Code.
We may distribute taxable dividends that are payable in cash or shares of our common stock at the election of each stockholder. Under certain applicable provisions of the Code and the Treasury regulations, distributions payable in cash or in shares of stock at the election of stockholders are treated as taxable dividends. The Internal Revenue Service has published guidance indicating that this rule will apply even where the total amount of cash that may be distributed is limited to no more than 20% of the total distribution. Under this guidance, if too many stockholders elect to receive their distributions in cash, the cash available for distribution must be allocated among the stockholders electing to receive cash (with the balance of the distribution paid in stock). If we decide to make any distributions consistent with this guidance that are payable in part in our stock, taxable stockholders receiving such dividends will be required to include the full amount of the dividend (whether received in cash, our stock, or a combination thereof) as ordinary income (or as long-term capital gain to the extent such distribution is properly reported as a capital gain dividend) to the extent of our current and accumulated earnings and profits for U.S. federal income tax purposes. As a result, a U.S. stockholder may be required to pay tax with respect to such dividends in excess of any cash received. If a U.S. stockholder sells the stock it receives in order to pay this tax, the sales proceeds may be less than the amount included in income with respect to the dividend, depending on the market price of our stock at the time of the sale. Furthermore, with respect to non-U.S. stockholders, we may be required to withhold U.S. tax with respect to such dividends, including in respect of all or a portion of such dividend that is payable in stock. In addition, if a significant number of our stockholders determine to sell shares of our stock in order to pay taxes owed on dividends, it may put downward pressure on the trading price of our stock.
30
Failure to Obtain RIC Tax Treatment
If we fail to satisfy the 90% Income Test or the Diversification Tests for any taxable year, we may nevertheless continue to qualify for tax treatment as a RIC for such year if certain relief provisions are applicable (which may, among other things, require us to pay certain corporate-level federal taxes or to dispose of certain assets).
If we were unable to obtain tax treatment as a RIC, we would be subject to tax on all of our taxable income at regular corporate rates. We would not be able to deduct distributions to stockholders, nor would they be required to be made. Distributions would generally be taxable to our stockholders as dividend income to the extent of our current and accumulated earnings and profits (in the case of non-corporate U.S. stockholders, generally at a maximum U.S. federal income tax rate applicable to qualified dividend income of 20%). Subject to certain limitations under the Code, corporate distributees would be eligible for the dividends-received deduction. Distributions in excess of our current and accumulated earnings and profits would be treated first as a return of capital to the extent of the stockholder’s tax basis, and any remaining distributions would be treated as a capital gain.
If we fail to meet the RIC requirements for more than two consecutive years and then, seek to re-qualify for tax treatment as a RIC, we would be subject to corporate-level taxation on any built-in gain recognized during the succeeding five-year period unless we made a special election to recognize all such built-in gain upon our re-qualification for tax treatment as a RIC and to pay the corporate-level tax on such built-in gain.
Possible Legislative or Other Actions Affecting Tax Considerations
Prospective investors should recognize that the present U.S. federal income tax treatment of an investment in our stock may be modified by legislative, judicial or administrative action at any time, and that any such action may affect investments and commitments previously made. The rules dealing with U.S. federal income taxation are constantly under review by persons involved in the legislative process and by the IRS and the U.S. Treasury Department, resulting in revisions of regulations and revised interpretations of established concepts as well as statutory changes. Revisions in U.S. federal tax laws and interpretations thereof could affect the tax consequences of an investment in our stock. See "Risk Factors - Risk Relating to Our Business and Structure - We cannot predict how tax reform legislation will affect us, our investments, or our stockholders, and any such legislation could adversely affect our business" included in Item 1A or Part I of this Annual Report.
Withholding
Our distributions generally will be treated as dividends for U.S. tax purposes and will be subject to U.S. income or withholding tax unless the shareholder receiving the dividend qualifies for an exemption from U.S. tax or the distribution is subject to one of the special look-through rules described below. Distributions paid out of net capital gains can qualify for a reduced rate of taxation in the hands of an individual U.S. shareholder and an exemption from U.S. tax in the hands of a non-U.S. shareholder.
Under an exemption, properly reported dividend distributions by RICs paid out of certain interest income (such distributions, “interest-related dividends”) are generally exempt from U.S. withholding tax for non-U.S. shareholders. Under such exemption, a non-U.S. shareholder generally may receive interest-related dividends free of U.S. withholding tax if the shareholder would not have been subject to U.S. withholding tax if it had received the underlying interest income directly. No assurance can be given as to whether any of our distributions will be eligible for this exemption from U.S. withholding tax or, if eligible, will be reported as such by us. In particular, the exemption does apply to distributions paid in respect of a RIC’s non-U.S. source interest income, its dividend income or its foreign currency gains. In the case shares of our stock are held through an intermediary, the intermediary may withhold U.S. federal income tax even if we report the payment as a dividend eligible for the exemption.
State and Local Tax Treatment
The state and local tax treatment may differ from U.S. federal income tax treatment.
The discussion set forth herein does not constitute tax advice, and potential investors should consult their own tax advisors concerning the tax considerations relevant to their particular situation.
31
Available Information
We intend to make this Annual Report, as well as our quarterly reports on Form 10-Q, our current reports on Form 8-K and, if applicable, amendments to those reports filed or furnished pursuant to Section 13(a) of the Exchange Act, publicly available on our website (www.baringsbdc.com) without charge as soon as reasonably practicable following our filing of such reports with the SEC. Our SEC reports can be accessed through the investor relations section of our website. The information found on our website is not part of this or any other report we file with or furnish to the SEC. We assume no obligation to update or revise any statements in this Annual Report or in other reports filed with the SEC, whether as a result of new information, future events or otherwise, unless we are required to do so by law. A copy of this Annual Report and our other reports is available without charge upon written request to Investor Relations, Barings BDC, Inc., 300 South Tryon Street, Suite 2500 Charlotte, North Carolina 28202. The SEC maintains an Internet site that contains reports, proxy and information statements and our other filings at www.sec.gov.
32
Item 1A. Risk Factors.
Investing in our securities involves a number of significant risks. In addition to the other information contained in this Annual Report on Form 10-K, you should consider carefully the following information before making an investment in our securities. The risks set out below are not the only risks we face. Additional risks and uncertainties not presently known to us or not presently deemed material by us might also impair our operations and performance. If any of the following events occur, our business, financial condition and results of operations could be materially and adversely affected. In such case, our net asset value, the trading price of our common stock and the value of our other securities could decline, and you may lose all or part of your investment.
Risks Relating to Our Business and Structure
We are dependent upon Barings’ access to its investment professionals for our success.
We depend on the diligence, skill and network of business contacts of Barings’ investment professionals to source appropriate investments for us. We depend on members of Barings’ investment team to appropriately analyze our investments and Barings’ investment committee to approve and monitor our portfolio investments. Barings’ investment committee, together with the other members of its investment team, evaluate, negotiate, structure, close and monitor our investments. Our future success depends on the continued availability of the members of Barings’ investment committee and the other investment professionals available to Barings. We do not have employment agreements with these individuals or other key personnel of Barings, and we cannot provide any assurance that unforeseen business, medical, personal or other circumstances would not lead any such individual to terminate his or her relationship with Barings. If these individuals do not maintain their existing relationships with Barings and its affiliates or do not develop new relationships with other sources of investment opportunities, we may not be able to identify appropriate replacements or grow our investment portfolio. The loss of any member of Barings’ investment committee or of other investment professionals of Barings and its affiliates would limit our ability to achieve our investment objectives and operate as we anticipate, which could have a material adverse effect on our financial condition, results of operations and cash flows. We expect that Barings will evaluate, negotiate, structure, close and monitor our investments in accordance with the terms of the Advisory Agreement. We can offer no assurance, however, that the investment professionals of Barings will continue to provide investment advice to us or that we will continue to have access to Barings’ investment professionals or its information and deal flow. Further, there can be no assurance that Barings will replicate its own historical success, and we caution you that our investment returns could be substantially lower than the returns achieved by other funds managed by Barings.
Our financial condition and results of operations will depend on our ability to manage and deploy capital effectively.
Our ability to continue to achieve our investment objectives will depend on our ability to effectively manage and deploy our capital, which will depend, in turn, on Barings' ability to continue to identify, evaluate, invest in and monitor companies that meet our investment criteria. We cannot assure you that we will continue to achieve our investment objectives.
Accomplishing this result on a cost-effective basis will be largely a function of Barings' handling of the investment process, their ability to provide competent, attentive and efficient services and our access to investments offering acceptable terms. In addition to monitoring the performance of our existing investments, Barings' investment professionals may also be called upon to provide managerial assistance to our portfolio companies. These demands on their time may distract them or slow the rate of investment.
Even if we are able to grow and build upon our investment operations in a manner commensurate with any capital made available to us as a result of our operating activities, financing activities and/or offerings of our securities, any failure to manage our growth effectively could have a material adverse effect on our business, financial condition, results of operations and prospects. The results of our operations will depend on many factors, including the availability of opportunities for investment, readily accessible short- and long-term funding alternatives in the financial markets and economic conditions. Furthermore, if we cannot successfully operate our business or implement our investment policies and strategies as described in this Annual Report, it could negatively impact our ability to pay distributions and cause you to lose part or all of your investment.
33
We are subject to risks associated with the current interest rate environment and, to the extent we use debt to finance our investments, changes in interest rates will affect our cost of capital and net investment income.
Since the economic downturn that began in mid-2007, interest rates have remained comparatively low. Because longer-term inflationary pressure is likely to result from the U.S. government’s fiscal policies and challenges during this time, we will likely experience rising interest rates, rather than falling rates, and have experienced increases to LIBOR in 2018 and 2019. In addition, the Federal Reserve has raised the federal funds rate multiple times in recent quarters and has announced its intention to continue to raise the federal funds rate over time.
To the extent we borrow money or issue debt securities or preferred stock to make investments, our net investment income will depend, in part, upon the difference between the rate at which we borrow funds or pay interest or dividends on such debt securities or preferred stock and the rate at which we invest these funds. In addition, all of our debt investments and borrowings, including Barings BDC Senior Funding I, LLC's credit facility entered into in August 2018 with Bank of America, N.A. (as amended and restated in December 2018, the "August 2018 Credit Facility"), have floating interest rates that reset on a periodic basis, and our investments are subject to interest rate floors. As a result, a change in market interest rates could have a material adverse effect on our net investment income. In periods of rising interest rates, our cost of funds will increase because the interest rates on the amounts we have borrowed are floating, which could reduce our net investment income. We may use interest rate risk management techniques in an effort to limit our exposure to interest rate fluctuations. Such techniques may include various interest rate hedging activities to the extent permitted by the 1940 Act and applicable commodities laws. These activities may limit our ability to participate in the benefits of lower interest rates with respect to the hedged borrowings. Adverse developments resulting from changes in interest rates or hedging transactions could have a material adverse effect on our business, financial condition and results of operations.
A rise in the general level of interest rates typically leads to higher interest rates applicable to our debt investments, which may result in an increase of the amount of incentive fees payable to Barings. Also, an increase in interest rates available to investors could make an investment in our common stock less attractive if we are not able to increase our distribution rate, which could reduce the value of our common stock.
In July 2017, the head of the United Kingdom Financial Conduct Authority announced the desire to phase out the use of LIBOR by the end of 2021. There is currently no definitive information regarding the future utilization of LIBOR or of any particular replacement rate. As such, the potential effect of any such event on our cost of capital and net investment income cannot yet be determined. In addition, any further changes or reforms to the determination or supervision of LIBOR may result in a sudden or prolonged increase or decrease in reported LIBOR, which could have an adverse impact on the market value for or value of any LIBOR-linked securities, loans, and other financial obligations or extensions of credit held by or due to us and could have a material adverse effect on our business, financial condition and results of operations.
Global capital markets could enter a period of severe disruption and instability or an economic recession. These conditions have historically affected and could again materially and adversely affect debt and equity capital markets in the United States and around the world and could impair our portfolio companies and harm our operating results.
The U.S. and global capital markets have in the past and may in the future experience periods of extreme volatility and disruption during economic downturns and recessions. Increases to budget deficits or direct and contingent sovereign debt may create concerns about the ability of certain nations to service their sovereign debt obligations, and risks resulting from any such debt crisis in Europe, the United States or elsewhere could have a detrimental impact on the global economy and the financial condition of financial institutions generally. Austerity measures that certain countries may agree to as part of any debt crisis or disruptions to major financial trading markets may adversely affect world economic conditions and have an adverse impact on our business and that of our portfolio companies. In June 2016, the United Kingdom held a referendum in which voters approved an exit from the European Union, and the implications of the United Kingdom’s pending withdrawal from the European Union are unclear at present. Market and economic disruptions, which may be caused by political trends and government actions in the United States or elsewhere, have in the past and may in the future affect the U.S. capital markets, which could adversely affect our business and that of our portfolio companies and the broader financial and credit
34
markets and reduce the availability of debt and equity capital for the market as a whole and to financial firms, in particular. At various times, such disruptions have resulted in, and may in the future result in, a lack of liquidity in parts of the debt capital markets, significant write-offs in the financial services sector and the repricing of credit risk. Such conditions may occur for a prolonged period of time and may materially worsen in the future, including as a result of U.S. government shutdowns or further downgrades to the U.S. government’s sovereign credit rating or the perceived credit worthiness of the United States or other large global economies. Unfavorable economic conditions, including future recessions, also could increase our funding costs, limit our access to the capital markets or result in a decision by lenders not to extend credit to us.
Market conditions may in the future make it difficult to extend the maturity of or refinance our existing indebtedness, including the maturity of the Class A Loan Commitments and the Class A-1 Loan Commitments under the August 2018 Credit Facility in August 2019 and August 2020, respectively, and any failure to do so could have a material adverse effect on our business. If we are unable to raise or refinance debt, then our equity investors may not benefit from the potential for increased returns on equity resulting from leverage and we may be limited in our ability to make new commitments or to fund existing commitments to our portfolio companies. In addition, the illiquidity of our investments may make it difficult for us to sell such investments if required. As a result, we may realize significantly less than the value at which we have recorded our investments.
Given the extreme volatility and dislocation that the capital markets have historically experienced, many BDCs have faced, and may in the future face, a challenging environment in which to raise capital. We may in the future have difficulty accessing debt and equity capital on attractive terms, or at all, and a severe disruption or instability in the global financial markets or deteriorations in credit and financing conditions may cause us to reduce the volume of the loans we originate and/or fund, adversely affect the value of our portfolio investments or otherwise have a material adverse effect on our business, financial condition, results of operations and cash flows. In addition, significant changes in the capital markets, including instances of extreme volatility and disruption, have had, and may in the future have, a negative effect on the valuations of our investments and on the potential for liquidity events involving our investments. An inability to raise capital, and any required sale of our investments for liquidity purposes, could have a material adverse impact on our business, financial condition or results of operations. We monitor developments and seek to manage our investments in a manner consistent with achieving our investment objective, but there can be no assurance that we will be successful in doing so, and we may not timely anticipate or manage existing, new or additional risks, contingencies or developments, including regulatory developments in the current or future market environment.
Many of the portfolio companies in which we make investments may be susceptible to economic slowdowns or recessions and may be unable to repay the loans we made to them during these periods. Therefore, our non-performing assets may increase and the value of our portfolio may decrease during these periods as we are required to record our investments at their current fair value. Adverse economic conditions also may decrease the value of collateral securing some of our loans and the value of our equity investments. Economic slowdowns or recessions could lead to financial losses in our portfolio and a decrease in revenues, net income and assets. Unfavorable economic conditions also could increase our and our portfolio companies’ funding costs, limit our and our portfolio companies’ access to the capital markets or result in a decision by lenders not to extend credit to us or our portfolio companies. These events could prevent us from increasing investments and harm our operating results.
A portfolio company’s failure to satisfy financial or operating covenants imposed by us or other lenders could lead to defaults and, potentially, acceleration of the time when the loans are due and foreclosure on its secured assets, which could trigger cross-defaults under other agreements and jeopardize the portfolio company’s ability to meet its obligations under the debt that we hold. We may incur additional expenses to the extent necessary to seek recovery upon default or to negotiate new terms with a defaulting portfolio company. In addition, if one of our portfolio companies were to go bankrupt, depending on the facts and circumstances, including the extent to which we will actually provide significant managerial assistance to that portfolio company, a bankruptcy court might subordinate all or a portion of our claim to that of other creditors.
35
Our investment portfolio is and will continue to be recorded at fair value as determined in good faith by our Board of Directors and, as a result, there is and will continue to be uncertainty as to the value of our portfolio investments.
Under the 1940 Act, we are required to carry our portfolio investments at market value or, if there is no readily available market value, at fair value as determined in good faith by the Board. Typically there is not a public market for the securities of the privately held middle-market companies in which we have invested and will generally continue to invest. As a result, we value these securities quarterly at fair value as determined in good faith by the Board based on input from Barings, a nationally recognized independent advisor and our audit committee. See "Valuation Process and Determination of Net Asset Value" included in Item 1 of Part 1 of this Annual Report for a detailed description of our valuation process.
The determination of fair value and consequently, the amount of unrealized appreciation and depreciation in our portfolio, is to a certain degree subjective and dependent on the judgment of the Board. Certain factors that may be considered in determining the fair value of our investments include the nature and realizable value of any collateral, the portfolio company’s earnings and its ability to make payments on its indebtedness, the markets in which the portfolio company does business, comparison to comparable publicly-traded companies, discounted cash flows and other relevant factors. Because such valuations, and particularly valuations of private securities and private companies, are inherently uncertain, may fluctuate over short periods of time and may be based on estimates, our determinations of fair value may differ materially from the values that would have been used if a ready market for these securities existed. Due to this uncertainty, our fair value determinations may cause our net asset value on a given date to materially understate or overstate the value that we may ultimately realize upon the sale or disposition of one or more of our investments. As a result, investors purchasing our securities based on an overstated net asset value would pay a higher price than the value of our investments might warrant. Conversely, investors selling shares during a period in which the net asset value understates the value of our investments will receive a lower price for their shares than the value of our investments might warrant.
Volatility or a prolonged disruption in the credit markets could materially damage our business.
We are required to record our assets at fair value, as determined in good faith by the Board in accordance with our valuation policy. As a result, volatility in the capital markets may adversely affect our valuations and our net asset value, even if we intend to hold investments to maturity. Volatility or dislocation in the capital markets may depress our stock price and create a challenging environment in which to raise debt and equity capital. As a BDC, we are generally not able to issue additional shares of our common stock at a price less than net asset value without first obtaining approval for such issuance from our stockholders and our independent directors. Additionally, our ability to incur indebtedness (including by issuing preferred stock) is limited by applicable regulations such that our asset coverage under the 1940 Act must equal at least 150% of total indebtedness. Shrinking portfolio values negatively impact our ability to borrow additional funds or issue debt securities because our net asset value is reduced for purposes of the 150% asset leverage test. If the fair value of our assets declines substantially, we may fail to maintain the asset coverage ratio stipulated by the 1940 Act, which could, in turn, cause us to lose our status as a BDC and materially impair our business operations. A protracted disruption in the credit markets could also materially decrease demand for our investments.
We operate in a highly competitive market for investment opportunities, which could reduce returns and result in losses.
A number of entities compete with us to make the types of investments that we make. We compete with public and private funds, commercial and investment banks, commercial financing companies and, to the extent they provide an alternative form of financing, private equity and hedge funds. Many of our competitors are substantially larger and some have considerably greater financial, technical and marketing resources than we do. For example, we believe some of our competitors may have access to funding sources that are not available to us. In addition, some of our competitors may have higher risk tolerances or different risk assessments, which could allow them to consider a wider variety of investments and establish more relationships than us. Furthermore, many of our competitors are not subject to the regulatory restrictions that the 1940 Act imposes on us as a BDC or the source of income, asset diversification and distribution requirements we must satisfy to maintain our qualification as a RIC. The competitive
36
pressures we face may have a material adverse effect on our business, financial condition, results of operations and cash flows. As a result of this competition, we may not be able to take advantage of attractive investment opportunities from time to time, and we may not be able to identify and make investments that are consistent with our investment objective.
With respect to the investments we make, we do not seek to compete based primarily on the interest rates we offer, and we believe that some of our competitors may make loans with interest rates that will be lower than the rates we offer. In the secondary market for acquiring existing loans, we compete generally on the basis of pricing terms. With respect to all investments, we may lose some investment opportunities if we do not match our competitors’ pricing, terms and structure. However, if we match our competitors’ pricing, terms and structure, we may experience decreased net interest income, lower yields and increased risk of credit loss. We may also compete for investment opportunities with accounts managed or sponsored by Barings or its affiliates. Although Barings allocates opportunities in accordance with its allocation policy, allocations to such other accounts will reduce the amount and frequency of opportunities available to us and may not be in the best interests of us and our securityholders. Moreover, the performance of investments will not be known at the time of allocation.
There are potential conflicts of interest, including the management of other investment funds and accounts by Barings, which could impact our investment returns.
The executive officers that manage the Company and the members of Barings' investment committee, as well as the other principals of Barings, manage other funds affiliated with Barings, including other closed-end investment companies. In addition, Barings' investment team has responsibilities for managing U.S. middle-market debt investments for certain other investment funds and accounts. Accordingly, they have obligations to investors in those entities, the fulfillment of which may not be in the best interests of, or may be adverse to the interests of, us or our stockholders. In addition, certain of the other funds and accounts managed by Barings may provide for higher management or incentive fees, greater expense reimbursements or overhead allocations, or permit Barings and its affiliates to receive higher origination and other transaction fees, all of which may contribute to this conflict of interest and create an incentive for Barings to favor such other funds or accounts. Although the professional staff of Barings will devote as much time to our management as appropriate to enable Barings to perform its duties in accordance with the Advisory Agreement, the investment professionals of Barings may have conflicts in allocating their time and services among us, on the one hand, and the other investment vehicles managed by Barings or one or more of its affiliates on the other hand.
Barings may face conflicts in allocating investment opportunities between us and affiliated investment vehicles that have overlapping investment objectives with ours. Although Barings will endeavor to allocate investment opportunities in a fair and equitable manner in accordance with its allocation policies and procedures, it is possible that, in the future, we may not be given the opportunity to participate in investments made by investment funds managed by Barings or an investment manager affiliated with Barings if such investment is prohibited by the Exemptive Relief or the 1940 Act, and there can be no assurance that we will be able to participate in all investment opportunities that are suitable to us.
Conflicts may also arise because portfolio decisions regarding our portfolio may benefit Barings' affiliates. Barings' affiliates may pursue or enforce rights with respect to one of our portfolio companies, and those activities may have an adverse effect on us.
Barings may exercise significant influence over us in connection with its ownership of our common stock.
As of February 27, 2019, Barings, our external investment adviser, beneficially owns approximately 26.6% of our outstanding common stock. As a result, Barings may be able to significantly influence the outcome of matters submitted for stockholder action, including the election of directors, approval of significant corporate transactions, such as amendments to our governing documents, business combinations, consolidations and mergers. Barings has substantial influence on us and could exercise its influence in a manner that conflicts with the interests of other stockholders. The presence of a significant stockholder such as Barings may also have the effect of making it more difficult for a third party to acquire us or for the Board to discourage a third party from seeking to acquire us.
37
Barings’ investment committee, Barings or its affiliates may, from time to time, possess material non-public information, limiting our investment discretion.
Principals of Barings and its affiliates and members of Barings’ investment committee may serve as directors of, or in a similar capacity with, companies in which we invest, the securities of which are purchased or sold on our behalf. In the event that material nonpublic information is obtained with respect to such companies, or we become subject to trading restrictions under the internal trading policies of those companies or as a result of applicable law or regulations, we could be prohibited for a period of time from purchasing or selling the securities of such companies, and this prohibition may have an adverse effect on us.
Barings and its investment team have limited experience managing a BDC.
Although Barings has experience managing closed-end investment companies, Barings and its investment team have limited experience managing a BDC, and the investment philosophy and techniques used by Barings to manage the Company may differ from the investment philosophy and techniques previously employed by Barings’ investment team in identifying and managing past investments. Accordingly, we can offer no assurance that we will replicate the Company’s own historical performance or the historical performance of other businesses or companies with which Barings’ investment team has been affiliated, and our investment returns could be substantially lower than the returns achieved by such other companies.
Our ability to enter into transactions with affiliates of Barings are restricted.
We and certain of our controlled affiliates are prohibited under the 1940 Act from knowingly participating in certain transactions with our upstream affiliates, or Barings and its affiliates, without the prior approval of our independent directors and, in some cases, the SEC. Any person that owns, directly or indirectly, 5% or more of our outstanding voting securities is our upstream affiliate for purposes of the 1940 Act, and we are generally prohibited from buying or selling any security (other than our securities) from or to such affiliate, absent the prior approval of our independent directors. The 1940 Act also prohibits“joint” transactions with an upstream affiliate, or Barings or its affiliates, which could include investments in the same portfolio company (whether at the same or different times), without prior approval of our independent directors. In addition, we and certain of our controlled affiliates will be prohibited from buying or selling any security from or to, or entering into joint transactions with, Barings and its affiliates, or any person who owns more than 25% of our voting securities or is otherwise deemed to control, be controlled by, or be under common control with us, absent the prior approval of the SEC through an exemptive order (other than in certain limited situations pursuant to current regulatory guidance as described below). The analysis of whether a particular transaction constitutes a joint transaction requires a review of the relevant facts and circumstances then existing.
As a BDC, we are required to comply with certain regulatory requirements. For example, we will generally not be permitted to make loans to companies controlled by Barings or other funds managed by Barings. We will also not be permitted to make any co-investments with Barings or its affiliates (including any fund managed by Barings or an investment adviser controlling, controlled by or under common control with Barings) without exemptive relief from the SEC, subject to certain exceptions. The Exemptive Relief that the SEC has granted to Barings permits certain present and future funds, including the Company, advised by Barings (or an investment adviser controlling, controlled by or under common control with Barings) to co-invest in suitable negotiated investments. Co-investments made under the Exemptive Relief are subject to compliance with the conditions and other requirements contained in the Exemptive Relief, which could limit our ability to participate in a co-investment transaction.
The fee structure under the Advisory Agreement may induce Barings to pursue speculative investments and incur leverage, which may not be in the best interests of our stockholders.
The Base Management Fee will be payable even if the value of your investment declines. The Base Management Fee is calculated based on our gross assets, including assets purchased with borrowed funds or other forms of leverage (but excluding cash or cash equivalents). Accordingly, the Base Management Fee is payable regardless of whether the value of our gross assets and/or your investment has decreased during the then-current quarter and creates an incentive for Barings to incur leverage, which may not be consistent with our stockholders’ interests.
38
The Income-Based Fee payable to Barings is calculated based on a percentage of our return on invested capital. The Income-Based Fee payable to Barings may create an incentive for Barings to make investments on our behalf that are risky or more speculative than would be the case in the absence of such a compensation arrangement. Unlike the Base Management Fee, the Income-Based Fee is payable only if the hurdle rate is achieved. Because the portfolio earns investment income on gross assets while the hurdle rate is based on invested capital, and because the use of leverage increases gross assets without any corresponding increase in invested capital, Barings may be incentivized to incur leverage to grow the portfolio, which will tend to enhance returns where our portfolio has positive returns and increase the chances that such hurdle rate is achieved. Conversely, the use of leverage may increase losses where our portfolio has negative returns, which would impair the value of our common stock.
In addition, Barings receives the Capital Gains Fee based, in part, upon net capital gains realized on our investments. Unlike the Income-Based Fee, there is no hurdle rate applicable to the Capital Gains Fee. As a result, Barings may have a tendency to invest more capital in investments that are likely to result in capital gains as compared to income producing securities. Such a practice could result in our investing in more speculative securities than would otherwise be the case, which may not be in the best interests of our stockholders and could result in higher investment losses, particularly during economic downturns.
Barings' liability is limited under the Advisory Agreement, and we are required to indemnify Barings against certain liabilities, which may lead Barings to act in a riskier manner on our behalf than it would when acting for its own account.
Under the Advisory Agreement, Barings does not assume any responsibility to us other than to render the services described in the Advisory Agreement, and it is not responsible for any action of the Board in declining to follow Barings' advice or recommendations. Pursuant to the Advisory Agreement, Barings and its officers, managers, partners, agents, employees, controlling persons, members and any other person or entity affiliated with Barings will not be liable to us for their acts under the Advisory Agreement, absent fraud, willful misfeasance, bad faith, gross negligence or reckless disregard in the performance of their duties. We have agreed to indemnify, defend and protect Barings and its officers, managers, partners, agents, employees, controlling persons, members and any other person or entity affiliated with Barings with respect to all damages, liabilities, costs and expenses arising out of or otherwise based upon the performance of any of the Barings' duties or obligations under the Advisory Agreement or otherwise as Barings for us, and not arising out of fraud, willful misfeasance, bad faith, gross negligence or reckless disregard in the performance of their duties under the Advisory Agreement. These protections may lead Barings to act in a riskier manner when acting on our behalf than it would when acting for its own account.
Barings is able to resign as our investment adviser and/or our administrator upon 60 days’ notice, and we may not be able to find a suitable replacement within that time, or at all, resulting in a disruption in our operations that could adversely affect our financial condition, business and results of operations.
Pursuant to the Advisory Agreement, Barings has the right to resign as our investment adviser upon 60 days' written notice, whether a replacement has been found or not. Similarly, Barings' has the right under the Administration Agreement to resign upon 60 days’ written notice, whether a replacement has been found or not. If Barings resigns, it may be difficult to find a replacement investment adviser or administrator, as applicable, or hire internal management with similar expertise and ability to provide the same or equivalent services on acceptable terms within 60 days, or at all. If a replacement is not found quickly, our business, results of operations and financial condition as well as our ability to pay distributions are likely to be adversely affected and the value of our shares may decline. In addition, the coordination of our internal management and investment or administrative activities is likely to suffer if we are unable to identify and reach an agreement with a single institution or group of executives having the expertise possessed by Barings. Even if a comparable service provider or individuals performing such services are retained, whether internal or external, their integration into our business and lack of familiarity with our investment objective may result in additional costs and time delays that may materially adversely affect our business, results of operations and financial condition.
39
Our business model depends to a significant extent upon strong referral relationships, and our inability to maintain or develop these relationships, as well as the failure of these relationships to generate investment opportunities, could adversely affect our business.
We depend upon Barings and its affiliates' relationships with sponsors, and we intend to rely to a significant extent upon these relationships to provide us with potential investment opportunities. If Barings or its affiliates fail to maintain such relationships, or to develop new relationships with other sponsors or sources of investment opportunities, we will not be able to grow our investment portfolio. In addition, individuals with whom the principals of Barings have relationships are not obligated to provide us with investment opportunities, and, therefore, we can offer no assurance that these relationships will generate investment opportunities for us in the future.
Our long-term ability to fund new investments and make distributions to our stockholders could be limited if we are unable to renew, extend, replace or expand our credit facility, or if financing becomes more expensive or less available.
On August 3, 2018, our wholly-owned subsidiary, Barings BDC Senior Funding I, LLC ("BSF"), entered into the August 2018 Credit Facility, which provides for borrowings in an aggregate amount up to $750.0 million, consisting of up to $250.0 million borrowed under the Class A Loan Commitments and up to $500.0 million borrowed under the Class A-1 Loan Commitments. Any amounts borrowed under the Class A Loan Commitments will mature, and all accrued and unpaid interest thereunder will be due and payable, on August 3, 2019, or upon earlier termination of the August 2018 Credit Facility. Any amounts borrowed under the Class A-1 Loan Commitments will mature, and all accrued and unpaid interest thereunder will be due and payable, on August 3, 2020, or upon earlier termination of the August 2018 Credit Facility. If the facility is not renewed or extended, all principal and interest will be due and payable.
There can be no guarantee that we or BSF will be able to renew, extend or replace the August 2018 Credit Facility when principal payments are due and payable on terms that are favorable to us, if at all. Our ability to obtain replacement financing when principal payments are due and payable, will be constrained by then-current economic conditions affecting the credit markets. In the event that we or BSF are not able to renew, extend or replace the August 2018 Credit Facility when principal payments are due and payable, this could have a material adverse effect on our liquidity and ability to fund new investments, our ability to make distributions to our stockholders and our ability to qualify for tax treatment as a RIC under the Code.
Regulations governing our operation as a business development company will affect our ability to, and the way in which we raise additional capital.
Our business will require capital to operate and grow. We may acquire such additional capital from the following sources:
Senior Securities. In the future, we may issue debt securities or preferred stock, and/or borrow money from banks or other financial institutions (including borrowings under the August 2018 Credit Facility), which we refer to collectively as "senior securities." As a result of issuing senior securities, we will be exposed to additional risks, including, but not limited to, the following:
• |
Under the provisions of the 1940 Act, we are permitted, as a BDC, to issue senior securities only in amounts such that our asset coverage, as defined in the 1940 Act, equals at least 150% after each issuance of senior securities. If the value of our assets declines, we may be unable to satisfy this test. If that happens, we may be required to sell a portion of our investments and, depending on the nature of our leverage, repay a portion of our debt at a time when such sales and/or repayments may be disadvantageous. Further we may not be permitted to declare a dividend or make any distribution to stockholders or repurchase shares until such time as we satisfy this test. |
• |
Any amounts that we use to service our debt or make payments on preferred stock will not be available for distributions to our common stockholders. |
40
• |
It is likely that any securities or other indebtedness we may issue will be, and the August 2018 Credit Facility is, governed by an indenture or other instrument containing covenants restricting our operating flexibility. Additionally, some of these securities or other indebtedness may be rated by rating agencies, and in obtaining a rating for such securities and other indebtedness, we may be required to abide by operating and investment guidelines that further restrict operating and financial flexibility. |
• |
We and, indirectly, our stockholders, will bear the cost of issuing and servicing such securities and other indebtedness. |
• |
Preferred stock or any convertible or exchangeable securities that we issue in the future may have rights, preferences and privileges more favorable than those of our common stock, including separate voting rights and could delay or prevent a transaction or a change in control to the detriment of the holders of our common stock. |
Additional Common Stock. Under the provisions of the 1940 Act, we are not generally able to issue and sell our common stock at a price below then-current net asset value per share. We may, however, sell our common stock or warrants, options or rights to acquire our common stock, at a price below the then-current net asset value per share of our common stock if the Board determines that such sale is in the best interests of us and our stockholders, and our stockholders approve such sale. We may also make rights offerings to our stockholders at prices per share less than the net asset value per share, subject to applicable requirements of the 1940 Act. If we raise additional funds by issuing more common stock or senior securities convertible into, or exchangeable for, our common stock, the percentage ownership of our stockholders at that time would decrease, and they may experience dilution. Moreover, we can offer no assurance that we will be able to issue and sell additional equity securities in the future on favorable terms, or at all.
In addition to regulatory limitations on our ability to raise capital, the August 2018 Credit Facility contains various covenants, which, if not complied with, could accelerate our repayment obligations under the August 2018 Credit Facility, thereby materially and adversely affecting our liquidity, financial condition, results of operations and ability to pay distributions.
We will have a continuing need for capital to finance our investments. Our wholly-owned subsidiary, BSF, is party to the August 2018 Credit Facility, which provides for a revolving credit line of up to $750.0 million. As of December 31, 2018, BSF had borrowings of $570.0 million outstanding under the August 2018 Credit Facility. Under the August 2018 Credit Facility, BSF is required to comply with various covenants, reporting requirements and other customary requirements for similar credit facilities. In addition to other customary events of default included in financing transactions, the August 2018 Credit Facility contains the following events of default: (i) the failure to make principal payments when due or interest payments within two business days of when due; (ii) borrowings under the credit facility exceeding the applicable advance rates; (iii) the purchase by BSF of certain ineligible assets; (iv) the insolvency or bankruptcy of BSF and (v) the decline of BSF’s net asset value below a specified threshold. During the continuation of an event of default, BSF must pay interest at a default rate. BSF’s continued compliance with the covenants under the August 2018 Credit Facility depends on many factors, some of which are beyond our control, and there can be no assurance that BSF will continue to comply with these covenants. BSF’s failure to satisfy these covenants could result in foreclosure by its lenders, which would accelerate BSF’s repayment obligations under the facility and thereby have a material adverse effect on our business, liquidity, financial condition, results of operations and ability to pay distributions to our stockholders.
Incurring additional leverage may magnify our exposure to risks associated with changes in interest rates, including fluctuations in interest rates that could adversely affect our profitability.
As part of our business strategy, we, through BSF, borrow under the August 2018 Credit Facility and in the future may borrow money and issue debt securities to banks, insurance companies and other lenders. The lenders party to the August 2018 Credit Facility are secured by the assets of BSF and have claims that are superior to the claims of our common stockholders, and holders of any future loans or debt securities would have fixed-dollar claims on our assets that are superior to the claims of our stockholders. If the value of our assets decreases, leverage will cause our net asset value to decline more sharply than it otherwise would have without leverage. Similarly, any
41
decrease in our income would cause our net income to decline more sharply than it would have if we had not borrowed. This decline could negatively affect our ability to make dividend payments on our common stock.
If we incur additional leverage, general interest rate fluctuations may have a more significant negative impact on our investments than they would have absent such additional leverage and, accordingly, may have a material adverse effect on our investment objective and rate of return on investment capital. A portion of our income will depend upon the difference between the rate at which we borrow funds and the interest rate on the debt securities in which we invest. Because we borrow money to make investments and may issue debt securities, preferred stock or other securities, our net investment income is dependent upon the difference between the rate at which we borrow funds or pay interest or dividends on such debt securities, preferred stock or other securities and the rate at which we invest these funds. Typically, our interest earning investments accrue and pay interest at variable rates, and our interest-bearing liabilities accrue interest at variable or potentially fixed rates. As a result, there can be no assurance that a significant change in market interest rates will not have a material adverse effect on our net investment income.
The following table illustrates the effect of leverage on returns from an investment in our common stock assuming that we employ (i) our actual asset coverage ratio as of December 31, 2018 and (ii) a hypothetical asset coverage ratio of 150%, each at various annual returns on our portfolio as of December 31, 2018, net of expenses. The purpose of this table is to assist investors in understanding the effects of leverage. The calculations in the table below are hypothetical, and actual returns may be higher or lower than those appearing in the table below.
|
Assumed Return on our Portfolio
(Net of Expenses)
|
||||||||||
(10.0 |
)% |
(5.0 |
)% |
0.0 |
% |
5.0 |
% |
10.0 |
% |
|
Corresponding return to common stockholder assuming actual asset coverage as of December 31, 2018(1) |
(24.6 |
)% |
(14.3 |
)% |
(3.9 |
)% |
6.5 |
% |
16.9 |
% |
Corresponding return to common stockholder assuming 150% asset coverage as of December 31, 2018(2) |
(37.4 |
)% |
(22.4 |
)% |
(7.3 |
)% |
7.7 |
% |
22.8 |
% |
(1) Assumes $1.2 billion in total assets, $598.5 million in debt outstanding, $563.0 million in net assets and an average cost of funds of 3.65%, which was the weighted average borrowing cost of our borrowings at December 31, 2018. The assumed amount of debt outstanding for this example includes $570.0 million of outstanding borrowings under the August 2018 Credit Facility as of December 31, 2018 and assumed additional borrowings of $28.5 million to settle our payable from unsettled transactions as of December 31, 2018.
(2) Assumes $1.7 billion in total assets, $1.1 billion in debt outstanding and $563.0 million in net assets as of December 31, 2018, and an average cost of funds of 3.65%, which was the weighted average borrowing cost of our borrowings at December 31, 2018.
Based on our outstanding indebtedness of $570.0 million as of December 31, 2018, assumed additional borrowings of $5.6 million to settle our net payable from unsettled transactions as of December 31, 2018 and an average cost of funds of 3.65%, which was the weighted average borrowing cost of our borrowings under the August 2018 Credit Facility as of December 31, 2018, our investment portfolio must experience an annual return of at least 1.80% to cover annual interest payments on our outstanding indebtedness.
Based on outstanding indebtedness of $1.1 billion calculated assuming a 150% asset coverage ratio and an average cost of funds of 3.65%, which was the weighted average borrowing cost of our borrowings under the August 2018 Credit Facility as of December 31, 2018, our investment portfolio must experience an annual return of at least 2.43% to cover annual interest payments on our outstanding indebtedness.
42
Our interests in BSF are subordinated, and we may not receive cash on our equity interests in BSF.
We own directly or indirectly 100% of the equity interests in BSF. We consolidate the financial statements of BSF in our consolidated financial statements and treat BSF’s indebtedness under the August 2018 Credit Facility as our indebtedness. Our equity interests in BSF are subordinated in priority of payment to all of the secured and unsecured creditors, known or unknown, of BSF and are subject to certain payment restrictions set forth in the August 2018 Credit Facility, which generally provides that payments on the interests may not be made on any payment date unless all amounts owing to the lenders and other secured parties are paid in full. As a result, we may receive cash distributions on our equity interests in BSF only if BSF has made all required cash interest payments to the lenders and no default exists under the August 2018 Credit Facility. In the event of a default under the August 2018 Credit Facility, cash may be diverted from us to pay the applicable lender and other secured parties or otherwise remedy the default.
We cannot assure you that distributions on the assets held by BSF will be sufficient to make any distributions to us or that such distributions will meet our expectations. In the event that we fail to receive cash from BSF, we could be unable to make distributions to our stockholders in amounts sufficient to maintain our status as a RIC, or at all. We also could be forced to sell investments in portfolio companies at less than their fair value in order to continue making such distributions. In addition, to the extent that the value of BSF’s portfolio of loan investments has been reduced as a result of conditions in the credit markets, defaulted loans, capital gains and losses on the underlying assets, prepayment or changes in interest rates, the returns on our investment in BSF could be reduced. Accordingly, our investment in BSF may be subject to up to 100% loss.
We may in the future determine to fund a portion of our investments with preferred stock, which would magnify the potential for gain or loss and the risks of investing in us in the same way as our borrowings.
Preferred stock, which is another form of leverage, has the same risks to our common stockholders as borrowings because the dividends on any preferred stock we issue must be cumulative. Payment of such dividends and repayment of the liquidation preference of such preferred stock must take preference over any dividends or other payments to our common stockholders, and preferred stockholders are not subject to any of our expenses or losses and are not entitled to participate in any income or appreciation in excess of their stated preference.
We may experience fluctuations in our quarterly results.
We could experience fluctuations in our quarterly operating results due to a number of factors, including our ability or inability to make investments in companies that meet our investment criteria, the interest rate payable on the debt securities we acquire, the level of our expenses, variations in and the timing of the recognition of realized and unrealized gains or losses, the degree to which we encounter competition in our markets and general economic conditions. As a result of these factors, results for any period should not be relied upon as being indicative of performance in future periods.
Our Board of Directors may change our investment objectives, operating policies and strategies without prior notice or stockholder approval, the effects of which may be adverse.
The Board has the authority to modify or waive our current investment objectives, operating policies and strategies without prior notice and without stockholder approval (except as required by the 1940 Act). However, absent stockholder approval, we may not change the nature of our business so as to cease to be, or withdraw our election as, a BDC. We cannot predict the effect any changes to our current operating policies, investment criteria and strategies would have on our business, net asset value, operating results and value of our stock. However, the effects might be adverse, which could negatively impact our ability to pay you distributions and cause you to lose all or part of your investment. Moreover, we will have significant flexibility in investing the net proceeds from any future offering and may use the net proceeds from such offerings in ways with which investors may not agree or for purposes other than those contemplated at the time of the offering.
43
We will be subject to corporate-level U.S. federal income tax if we are unable to maintain our tax treatment as a regulated investment company under Subchapter M of the Code, which will adversely affect our results of operations and financial condition.
We have elected to be treated as a RIC under the Code, which generally will allow us to avoid being subject to corporate-level U.S. federal income tax. To obtain and maintain RIC tax treatment under the Code, we must meet the following annual distribution, income source and asset diversification requirements:
• |
The Annual Distribution Requirement for a RIC will be satisfied if we distribute to our stockholders on an annual basis at least 90.0% of our net ordinary income and net short-term capital gain in excess of net long-term capital loss, or ICTI. if any. We will be subject to a 4.0% nondeductible U.S. federal excise tax, however, to the extent that we do not satisfy certain additional minimum distribution requirements on a calendar year basis. Because we use debt financing, we are subject to certain asset coverage ratio requirements under the 1940 Act and are currently, and may in the future become, subject to certain financial covenants under loan and credit agreements that could, under certain circumstances, restrict us from making distributions necessary to satisfy the Annual Distribution Requirement. If we are unable to obtain cash from other sources, we could fail to qualify for RIC tax treatment and thus become subject to corporate-level U.S. federal income tax. |
• |
The income source requirement will be satisfied if we obtain at least 90.0% of our income for each year from distributions, interest, gains from the sale of stock or securities or similar sources. |
• |
The asset diversification requirement will be satisfied if we meet certain asset diversification requirements at the end of each quarter of our taxable year. To satisfy this requirement, at least 50.0% of the value of our assets must consist of cash, cash equivalents, U.S. government securities, securities of other RICs, and other acceptable securities; and no more than 25.0% of the value of our assets can be invested in the securities, other than U.S. government securities or securities of other RICs, of one issuer, of two or more issuers that are controlled, as determined under applicable Code rules, by us and that are engaged in the same or similar or related trades or businesses or of certain “qualified publicly traded partnerships.” Failure to meet these requirements may result in our having to dispose of certain investments quickly in order to prevent the loss of RIC tax treatment. Because most of our investments will be in private companies, and therefore will be relatively illiquid, any such dispositions could be made at disadvantageous prices and could result in substantial losses. |
If we fail to qualify for or maintain RIC tax treatment for any reason and are subject to corporate-level U.S. federal income tax, the resulting corporate taxes could substantially reduce our net assets, the amount of income available for distribution and the amount of our distributions. We may also be subject to certain U.S. federal excise taxes, as well as state, local and foreign taxes.
We may not be able to pay distributions to our stockholders, our distributions may not grow over time, a portion of distributions paid to our stockholders may be a return of capital and investors in any debt securities we may issue may not receive all of the interest income to which they are entitled.
We intend to pay quarterly distributions to our stockholders out of assets legally available for distribution. We cannot assure you that we will achieve investment results that will allow us to make a specified level of cash distributions or year-to-year increases in cash distributions. Our ability to pay distributions might be harmed by, among other things, the risk factors described in this Annual Report. In addition, the inability to satisfy the asset coverage test applicable to us as a BDC could, in the future, limit our ability to pay distributions. All distributions will be paid at the discretion of the Board and will depend on our earnings, our financial condition, maintenance of our RIC tax treatment, compliance with applicable BDC regulations, compliance with the covenants of the August 2018 Credit Facility and any debt securities we may issue and such other factors as the Board may deem relevant from time to time. We cannot assure you that we will pay distributions to our stockholders in the future.
The above-referenced restrictions on distributions may also inhibit our ability to make required interest payments to holders of any debt securities we may issue, which may cause a default under the terms of our debt agreements. Such a default could materially increase our cost of raising capital, as well as cause us to incur penalties under the terms of our debt agreements.
44
When we make quarterly distributions, we will be required to determine the extent to which such distributions are paid out of current or accumulated earnings and profits, recognized capital gain or capital. To the extent there is a return of capital, investors will be required to reduce their basis in our stock for U.S. federal income tax purposes, which may result in a higher tax liability when the shares are sold, even if they have not increased in value or have lost value.
We may have difficulty paying our required distributions if we recognize income before or without receiving cash representing such income.
For U.S. federal income tax purposes, we may be required to recognize taxable income in circumstances in which we do not receive a corresponding payment in cash. For example, if we hold debt obligations that are treated under applicable tax rules as having original issue discount (such as debt instruments with contractual PIK interest or, in certain cases, increasing interest rates or debt instruments that were issued with warrants), we must include in income each year a portion of the original issue discount that accrues over the life of the obligation, regardless of whether cash representing such income is received by us in the same taxable year. Investments structured with these features may represent a higher level of credit risk compared to investments generating income which must be paid in cash on a current basis. We may also have to include in income other amounts that we have not yet received in cash, such as deferred loan origination fees that are paid after origination of the loan or are paid in non-cash compensation such as warrants or stock. We anticipate that a portion of our income may constitute original issue discount or other income required to be included in taxable income prior to receipt of cash. Further, we may elect to amortize market discounts and include such amounts in our taxable income in the current year, instead of upon disposition, as an election not to do so would limit our ability to deduct interest expenses for U.S. federal income tax purposes.
Because any original issue discount or other amounts accrued will be included in our ICTI for the year of the accrual, we may be required to make a distribution to our stockholders in order to satisfy the annual distribution requirement, even though we will not have received any corresponding cash amount. As a result, we may have difficulty meeting the annual distribution requirement necessary to obtain and maintain RIC tax treatment under the Code. We may have to sell some of our investments at times and/or at prices we would not consider advantageous, raise debt or additional equity capital or forgo new investment opportunities for this purpose. If we are not able to obtain cash from other sources, we may fail to qualify for RIC tax treatment and thus become subject to corporate-level U.S. federal income tax. For additional discussion regarding the tax implications of a RIC, see “Material U.S. Federal Income Tax Considerations — Taxation as a RIC” included in Item 1 of Part 1 of this Annual Report.
Because we intend to distribute substantially all of our income to our stockholders to maintain our tax treatment as a regulated investment company, we will continue to need additional capital to finance our growth, and regulations governing our operation as a business development company will affect our ability to, and the way in which we, raise additional capital and make distributions.
In order to satisfy the requirements applicable to a RIC, and to avoid payment of U.S. federal excise tax, we intend to distribute to our stockholders substantially all of our net ordinary income and net capital gain income except for certain net long-term capital gains recognized after we became a RIC, some or all of which we may retain, pay applicable U.S. federal income taxes with respect thereto and elect to treat as deemed distributions to our stockholders. As a BDC, we generally are required to meet a coverage ratio of total assets to total senior securities, which includes all of our borrowings and any preferred stock we may issue, of at least 150%. This requirement limits the amount that we may borrow and may prohibit us from making distributions. If the value of our assets declines, we may be unable to satisfy this test. If that happens, we may be required to sell a portion of our investments or sell additional securities and, depending on the nature of our leverage, to repay a portion of our indebtedness at a time when such sales may be disadvantageous. In addition, issuance of additional securities could dilute the percentage ownership of our current stockholders in us.
While we expect to be able to borrow and to issue debt and additional equity securities, we cannot assure you that debt and equity financing will be available to us on favorable terms, or at all. If additional funds are not available to us, we could be forced to curtail or cease new investment activities, and our net asset value could
45
decline. In addition, as a BDC, we generally are not permitted to issue equity securities priced below our then-current net asset value per share without stockholder approval.
We cannot predict how tax reform legislation will affect us, our investments, or our stockholders, and any such legislation could adversely affect our business.
Legislative or other actions relating to taxes could have a negative effect on us. On December 22, 2017, the Tax Cuts and Jobs Act was enacted into law. The Tax Cuts and Jobs Act made changes to the Internal Revenue Code, including significant changes to, among other things, the taxation of business entities, the deductibility of interest expense, and the tax treatment of capital investment. We cannot predict with certainty how any future changes in the tax laws might affect us, our stockholders, our subsidiaries or our portfolio investments. New legislation and any U.S. Treasury regulations, administrative interpretations or court decisions interpreting such legislation could significantly and negatively affect our ability to qualify for tax treatment as a RIC or the U.S. federal income tax consequences to us and our stockholders of such qualification, or could have other adverse consequences. Stockholders are urged to consult with their tax advisor regarding tax legislative, regulatory, or administrative developments and proposals and their potential effect on an investment in our securities.
Changes to U.S. tariff and import/export regulations may have a negative effect on our portfolio companies and, in turn, harm us.
There has been ongoing discussion and commentary regarding potential significant changes to U.S. trade policies, treaties and tariffs. The current U.S. presidential administration, along with the U.S. Congress, has created significant uncertainty about the future relationship between the United States and other countries with respect to trade policies, treaties and tariffs. These developments, or the perception that any of them could occur, may have a material adverse effect on global economic conditions and the stability of global financial markets, and may significantly reduce global trade and, in particular, trade between the impacted nations and the United States. Any of these factors could depress economic activity and restrict our portfolio companies’ access to suppliers or customers and have a material adverse effect on their business, financial condition and results of operations, which in turn would negatively impact us.
Changes in laws or regulations governing our operations may adversely affect our business or cause us to alter our business strategy.
We, our subsidiaries and our portfolio companies are subject to regulation at the local, state and federal level. New legislation may be enacted or new interpretations, rulings or regulations could be adopted, including those governing the types of investments we are permitted to make, any of which could harm us and our stockholders, potentially with retroactive effect.
Additionally, any changes to the laws and regulations governing our operations relating to permitted investments may cause us to alter our investment strategy in order to avail ourselves of new or different opportunities. Such changes could result in material differences to the strategies and plans set forth in this Annual Report and may result in our investment focus shifting from the areas of expertise of our management team to other types of investments in which our management team may have less expertise or little or no experience. Thus, any such changes, if they occur, could have a material adverse effect on our results of operations and the value of your investment.
Efforts to comply with the Sarbanes-Oxley Act involve significant expenditures, and non-compliance with the Sarbanes-Oxley Act may adversely affect us and the market price of our securities.
We are subject to the Sarbanes-Oxley Act and the related rules and regulations promulgated by the SEC. Among other requirements, under Section 404 of the Sarbanes-Oxley Act and rules and regulations of the SEC thereunder, our management is required to report on our internal control over financial reporting. We are required to review, on an annual basis, our internal control over financial reporting, and to evaluate and disclose, on a quarterly and annual basis, significant changes in our internal control over financial reporting. We have and expect to continue to incur significant expenses related to compliance with the Sarbanes-Oxley Act. In addition, this process results in a
46
diversion of management’s time and attention. In the event that we are unable to maintain compliance with the Sarbanes-Oxley Act and related rules, we may be adversely affected.
We are highly dependent on information systems and systems failures or cyberattacks could significantly disrupt our business, which may, in turn, negatively affect the market price of our common stock and our ability to pay dividends and other distributions.
Our business depends on the communications and information systems of Barings, its affiliates and our other third-party service providers. These systems are subject to potential attacks, including through adverse events that threaten the confidentiality, integrity or availability of our information resources (i.e., cyber incidents). These attacks could involve gaining unauthorized access to our information systems for purposes of misappropriating assets, stealing confidential information, corrupting data or causing operational disruption and result in disrupted operations, misstated or unreliable financial data, liability for stolen assets or information, increased cybersecurity protection and insurance costs, litigation and damage to our business relationships, any of which could, in turn, have a material adverse effect on our operating results and negatively affect the market price of our securities and our ability to pay dividends and other distributions to our securityholders. As our reliance on technology has increased, so have the risks posed to our information systems, both internal and those provided by Barings, its affiliates and other third-party service providers.
Our business and operations may be negatively affected by securities litigation or stockholder activism, which could cause us to incur significant expense, hinder execution of our investment strategy and impact our stock price.
In the past, following periods of volatility in the market price of a company’s securities, securities class-action litigation has often been brought against that company. In addition, stockholder activism, which could take many forms, including making public demands that we consider strategic alternatives, engaging in public campaigns to attempt to influence our corporate governance and/or our management, and commencing proxy contests to attempt to elect the activists' representatives or others to the Board, or arise in a variety of situations, has been increasing in the BDC space recently. For example, we and certain of our former executive officers have been named defendants in two separate class-action lawsuits asserting claims under Section 10(b) and Section 20(a) of the Exchange Act, and, due to the potential volatility of our stock price and for a variety of other reasons, we may in the future become the target of further securities litigation or stockholder activism. See “Legal Proceedings” in Item 3 of Part I of this Annual Report for more information. Securities litigation and stockholder activism, including potential proxy contests, may result in substantial costs and divert management’s and the Board's attention and resources from our business. Additionally, such securities litigation and stockholder activism could give rise to perceived uncertainties as to our future, adversely affect our relationships with service providers and make it more difficult for Barings to attract and retain qualified personnel. Also, we may be required to incur significant legal fees and other expenses related to any securities litigation and activist stockholder matters. Further, our stock price could be subject to significant fluctuation or otherwise be adversely affected by the events, risks and uncertainties of any securities litigation and stockholder activism.
Risks Relating to Our Investments
Our investments in portfolio companies may be risky, and we could lose all or part of our investment.
Our portfolio consists primarily of syndicated senior secured loans and senior secured private middle-market debt and equity investments. Investing in private and middle-market companies involves a number of significant risks. Among other things, these companies:
• |
may have limited financial resources to meet future capital needs and thus may be unable to grow or meet their obligations under their debt instruments that we hold, which may be accompanied by a deterioration in the value of any collateral and a reduction in the likelihood of us realizing any guarantees from subsidiaries or affiliates of our portfolio companies that we may have obtained in connection with our investment, as well as a corresponding decrease in the value of the equity components of our investments; |
47
• |
may have shorter operating histories, narrower product lines, smaller market shares and/or more significant customer concentration than larger businesses, which tend to render them more vulnerable to competitors’ actions and market conditions, as well as general economic downturns; |
• |
are more likely to depend on the management talents and efforts of a small group of persons; therefore, the death, disability, resignation or termination of one or more of these persons could have a material adverse impact on our portfolio company and, in turn, on us; |
• |
generally have less predictable operating results, may be engaged in rapidly changing businesses with products subject to a substantial risk of obsolescence, and may require substantial additional capital to support their operations, finance expansion or maintain their competitive position; and |
• |
generally have less publicly available information about their businesses, operations and financial condition. We rely on the ability of Barings' investment professionals to obtain adequate information to evaluate the potential returns from investing in these companies. If Barings is unable to uncover all material information about these companies, we may not make a fully informed investment decision, and we may lose all or part of our investment. |
In addition, in the course of providing significant managerial assistance to certain of our portfolio companies, certain of our officers and directors or certain of Barings' investment professionals may serve as directors on the boards of such companies. We or Barings may in the future be subject to litigation that arises out of our investments in these companies, and our officers and directors or Barings and/or its investment professionals may be named as defendants in such litigation, which could result in an expenditure of funds (through our indemnification of such officers and directors) and the diversion of our officers', directors' and Barings' time and resources.
The lack of liquidity in our investments may adversely affect our business.
We generally invest in companies whose securities are not publicly traded, and whose securities may be subject to legal and other restrictions on resale, or are otherwise less liquid than publicly traded securities. The illiquidity of these investments may make it difficult for us to sell these investments when desired. In addition, if we are required to liquidate all or a portion of our portfolio quickly, we may realize significantly less than the value at which we had previously recorded these investments. Our investments may be subject to contractual or legal restrictions on resale or are otherwise illiquid because there may be no established trading market for certain investments. The illiquidity of certain of our investments may make it difficult for us to dispose of them at a favorable price, and, as a result, we may suffer losses.
Price declines and illiquidity in the corporate debt markets may adversely affect the fair value of our portfolio investments, reducing our net asset value through increased net unrealized depreciation.
As a BDC, we are required to carry our investments at market value or, if no market value is ascertainable, at fair value as determined in good faith by the Board. As part of the valuation process, we may take into account the following types of factors, if relevant, in determining the fair value of our investments:
• |
a comparison of the portfolio company’s securities to publicly traded securities; |
• |
the enterprise value of the portfolio company; |
• |
the nature and realizable value of any collateral; |
• |
the portfolio company’s ability to make payments and its earnings and discounted cash flow; |
• |
the markets in which the portfolio company does business; and |
• |
changes in the interest rate environment and the credit markets generally that may affect the price at which similar investments may be made in the future and other relevant factors. |
When an external event such as a purchase transaction, public offering or subsequent equity sale occurs, we use the pricing indicated by the external event to corroborate our valuation. We record decreases in the market values or fair values of our investments as unrealized depreciation. Declines in prices and liquidity in the corporate debt markets may result in significant net unrealized depreciation in our portfolio. The effect of all of these factors
48
on our portfolio may reduce our net asset value by increasing net unrealized depreciation in our portfolio. Depending on market conditions, we could incur substantial realized losses and may suffer additional unrealized losses in future periods, which could have a material adverse effect on our business, financial condition, results of operations and cash flows.
Our failure to make follow-on investments in our portfolio companies could impair the value of our portfolio.
Following an initial investment in a portfolio company, we may make additional investments in that portfolio company as “follow-on” investments, in seeking to:
• |
increase or maintain in whole or in part our position as a creditor or equity ownership percentage in a portfolio company; |
• |
exercise warrants, options or convertible securities that were acquired in the original or subsequent financing; or |
• |
preserve or enhance the value of our investment. |
We have discretion to make follow-on investments, subject to the availability of capital resources. Failure on our part to make follow-on investments may, in some circumstances, jeopardize the continued viability of a portfolio company and our initial investment, or may result in a missed opportunity for us to increase our participation in a successful portfolio company. Even if we have sufficient capital to make a desired follow-on investment, we may elect not to make a follow-on investment because we may not want to increase our level of risk, because we prefer other opportunities or because of regulatory or other considerations. Our ability to make follow-on investments may also be limited by Barings’ allocation policy.
Our portfolio companies may incur debt that ranks equally with, or senior to, our investments in such companies and such portfolio companies may not generate sufficient cash flow to service their debt obligations to us.
We typically invest in senior debt and first lien notes, however, we have invested, and may invest in the future, a portion of our capital in second lien and subordinated loans issued by our portfolio companies. Our portfolio companies may have, or be permitted to incur, other debt that ranks equally with, or senior to, the debt securities in which we invest. Such subordinated investments are subject to greater risk of default than senior obligations as a result of adverse changes in the financial condition of the obligor or in general economic conditions. If we make a subordinated investment in a portfolio company, the portfolio company may be highly leveraged, and its relatively high debt-to-equity ratio may create increased risks that its operations might not generate sufficient cash flow to service all of its debt obligations. By their terms, such debt instruments may provide that the holders are entitled to receive payment of interest or principal on or before the dates on which we are entitled to receive payments in respect of the securities in which we invest. These debt instruments would usually prohibit the portfolio companies from paying interest on or repaying our investments in the event of and during the continuance of a default under such debt. Also, in the event of insolvency, liquidation, dissolution, reorganization or bankruptcy of a portfolio company, holders of securities ranking senior to our investment in that portfolio company would typically be entitled to receive payment in full before we receive any distribution in respect of our investment. After repaying senior creditors, the portfolio company may not have any remaining assets to use for repaying its obligation to us where we are junior creditor. In the case of debt ranking equally with debt securities in which we invest, we would have to share any distributions on an equal and ratable basis with other creditors holding such debt in the event of an insolvency, liquidation, dissolution, reorganization or bankruptcy of the relevant portfolio company.
Additionally, certain loans that we make to portfolio companies may be secured on a second priority basis by the same collateral securing senior secured debt of such companies. The first priority liens on the collateral will secure the portfolio company’s obligations under any outstanding senior debt and may secure certain other future debt that may be permitted to be incurred by the portfolio company under the agreements governing the loans. The holders of obligations secured by first priority liens on the collateral will generally control the liquidation of, and be entitled to receive proceeds from, any realization of the collateral to repay their obligations in full before us. In addition, the value of the collateral in the event of liquidation will depend on market and economic conditions, the
49
availability of buyers and other factors. There can be no assurance that the proceeds, if any, from sales of all of the collateral would be sufficient to satisfy the loan obligations secured by the second priority liens after payment in full of all obligations secured by the first priority liens on the collateral. If such proceeds were not sufficient to repay amounts outstanding under the loan obligations secured by the second priority liens, then we, to the extent not repaid from the proceeds of the sale of the collateral, will only have an unsecured claim against the portfolio company’s remaining assets, if any.
We may in the future make unsecured loans to portfolio companies, meaning that such loans will not benefit from any interest in collateral of such companies. Liens on a portfolio company’s collateral, if any, will secure the portfolio company’s obligations under its outstanding secured debt and may secure certain future debt that is permitted to be incurred by the portfolio company under its secured loan agreements. The holders of obligations secured by such liens will generally control the liquidation of, and be entitled to receive proceeds from, any realization of such collateral to repay their obligations in full before us. In addition, the value of such collateral in the event of liquidation will depend on market and economic conditions, the availability of buyers and other factors. There can be no assurance that the proceeds, if any, from sales of such collateral would be sufficient to satisfy our unsecured loan obligations after payment in full of all loans secured by collateral. If such proceeds were not sufficient to repay the outstanding secured loan obligations, then our unsecured claims would rank equally with the unpaid portion of such secured creditors’ claims against the portfolio company’s remaining assets, if any.
The rights we may have with respect to the collateral securing any junior priority loans we make to our portfolio companies may also be limited pursuant to the terms of one or more intercreditor agreements that we enter into with the holders of senior debt. Under a typical intercreditor agreement, at any time that obligations that have the benefit of the first priority liens are outstanding, any of the following actions that may be taken in respect of the collateral will be at the direction of the holders of the obligations secured by the first priority liens:
• |
the ability to cause the commencement of enforcement proceedings against the collateral; |
• |
the ability to control the conduct of such proceedings; |
• |
the approval of amendments to collateral documents; |
• |
releases of liens on the collateral; and |
• |
waivers of past defaults under collateral documents. |
We may not have the ability to control or direct such actions, even if our rights as junior lenders are adversely affected.
There may be circumstances where our debt investments could be subordinated to claims of other creditors or we could be subject to lender liability claims.
Even though we have structured the majority of our investments as senior loans, if one of our portfolio companies were to go bankrupt, depending on the facts and circumstances and based upon principles of equitable subordination as defined by existing case law, a bankruptcy court could subordinate all or a portion of our claim to that of other creditors and transfer any lien securing such subordinated claim to the bankruptcy estate. The principles of equitable subordination defined by case law have generally indicated that a claim may be subordinated only if its holder is guilty of misconduct or where the senior loan is re-characterized as an equity investment and the senior lender has actually provided significant managerial assistance to the bankrupt debtor. We may also be subject to lender liability claims for actions taken by us with respect to a borrower’s business or instances where we exercise control over the borrower. It is possible that we could become subject to a lender’s liability claim, including as a result of actions taken in rendering managerial assistance or actions to compel and collect payments from the borrower outside the ordinary course of business.
50
Second priority liens on collateral securing loans that we make to our portfolio companies may be subject to control by senior creditors with first priority liens. If there is a default, the value of the collateral may not be sufficient to repay in full both the first priority creditors and us.
Certain loans that we make are secured by a second priority security interest in the same collateral pledged by a portfolio company to secure senior debt owed by the portfolio company to commercial banks or other traditional lenders. Often the senior lender has procured covenants from the portfolio company prohibiting the incurrence of additional secured debt without the senior lender’s consent. Prior to and as a condition of permitting the portfolio company to borrow money from us secured by the same collateral pledged to the senior lender, the senior lender will require assurances that it will control the disposition of any collateral in the event of bankruptcy or other default. In many such cases, the senior lender will require us to enter into an “intercreditor agreement” prior to permitting the portfolio company to borrow from us. Typically the intercreditor agreements we are requested to execute expressly subordinate our debt instruments to those held by the senior lender and further provide that the senior lender shall control: (i) the commencement of foreclosure or other proceedings to liquidate and collect on the collateral; (ii) the nature, timing and conduct of foreclosure or other collection proceedings; (iii) the amendment of any collateral document; (iv) the release of the security interests in respect of any collateral and (v) the waiver of defaults under any security agreement. Because of the control we may cede to senior lenders under intercreditor agreements we may enter, we may be unable to realize the proceeds of any collateral securing some of our loans.
Finally, the value of the collateral securing our debt investment will ultimately depend on market and economic conditions, the availability of buyers and other factors. Therefore, there can be no assurance that the proceeds, if any, from the sale or sales of all of the collateral would be sufficient to satisfy the loan obligations secured by our second priority liens after payment in full of all obligations secured by the senior lender’s first priority liens on the collateral. There is also a risk that such collateral securing our investments may decrease in value over time, may be difficult to sell in a timely manner, may be difficult to appraise and may fluctuate in value based upon the success of the portfolio company and market conditions. If such proceeds are not sufficient to repay amounts outstanding under the loan obligations secured by our second priority liens, then we, to the extent not repaid from the proceeds from the sale of the collateral, will only have an unsecured claim against the company’s remaining assets, if any.
Our investments in foreign companies may involve significant risks in addition to the risks inherent in U.S. investments.
Our investment strategy contemplates potential investments in foreign companies. Investing in foreign companies may expose us to additional risk not typically associated with investing in U.S. companies. These risks include changes in exchange control regulations, political and social instability, expropriation, imposition of foreign taxes (potentially at confiscatory levels), less liquid markets, less available information than is generally the case in the United States, higher transaction costs, less government supervision of exchanges, brokers and issuers, less developed bankruptcy laws, difficulty in enforcing contractual obligations, lack of uniform accounting and auditing standards and greater price volatility.
Although most of our investments will be U.S.-dollar denominated, our investments that are denominated in a foreign currency will be subject to the risk that the value of a particular currency will change in relation to one or more other currencies. Among the factors that may affect currency values are trade balances, the level of short-term interest rates, differences in relative values of similar assets in different currencies, long-term opportunities for investment and capital appreciation and political developments. We may employ hedging techniques to minimize these risks, but we cannot assure you that such strategies will be effective or without risk to us.
If we do not invest a sufficient portion of our assets in qualifying assets, we could fail to qualify as a business development company or be precluded from investing according to our current business strategy.
As a BDC, we may not acquire any assets other than “qualifying assets” unless, at the time of and after giving effect to such acquisition, at least 70.0% of our total assets are qualifying assets. For further detail, see “Regulation of Business Development Companies” included in Item 1 of Part I of this Annual Report.
51
We may be precluded from investing in what we believe are attractive investments if such investments are not qualifying assets for purposes of the 1940 Act. If we do not invest a sufficient portion of our assets in qualifying assets, we could lose our status as a BDC. If we fail to maintain our status as a BDC, we might be regulated as a closed-end investment company that is required to register under the 1940 Act, which would subject us to additional regulatory restrictions and significantly decrease our operating flexibility. In addition, any such failure could cause an event of default under our outstanding indebtedness. For these reasons, loss of BDC status likely would have a material adverse effect on our business, financial condition and results of operations. Similarly, these rules could prevent us from making follow-on investments in existing portfolio companies (which could result in the dilution of our position).
We are a non-diversified investment company within the meaning of the 1940 Act, and therefore we are not limited with respect to the proportion of our assets that may be invested in securities of a single issuer.
We are classified as a non-diversified investment company within the meaning of the 1940 Act, which means that we are not limited by the 1940 Act with respect to the proportion of our assets that we may invest in securities of a single issuer. To the extent that we assume large positions in the securities of a small number of issuers, our net asset value may fluctuate to a greater extent than that of a diversified investment company as a result of changes in the financial condition or the market’s assessment of the issuer. We may also be more susceptible to any single economic or regulatory occurrence than a diversified investment company. Beyond our RIC asset diversification requirements under the Code, we do not have fixed guidelines for diversification, and our investments could be concentrated in relatively few portfolio companies.
We generally will not control our portfolio companies.
We do not, and do not expect to, control most of our portfolio companies, even though we or Barings may have board representation or board observation rights, and our debt agreements may contain certain restrictive covenants. As a result, we are subject to the risk that a portfolio company in which we invest may make business decisions with which we disagree, and the management of such company, as representatives of the holders of their common equity, may take risks or otherwise act in ways that do not serve our interests as debt investors. Due to the lack of liquidity for our investments in non-traded companies, we may not be able to dispose of our interests in our portfolio companies as readily as we would like or at an appropriate valuation. As a result, a portfolio company may make decisions that could decrease the value of our portfolio holdings.
Economic recessions or downturns could impair our portfolio companies and harm our operating results.
Many of our portfolio companies may be susceptible to economic downturns or recessions and may be unable to repay our loans during these periods. Therefore, during these periods our non-performing assets may increase and the value of these assets may decrease. Adverse economic conditions may also decrease the value of collateral securing some of our loans and the value of our equity investments. Economic slowdowns or recessions could lead to financial losses in our portfolio and a decrease in revenues, net income and assets. Unfavorable economic conditions also could increase our funding costs, limit our access to the capital markets or result in a decision by lenders not to extend credit to us. These events could prevent us from increasing investments and harm our operating results.
A portfolio company’s failure to satisfy financial or operating covenants imposed by us or other lenders could lead to defaults and, potentially, termination of its loans and foreclosure on its assets, which could trigger cross-defaults under other agreements and jeopardize our portfolio company’s ability to meet its obligations under the debt securities that we hold. We may incur expenses to the extent necessary to seek recovery upon default or to negotiate new terms with a defaulting portfolio company.
52
Prepayments of our debt investments by our portfolio companies could adversely impact our results of operations and reduce our return on equity.
We are subject to the risk that the investments we make in our portfolio companies may be repaid prior to maturity. When this occurs, we will generally reinvest these proceeds in temporary investments, pending their future investment in new portfolio companies. These temporary investments will typically have substantially lower yields than the debt being prepaid and we could experience significant delays in reinvesting these amounts. Any future investment in a new portfolio company may also be at lower yields than the debt that was repaid. As a result, our results of operations could be materially adversely affected if one or more of our portfolio companies elect to prepay amounts owed to us. Additionally, prepayments could negatively impact our return on equity, which could result in a decline in the market price of our securities.
Potential writedowns or losses with respect to portfolio investments existing and to be made in the future could adversely affect our results of operations, cash flows, dividend level, net asset value and stock price.
In light of current economic conditions, in the future, certain of our portfolio companies may be unable to service our debt investments on a timely basis. These conditions may also decrease the value of collateral securing some of our debt investments, as well as the value of our equity investments. As a result, the number of non-performing assets in our portfolio may increase, and the overall value of our portfolio may decrease, which could lead to financial losses in our portfolio and a decrease in our investment income, net investment income, dividends and assets.
Any unrealized losses we experience on our loan portfolio may be an indication of future realized losses, which could reduce our income available for distribution.
As a BDC, we are required to carry our investments at market value or, if no market value is ascertainable, at the fair value as determined in good faith by the Board. Decreases in the market values or fair values of our investments will be recorded as unrealized depreciation. Any unrealized losses in our loan portfolio could be an indication of a portfolio company’s inability to meet its repayment obligations to us with respect to the affected loans. This could result in realized losses in the future and ultimately in reductions of our income available for distribution in future periods.
Defaults by our portfolio companies may harm our operating results.
A portfolio company’s failure to satisfy financial or operating covenants imposed by us or other lenders could lead to defaults and, potentially, termination of its loans and foreclosure on its secured assets, which could trigger cross-defaults under other agreements and jeopardize a portfolio company’s ability to meet its obligations under the debt or equity securities that we hold. We may incur expenses to the extent necessary to seek recovery upon default or to negotiate new terms, which may include the waiver of certain financial covenants, with a defaulting portfolio company.
Changes in interest rates may affect our cost of capital, the value of our investments and results of operations.
An increase in interest rates would make it more expensive to use debt to finance our investments. As a result, a significant increase in market interest rates could both reduce the value of our portfolio investments and increase our cost of capital, which would reduce our net investment income. Also, an increase in interest rates available to investors could make an investment in our common stock less attractive if we are not able to increase our distribution rate, a situation which could reduce the value of our common stock. Conversely, a decrease in interest rates may have an adverse impact on our returns by requiring us to seek lower yields on our debt investments and by increasing the risk that our portfolio companies will prepay our debt investments, resulting in the need to redeploy capital at potentially lower rates.
53
Our portfolio may be concentrated in a limited number of portfolio companies and industries, which will subject us to a risk of significant loss if any of these companies defaults on its obligations under any of its debt instruments or if there is a downturn in a particular industry.
Our portfolio may be concentrated in a limited number of portfolio companies and industries. As a result, the aggregate returns we realize may be significantly and adversely affected if a small number of investments perform poorly or if we need to write down the value of any one investment. Additionally, while we are not targeting any specific industries, our investments may be concentrated in relatively few industries. For example, although we classify the industries of our portfolio companies by end-market (such as healthcare or business services) and not by the products or services (such as software) directed to those end-markets, many of our portfolio companies principally provide software products or services, which exposes us to downturns in that sector. As a result, a downturn in any particular industry in which we are invested could also significantly impact the aggregate returns we realize.
We may not realize gains from our equity investments.
Certain investments that we have made in the past and may make in the future include equity securities. Investments in equity securities involve a number of significant risks, including the risk of further dilution as a result of additional issuances, inability to access additional capital and failure to pay current distributions. Investments in preferred securities involve special risks, such as the risk of deferred distributions, credit risk, illiquidity and limited voting rights. In addition, we may from time to time make non-control, equity co-investments in companies in conjunction with private equity sponsors. Our goal is ultimately to realize gains upon our disposition of such equity interests. However, the equity interests we receive may not appreciate in value and, in fact, may decline in value. Accordingly, we may not be able to realize gains from our equity interests, and any gains that we do realize on the disposition of any equity interests may not be sufficient to offset any other losses we experience. We also may be unable to realize any value if a portfolio company does not have a liquidity event, such as a sale of the business, recapitalization or public offering, which would allow us to sell the underlying equity interests.
Risks Relating to Our Securities
Shares of closed-end investment companies, including business development companies, frequently trade at a discount to their net asset value, and may trade at premiums that may prove to be unsustainable.
Shares of closed-end investment companies, including BDCs, frequently trade at a discount from net asset value, and may trade at premiums that may prove to be unsustainable. This characteristic of closed-end investment companies and BDCs is separate and distinct from the risk that our net asset value per share may decline. We cannot predict whether our common stock will trade at, above or below net asset value. The risk of purchasing shares of a BDC that might trade at a discount or unsustainable premium is more pronounced for investors who wish to sell their shares in a relatively short period of time because, for those investors, realization of a gain or loss on their investments is likely to be more dependent upon changes in premium or discount levels than upon increases or decreases in net asset value per share. As of December 31, 2018, the closing price of our common stock on the NYSE was $9.01 per share, an approximately 17.9% discount to our net asset value per share as of December 31, 2018. In addition, at times when our common stock trades below net asset value, we will generally not be able to issue additional common stock at the market price without first obtaining the approval of our stockholders and our independent directors.
Investing in our securities may involve an above average degree of risk.
The investments we make in accordance with our investment objective may result in a higher amount of risk than alternative investment options and a higher risk of volatility or loss of principal. Our investments in portfolio companies may be highly speculative, and therefore, an investment in our shares may not be suitable for someone with lower risk tolerance.
54
The market price of our securities may be volatile and fluctuate significantly.
Fluctuations in the trading prices of our shares may adversely affect the liquidity of the trading market for our shares and, if we seek to raise capital through future equity financings, our ability to raise such equity capital. The market price and liquidity of the market for our securities may be significantly affected by numerous factors, some of which are beyond our control and may not be directly related to our operating performance. These factors include:
• |
significant volatility in the market price and trading volume of securities of BDCs or other companies in our sector, which are not necessarily related to the operating performance of these companies; |
• |
changes in regulatory policies or tax guidelines, particularly with respect to RICs, or BDCs ; |
• |
inability to obtain certain exemptive relief from the SEC; |
• |
loss of RIC tax treatment; |
• |
changes in earnings or variations in operating results; |
• |
changes in the value of our portfolio of investments; |
• |
any shortfall in investment income or net investment income or any increase in losses from levels expected by investors or securities analysts; |
• |
conversion features of subscription rights, warrants or convertible debt; |
• |
loss of a major funding source; |
• |
fluctuations in interest rates; |
• |
the operating performance of companies comparable to us; |
• |
departure of Barings' or any of its affiliates key personnel; |
• |
proposed, or completed, offerings of our securities, including classes other than our common stock; |
• |
global or national credit market changes; and |
• |
general economic trends and other external factors. |
The market for any security is subject to volatility. The loans and securities purchased by us and issued by us are no exception to this fundamental investment truism that prices will fluctuate.
We may be unable to invest a significant portion of the net proceeds raised from our offerings on acceptable terms, which would harm our financial condition and operating results.
Delays in investing the net proceeds raised in our offerings may cause our performance to be worse than that of other fully invested BDCs or other lenders or investors pursuing comparable investment strategies. We cannot assure you that we will be able to identify any investments that meet our investment objective or that any investment that we make will produce a positive return. We may be unable to invest the net proceeds from any offering on acceptable terms within the time period that we anticipate or at all, which could harm our financial condition and operating results.
We anticipate that, depending on market conditions, it may take a substantial period of time to invest substantially all of the net proceeds from any offering in securities meeting our investment objective. During such a period, we have and will continue to invest the net proceeds from any offering primarily in cash, cash equivalents, U.S. government securities, repurchase agreements and high-quality debt instruments maturing in one year or less from the time of investment, which may produce returns that are significantly lower than the returns which we expect to achieve when our portfolio is fully invested in securities meeting our investment objective, and given our expense ratio and the prevailing interest rate climate, there is a possible risk of losing money on the offering proceeds from certain securities, such as debt securities during this interval. As a result, any dividends or distributions that we pay during such period may be substantially lower than the dividends or distributions that we may be able to pay when our portfolio is fully invested in securities meeting our investment objective. In addition, until such time as the net proceeds from any offering are invested in securities meeting our investment objective, the
55
market price for our securities may decline. Thus, the return on your investment may be lower than when, if ever, our portfolio is fully invested in securities meeting our investment objective.
Sales of substantial amounts of our common stock in the public market may have an adverse effect on the market price of our common stock.
Sales of substantial amounts of our common stock, or the availability of such common stock for sale, could adversely affect the prevailing market prices for our common stock. If this occurs and continues, it could impair our ability to raise additional capital through the sale of securities should we desire to do so.
If we sell common stock at a discount to our net asset value per share, stockholders who do not participate in such sale will experience immediate dilution in an amount that may be material.
If we sell or otherwise issue shares of our common stock at a discount to net asset value, it will pose a risk of dilution to our stockholders. In particular, stockholders who do not purchase additional shares at or below the discounted price in proportion to their current ownership will experience an immediate decrease in net asset value per share (as well as in the aggregate net asset value of their shares if they do not participate at all). These stockholders will also experience a disproportionately greater decrease in their participation in our earnings and assets and their voting power than the increase we experience in our assets, potential earning power and voting interests from such issuances or sale. In addition, such issuances or sales may adversely affect the price at which our common stock trades.
Provisions of the Maryland General Corporation Law and our charter and bylaws could deter takeover attempts and have an adverse impact on the price of our common stock.
The Maryland General Corporation Law and our charter and bylaws contain provisions that may have the effect of discouraging, delaying or making difficult a change in control of our Company or the removal of our incumbent directors. Specifically, the Board has adopted a resolution explicitly subjecting us to the Maryland Business Combination Act under the Maryland General Corporation Law, which, subject to limitations, prohibits certain business combinations between us and an “interested stockholder” (defined generally as any person who beneficially owns 10% or more of the voting power of our outstanding voting stock) or an affiliate thereof for five years after the most recent date on which the stockholder becomes an interested stockholder and thereafter imposes fair price and/or supermajority voting requirements on these combinations. In addition, our charter classifies the Board in three classes serving staggered three-year terms and provides that a director may be removed only for cause by the vote of at least two-thirds of the votes entitled to be cast for the election of directors generally. In addition, our bylaws provide that, subject to the satisfaction of certain procedural and informational requirements by the stockholders requesting the meeting, a special meeting of stockholders will be called by our secretary to act upon any matter that may properly be considered at a meeting of stockholders only upon the written request of the stockholders entitled to cast at least a majority of all the votes entitled to be cast on such matter at the meeting.
In addition, subject to the provisions of the 1940 Act, our charter permits the Board, without stockholder action, to authorize the issuance of shares of stock in one or more classes or series, including preferred stock. Subject to compliance with the 1940 Act, the Board may, without stockholder action, amend our charter from time to time to increase or decrease the number of shares of stock of any class or series that we have authority to issue. The existence of these provisions, among others, may have a negative impact on the price of our common stock and may discourage third-party bids for ownership of our company. These provisions may prevent any premiums being offered to you for shares of our common stock.
If we issue preferred stock and/or debt securities, the net asset value and market value of our common stock may become more volatile.
We cannot assure you that the issuance of preferred stock and/or debt securities would result in a higher yield or return to the holders of our common stock. The issuance of preferred stock and/or debt securities would likely cause the net asset value and market value of our common stock to become more volatile. If the dividend rate on the preferred stock, or the interest rate on the debt securities, were to approach the net rate of return on our investment portfolio, the benefit of leverage to the holders of our common stock would be reduced. If the dividend rate on the
56
preferred stock, or the interest rate on the debt securities, were to exceed the net rate of return on our portfolio, the use of leverage would result in a lower rate of return to the holders of common stock than if we had not issued the preferred stock or debt securities. Any decline in the net asset value of our investment would be borne entirely by the holders of our common stock. Therefore, if the market value of our portfolio were to decline, the leverage would result in a greater decrease in net asset value to the holders of our common stock than if we were not leveraged through the issuance of preferred stock. This decline in net asset value would also tend to cause a greater decline in the market price for our common stock.
There is also a risk that, in the event of a sharp decline in the value of our net assets, we would be in danger of failing to maintain required asset coverage ratios which may be required by the preferred stock and/or debt securities or of a downgrade in the ratings of the preferred stock and/or debt securities or our current investment income might not be sufficient to meet the dividend requirements on the preferred stock or the interest payments on the debt securities. In order to counteract such an event, we might need to liquidate investments in order to fund redemption of some or all of the preferred stock and/or debt securities. In addition, we would pay (and the holders of our common stock would bear) all costs and expenses relating to the issuance and ongoing maintenance of the preferred stock and/or debt securities. Holders of preferred stock and/or debt securities may have different interests than holders of common stock and may at times have disproportionate influence over our affairs.
There is a risk that investors in our common stock may not receive a specified level of dividends or that our dividends may not grow over time and that investors in any debt securities we may issue may not receive all of the interest income to which they are entitled.
We intend to make distributions on a quarterly basis to our stockholders out of assets legally available for distribution. We cannot assure you that we will achieve investment results that will allow us to make a specified level of cash distributions or year-to-year increases in cash distributions. If we declare a dividend and if more stockholders opt to receive cash distributions rather than participate in our dividend reinvestment plan, we may be forced to sell some of our investments in order to make cash dividend payments.
In addition, due to the asset coverage test applicable to us as a BDC and under covenants under the August 2018 Credit Facility, we may be limited in our ability to make distributions. Further, if we invest a greater amount of assets in equity securities that do not pay current dividends, it could reduce the amount available for distribution. See “Market for Registrant’s Common Equity, Related Stockholder Matters and Issuer Purchases of Equity Securities — Distribution Policy” included in Item 5 of Part II of this Annual Report for further discussion of distributions.
The above-referenced restrictions on distributions may also inhibit our ability to make required interest payments to holders of any future debt we may issue, which may cause a default under the terms of the relevant debt agreements. Such a default could materially increase our cost of raising capital, as well as cause us to incur penalties under the terms of our debt agreements.
Our stockholders may experience dilution in their ownership percentage if they opt out of our dividend reinvestment plan.
All dividends declared in cash payable to stockholders that are participants in our dividend reinvestment plan are automatically reinvested in shares of our common stock. As a result, our stockholders that opt out of our dividend reinvestment plan may experience dilution in their ownership percentage of our common stock over time.
Future offerings of debt securities, which would be senior to our common stock upon liquidation, or equity securities, which could dilute our existing stockholders and may be senior to our common stock for the purposes of distributions, may harm the value of our common stock.
In the future, we may attempt to increase our capital resources by making offerings of debt securities or additional equity securities, including commercial paper, medium-term notes, senior or subordinated notes and classes of preferred stock or common stock subject to the restrictions of the 1940 Act. Upon a liquidation of our company, holders of our debt securities and shares of preferred stock and lenders with respect to other borrowings would receive a distribution of our available assets prior to the holders of our common stock. Additional equity
57
offerings by us may dilute the holdings of our existing stockholders or reduce the value of our common stock, or both. Any preferred stock we may issue would have a preference on distributions that could limit our ability to make distributions to the holders of our common stock. Because our decision to issue securities in any future offering will depend on market conditions and other factors beyond our control, we cannot predict or estimate the amount, timing or nature of our future offerings. Thus, our stockholders bear the risk of our future offerings reducing the market price of our common stock and diluting their stock holdings in us. In addition, proceeds from a sale of common stock will likely be used to increase our total assets or to pay down our borrowings, among other uses. This would increase our asset coverage ratio and permit us to incur additional leverage under rules pertaining to BDCs by increasing our borrowings or issuing senior securities such as preferred stock or debt securities.
You may have a current tax liability on distributions reinvested in our common stock pursuant to our dividend reinvestment plan or otherwise but would not receive cash from such distributions to pay such tax liability.
If you participate in our dividend reinvestment plan, you will be deemed to have received, and for U.S. federal income tax purposes will be taxed on, the amount reinvested in our common stock to the extent the amount reinvested was not a tax-free return of capital. As a result, unless you are a tax-exempt entity, you may have to use funds from other sources to pay your tax liability on the value of our common stock received from the distribution.
In addition, in order to satisfy the annual distribution requirement applicable to RICs, we have the ability to declare a large portion of a dividend in shares of our common stock instead of in cash. As long as a portion of such dividend is paid in cash (which portion may be as low as 20% of such dividend) and certain requirements are met, the entire distribution will be treated as a dividend for U.S. federal income tax purposes. As a result, a stockholder generally would be subject to tax on 100% of the fair market value of the dividend on the date the dividend is received by the stockholder in the same manner as a cash dividend, even though most of the dividend was paid in shares of our common stock. We currently do not intend to pay dividends in shares of our common stock other than in connection with our dividend reinvestment plan.
Terrorist attacks, acts of war or national disasters may affect any market for our securities, impact the businesses in which we invest and harm our business, operating results and financial condition.
Terrorist acts, acts of war or national disasters may disrupt our operations, as well as the operations of the businesses in which we invest. Such acts have created, and continue to create, economic and political uncertainties and have contributed to global economic instability. Future terrorist activities, military or security operations, or natural disasters could further weaken the domestic/global economies and create additional uncertainties, which may negatively impact the businesses in which we invest directly or indirectly and, in turn, could have a material adverse impact on our business, operating results and financial condition. Losses from terrorist attacks and natural disasters are generally uninsurable.
Item 1B. Unresolved Staff Comments.
None.
Item 2. Properties.
We do not own any real estate or other physical properties materially important to our operation or any of our subsidiaries. Our headquarters are currently located at 300 South Tryon Street, Suite 2500 Charlotte, North Carolina 28202, where we occupy office space pursuant to the Administration Agreement with Barings. We believe that our current office facilities are adequate to meet our needs.
58
Item 3. Legal Proceedings.
We and certain of our former executive officers have been named as defendants in two putative securities class action lawsuits, each filed in the United States District Court for the Southern District of New York (and then transferred to the United States District Court for the Eastern District of North Carolina) on behalf of all persons who purchased or otherwise acquired our common stock between May 7, 2014 and November 1, 2017. The first lawsuit was filed on November 21, 2017, and was captioned Elias Dagher, et al., v. Triangle Capital Corporation, et al., Case No. 5:18-cv-00015-FL (the "Dagher Action"). The second lawsuit was filed on November 28, 2017, and was captioned Gary W. Holden, et al., v. Triangle Capital Corporation, et al., Case No. 5:18-cv-00010-FL (the "Holden Action"). The Dagher Action and the Holden Action were consolidated and are currently captioned In re Triangle Capital Corp. Securities Litigation, Master File No. 5:18-cv-00010-FL.
On April 10, 2018, the plaintiff filed its First Consolidated Amended Complaint. The complaint, as currently amended, alleges certain violations of the securities laws, including, among other things, that the defendants made certain materially false and misleading statements and omissions regarding the Company’s business, operations and prospects between May 7, 2014 and November 1, 2017. The plaintiff seeks compensatory damages and attorneys’ fees and costs, among other relief, but did not specify the amount of damages being sought. On May 25, 2018, the defendants filed a motion to dismiss the complaint. On July 9, 2018, the plaintiff filed its response in opposition to the defendants’ motion to dismiss. The motion to dismiss was fully briefed as of July 31, 2018.
We and certain current and former members of the Board have been named as defendants in three other putative securities class action lawsuits challenging our 2018 Special Meeting Proxy Statement seeking shareholder approval of the Asset Purchase Agreement and the Externalization Agreement. The first lawsuit was filed on July 6, 2018 in the United States District Court for the Eastern District of North Carolina, and is captioned Carlson, et al. v. Triangle Capital Corporation, et al., Case No. 5:18-cv-00332-FL (the "Carlson Action"). The second lawsuit was filed on July 9, 2018 in the United States District Court for the District of Maryland, and is captioned Hammer, et al. v. Triangle Capital Corporation, et al., Case No. 1:18-cv-02086-RDB (the "Hammer Action"). The third lawsuit was filed on July 12, 2018 in the United States District Court for the District of Maryland, and is captioned Kent, et al. v. Triangle Capital Corporation, et al., Case No. 1:18-cv-0237-ELH (the "Kent Action"). The complaints in the Carlson Action, the Hammer Action, and the Kent Action each allege certain violations of the securities laws, including, among other things, that the defendants made certain material omissions in the 2018 Special Meeting Proxy Statement, and each sought to enjoin the shareholder meeting scheduled for July 24, 2018, among other relief.
On July 11, 2018, the plaintiff in the Carlson Action filed a motion for preliminary injunction seeking to enjoin the July 24, 2018 shareholder vote and to require that certain supplemental disclosures be made. On July 16, 2018, the court denied the plaintiff’s motion for preliminary injunction. The Kent Action was voluntarily dismissed on September 20, 2018. The Carlson Action was voluntarily dismissed on October 22, 2018. The Hammer Action was voluntarily dismissed on November 21, 2018.
We intend to defend ourselves vigorously against the allegations in the aforementioned actions. Neither the outcome of the lawsuits nor an estimate of any reasonably possible losses is determinable at this time. An adverse judgment for monetary damages could have a material adverse effect on our operations and liquidity. Except as discussed above, neither we nor our subsidiaries are currently subject to any material pending legal proceedings, other than ordinary routine litigation incidental to our business.
Item 4. Mine Safety Disclosures.
Not applicable.
59
PART II
Item 5. Market for Registrant’s Common Equity, Related Stockholder Matters and Issuer Purchases of Equity Securities.
Common Stock and Holders
Our common stock is traded on the New York Stock Exchange, or NYSE, under the ticker symbol “BBDC.” As of February 27, 2019, there were approximately 31 holders of record of our common stock. This number does not include stockholders for whom shares are held in “nominee” or “street name.”
Distributions Declared
The table below shows the detail of our distributions for the years ended December 31, 2018 and 2017:
Year Ended December 31, |
||||||||||||||
2018 |
2017 |
|||||||||||||
Amount |
% of Total |
Amount |
% of Total |
|||||||||||
Ordinary income |
$ |
0.41 |
95.3 |
% |
$ |
1.65 |
100.0 |
% |
||||||
Long-term capital gains |
— |
— |
— |
— |
||||||||||
Tax return of capital |
0.02 |
4.7 |
— |
— |
||||||||||
Total reported on IRS Form 1099-DIV |
$ |
0.43 |
100.0 |
% |
$ |
1.65 |
100.0 |
% |
||||||
Each year, a statement on IRS Form 1099-DIV identifying the source(s) of the distribution (i.e., paid from ordinary income, paid from net capital gains on the sale of securities, and/or a return of paid in capital surplus which is a nontaxable distribution) is mailed to our stockholders. To the extent that our distributions for a fiscal year exceed current and accumulated earnings and profits, a portion of those distributions may be deemed a return of capital to our stockholders for U.S. federal income tax purposes. Thus, the source of a distribution to our stockholders may be the original capital invested by the stockholder rather than our taxable ordinary income or capital gains. Stockholders should read any written disclosure accompanying a dividend payment carefully and should not assume that any distribution is taxable as ordinary income or capital gains.
Ordinary income is reported on IRS Form 1099-DIV as either qualified or non-qualified and capital gain distributions are reported on IRS Form 1099-DIV in various subcategories which have differing tax treatments to stockholders. Those subcategories are not presented herein.
Distribution Policy
We generally intend to make distributions on a quarterly basis to our stockholders of substantially all of our income. In order to avoid certain excise taxes imposed on RICs, we must distribute during each calendar year an amount at least equal to the sum of (i) 98.0% of our ordinary income for the calendar year, (ii) 98.2% of our capital gains in excess of capital losses for the calendar year, and (iii) any ordinary income and net capital gains for the preceding year that were not distributed during such year. We will not be subject to excise taxes on amounts on which we are required to pay corporate income tax (such as retained net capital gains). In order to obtain the tax benefits applicable to RICs, we will be required to distribute to our stockholders with respect to each taxable year at least 90.0% of our ordinary income and realized net short-term capital gains in excess of realized net long-term capital losses. We may retain for investment realized net long-term capital gains in excess of realized net short-term capital losses. We may make deemed distributions to our stockholders of any retained net capital gains. If this happens, our stockholders will be treated as if they received an actual distribution of the capital gains we retain and then reinvested the net after-tax proceeds in our common stock. Our stockholders also may be eligible to claim a tax credit (or, in certain circumstances, a tax refund) equal to their allocable share of the tax we paid on the capital gains deemed distributed to them. Please refer to “Business — Material U.S. Federal Income Tax Considerations” included in Item 1 of Part I of this Annual Report for further information regarding the consequences of our retention of net capital gains. We may, in the future, make actual distributions to our stockholders of some or all realized net long-term capital gains in excess of realized net short-term capital losses. We can offer no assurance that
60
we will achieve results that will permit the payment of any cash distributions and, if we issue senior securities, we will be prohibited from making distributions if doing so causes us to fail to maintain the asset coverage ratio and related requirements stipulated by the 1940 Act or if distributions are limited by the terms of any of our borrowings. See “Business — Regulation of Business Development Companies” included in Item 1 of Part I of this Annual Report.
We have adopted a dividend reinvestment plan that provides for reinvestment of our distributions on behalf of our common stockholders, unless a common stockholder elects to receive cash as provided in “Business — Dividend Reinvestment Plan” included in Item I of Part I of this Annual Report on Form 10-K.
Stockholders who receive dividends in the form of stock generally are subject to the same federal, state and local tax consequences as are stockholders who elect to receive their dividends in cash. A stockholder’s basis for determining gain or loss upon the sale of stock received in a dividend from us will be equal to the total dollar amount of the dividend payable to the stockholder. Any stock received in a dividend will have a holding period for tax purposes commencing on the day following the day on which the shares are credited to the U.S. stockholder’s account.
Our ability to make distributions will be limited by the asset coverage requirement and related provisions under the 1940 Act and in any applicable indenture and related supplements. For a more detailed discussion, see “Business — Regulation of Business Development Companies” included in Item 1 of Part I of this Annual Report.
Sales of Unregistered Securities
Except as reported in our Current Report on Form 8-K filed with the SEC on August 2, 2018, we did not sell any securities during the period covered by this report that were not registered under the Securities Act of 1933, as amended.
61
Issuer Purchases of Equity Securities
During the three months ended December 31, 2018, in connection with our dividend reinvestment plan for our common stockholders, we directed the plan administrator to purchase 6,307 shares of our common stock in the open market for $55,365 in order to satisfy our obligations to deliver shares of common stock to our stockholders with respect to our dividend declared on October 11, 2018.
Barings entered into the 10b5-1 Plan on September 24, 2018. Pursuant to the 10b5-1 Plan, an independent broker made purchases of shares of our common stock on the open market on behalf of Barings in accordance with purchase guidelines specified in the 10b5-1 Plan. The 10b5-1 Plan was established in accordance with Barings’ obligation under the Externalization Agreement to enter into a trading plan pursuant to which Barings committed to purchase $50.0 million in value of shares in open market transactions through an independent broker. As of February 11, 2019, Barings had fulfilled its obligations under the 10b5-1 Plan to purchase an aggregate amount of $50.0 million in shares of our common stock and the 10b5-1 Plan terminated in accordance with its terms. Upon completion of the 10b5-1 Plan on February 11, 2019, Barings had purchased 5,084,302 shares of our common stock pursuant to the 10b5-1 Plan and owned a total of 13,639,681 shares of our common stock, or 26.6% of the total shares outstanding.
The following chart summarizes repurchases of our common stock for the three months ended December 31, 2018, including information regarding Baring' purchases of our common stock pursuant to the 10b5-1 Plan:
Period |
Total number of shares purchased(1)
|
Average price paid per share |
Total number of
shares purchased
as part of publicly
announced plans
or programs(2)
|
Approximate dollar value of shares that
may yet be
purchased under the plans or programs
|
||||||||||
October 1 through October 31, 2018 |
1,365,299 |
$ |
10.10 |
1,365,299 |
$ |
32,919,969 |
||||||||
November 1 through November 30, 2018 |
1,113,342 |
$ |
10.04 |
1,113,342 |
$ |
21,736,979 |
||||||||
December 1 through December 31, 2018(3)
|
1,245,250 |
(4) |
$ |
9.44 |
1,238,943 |
$ |
10,042,567 |
|||||||
(1) |
Includes purchases of our common stock made on the open market by or on behalf of any “affiliated purchaser,” as defined in Exchange Act Rule 10b-18(a)(3), of the Company. |
(2) |
Includes shares purchased by certain of our affiliates, including pursuant to the 10b5-1 Plan, which Barings entered into on September 24, 2018. During the three months ended December 31, 2018, Barings repurchased 3,717,584 shares of our common stock for approximately $36.7 million under the 10b5-1 Plan. |
(3) |
As of December 31, 2018, Barings had purchased 4,045,248 shares of our common stock pursuant to the 10b5-1 Plan and owned a total of 12,600,627 shares of our common stock, or 24.6% of the total shares outstanding. Subsequent to period-end, through February 11, 2019, Barings purchased an additional 1,039,054 shares of our common stock pursuant to the 10b5-1 Plan. |
(4) |
6,307 of such shares were purchased in the open market pursuant to the terms of our dividend reinvestment plan. |
Performance Graph
The following graph compares the cumulative total return on our common stock with the cumulative total return of the Barings BDC, Inc. Peer Group Index, the Wells Fargo Business Development Company Index, the Nasdaq Composite Index and the NYSE Composite Index for the five years ended December 31, 2018. This comparison assumes $100.00 was invested in our common stock at the closing price of our common stock on December 31, 2013 and in the comparison groups and assumes the reinvestment of all cash dividends on the ex-dividend date prior to any tax effect. The stock price performance shown on the graph below is not necessarily indicative of future price performance.
For 2018, we changed our comparison peer group from the Barings BDC, Inc. Peer Group Index to the Wells Fargo Business Development Company Index. The Wells Fargo Business Development Company Index represents a broader group of business development companies against which we measure our operating results.
62
Comparison of Annual Cumulative Total Return(1)
among Barings BDC, Inc., the Barings BDC, Inc. Peer Group Index,
the Wells Fargo Business Development Company Index,
the Nasdaq Composite Index and the NYSE Composite Index
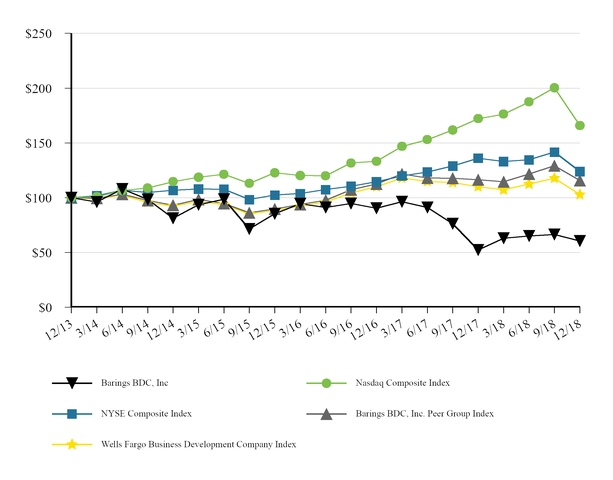
12/31/13 |
3/31/14 |
6/30/14 |
9/30/14 |
12/31/14 |
3/31/15 |
6/30/15 |
9/30/15 |
12/31/15 |
|||||||||||||||||||
Barings BDC, Inc. |
100.00 |
96.03 |
108.00 |
98.49 |
81.27 |
93.62 |
98.60 |
71.51 |
85.32 |
||||||||||||||||||
NASDAQ Composite Index |
100.00 |
100.94 |
106.60 |
108.85 |
114.62 |
118.68 |
121.34 |
113.05 |
122.81 |
||||||||||||||||||
NYSE Composite Index |
100.00 |
101.84 |
106.91 |
104.81 |
106.75 |
107.97 |
107.76 |
98.34 |
102.38 |
||||||||||||||||||
Barings BDC, Inc. Peer Group Index(2) |
100.00 |
99.43 |
103.24 |
97.49 |
93.02 |
98.49 |
94.83 |
86.32 |
89.82 |
||||||||||||||||||
Wells Fargo Business Development Company Index |
100.00 |
99.07 |
102.45 |
95.66 |
92.21 |
96.64 |
93.63 |
85.10 |
88.41 |
||||||||||||||||||
3/31/16 |
6/30/16 |
9/30/16 |
12/31/16 |
3/31/17 |
6/30/17 |
9/30/17 |
12/31/17 |
|||||||||||||||||||
Barings BDC, Inc. |
94.47 |
91.11 |
94.72 |
90.31 |
96.26 |
91.11 |
76.32 |
52.34 |
||||||||||||||||||
NASDAQ Composite Index |
120.28 |
119.98 |
131.64 |
133.19 |
146.79 |
152.94 |
161.80 |
172.11 |
||||||||||||||||||
NYSE Composite Index |
103.75 |
107.40 |
110.48 |
114.61 |
119.86 |
123.53 |
128.98 |
136.07 |
||||||||||||||||||
Barings BDC, Inc. Peer Group Index(2) |
93.87 |
97.59 |
107.18 |
112.52 |
121.70 |
118.09 |
117.85 |
116.32 |
||||||||||||||||||
Wells Fargo Business Development Company Index |
92.38 |
96.16 |
104.35 |
110.00 |
117.90 |
114.79 |
113.78 |
110.10 |
||||||||||||||||||
63
3/31/18 |
6/30/18 |
9/30/18 |
12/31/18 |
|||||||||||||||||||
Barings BDC, Inc. |
62.95 |
65.04 |
66.45 |
60.43 |
||||||||||||||||||
NASDAQ Composite Index |
176.27 |
187.44 |
200.36 |
165.84 |
||||||||||||||||||
NYSE Composite Index |
133.05 |
134.56 |
141.63 |
123.89 |
||||||||||||||||||
Barings BDC, Inc. Peer Group Index(2) |
114.64 |
121.71 |
129.09 |
115.73 |
||||||||||||||||||
Wells Fargo Business Development Company Index |
107.19 |
112.46 |
117.87 |
102.86 |
||||||||||||||||||
(1) |
From December 31, 2013 to December 31, 2018.
|
(2) |
The Barings BDC, Inc. Peer Group consists of the following companies: Apollo Investment Corporation, Ares Capital Corporation, BlackRock Capital Investment Corporation, Fidus Investment Corporation, Gladstone Investment Corporation, Gladstone Capital Corporation, Golub Capital BDC, Inc., Horizon Technology Finance Corporation, Hercules Capital, Inc., KCAP Financial, Inc., Main Street Capital Corporation, Medley Capital Corporation, New Mountain Finance Corporation, Oaktree Specialty Lending Corporation, PennantPark Investment Corporation, Prospect Capital Corporation, Solar Capital Ltd. and THL Credit, Inc. |
64
Item 6. Selected Financial Data.
The selected financial data at and for the fiscal years ended December 31, 2014, 2015, 2016, 2017 and 2018 have been derived from our financial statements that have been audited by Ernst & Young LLP, an independent registered public accounting firm. You should read this selected financial and other data in conjunction with our “Management’s Discussion and Analysis of Financial Condition and Results of Operations” and the financial statements and notes thereto.
Year Ended December 31, |
||||||||||||||||||||
2014 |
2015 |
2016 |
2017 |
2018 |
||||||||||||||||
(Dollars and share amounts in thousands, except per share data) |
||||||||||||||||||||
Income statement data: |
||||||||||||||||||||
Investment income: |
||||||||||||||||||||
Total loan interest, fee and dividend income |
$ |
104,273 |
$ |
121,062 |
$ |
113,332 |
$ |
122,290 |
$ |
78,238 |
||||||||||
Interest income from cash and cash equivalent investments |
238 |
225 |
348 |
715 |
1,985 |
|||||||||||||||
Total investment income |
104,511 |
121,287 |
113,680 |
123,005 |
80,223 |
|||||||||||||||
Operating expenses: |
||||||||||||||||||||
Interest and other financing fees |
21,180 |
26,754 |
26,721 |
29,261 |
23,887 |
|||||||||||||||
Base management fee |
— |
— |
— |
— |
4,219 |
|||||||||||||||
Compensation expenses |
17,562 |
19,009 |
23,676 |
16,136 |
37,487 |
|||||||||||||||
General and administrative expenses |
3,753 |
3,895 |
4,406 |
5,370 |
16,178 |
|||||||||||||||
Total operating expenses |
42,495 |
49,658 |
54,803 |
50,767 |
81,771 |
|||||||||||||||
Base management fee waived |
— |
— |
— |
— |
(1,487 |
) |
||||||||||||||
Net operating expenses |
42,495 |
49,658 |
54,803 |
50,767 |
80,284 |
|||||||||||||||
Net investment income (loss) |
62,016 |
71,629 |
58,877 |
72,238 |
(61 |
) |
||||||||||||||
Net realized gains (losses): |
||||||||||||||||||||
Non-Control/Non-Affiliate investments |
7,396 |
9,003 |
(2,414 |
) |
(3,683 |
) |
(130,870 |
) |
||||||||||||
Affiliate investments |
7,733 |
2,315 |
4,399 |
(3,980 |
) |
9,939 |
||||||||||||||
Control investments |
(1,498 |
) |
(38,807 |
) |
— |
(45,206 |
) |
(38,542 |
) |
|||||||||||
Net realized gains (losses) on investments |
13,631 |
(27,489 |
) |
1,985 |
(52,869 |
) |
(159,473 |
) |
||||||||||||
Foreign currency borrowings |
— |
— |
— |
1,269 |
1,081 |
|||||||||||||||
Net realized gains (losses) |
13,631 |
(27,489 |
) |
1,985 |
(51,600 |
) |
(158,392 |
) |
||||||||||||
Net unrealized appreciation (depreciation): |
||||||||||||||||||||
Non-Control/Non-Affiliate investments |
(38,467 |
) |
(23,583 |
) |
(9,080 |
) |
(65,786 |
) |
27,025 |
|||||||||||
Affiliate investments |
(3,213 |
) |
2,839 |
(5,473 |
) |
(7,356 |
) |
3,198 |
||||||||||||
Control investments |
(3,554 |
) |
23,876 |
(11,464 |
) |
27,547 |
24,387 |
|||||||||||||
Net unrealized appreciation (depreciation) on investments |
(45,234 |
) |
3,132 |
(26,017 |
) |
(45,595 |
) |
54,610 |
||||||||||||
Foreign currency borrowings |
1,071 |
2,363 |
(153 |
) |
(2,822 |
) |
(864 |
) |
||||||||||||
Net unrealized appreciation (depreciation) |
(44,163 |
) |
5,495 |
(26,170 |
) |
(48,417 |
) |
53,746 |
||||||||||||
Net realized and unrealized (losses) on investments and foreign currency borrowings |
(30,532 |
) |
(21,994 |
) |
(24,185 |
) |
(100,017 |
) |
(104,646 |
) |
||||||||||
Loss on extinguishment of debt |
— |
(1,394 |
) |
— |
— |
(10,507 |
) |
|||||||||||||
Benefit from (Provision for) taxes |
(3,122 |
) |
(384 |
) |
(436 |
) |
(871 |
) |
932 |
|||||||||||
Net increase (decrease) in net assets resulting from operations |
$ |
28,362 |
$ |
47,857 |
$ |
34,256 |
$ |
(28,650 |
) |
$ |
(114,282 |
) |
||||||||
Net investment income (loss) per share — basic and diluted |
$ |
2.08 |
$ |
2.16 |
$ |
1.62 |
$ |
1.55 |
$ |
— |
||||||||||
Net increase (decrease) in net assets resulting from operations per share — basic and diluted |
$ |
0.95 |
$ |
1.44 |
$ |
0.94 |
$ |
(0.62 |
) |
$ |
(2.29 |
) |
||||||||
Net asset value per common share |
$ |
16.11 |
$ |
15.23 |
$ |
15.13 |
$ |
13.43 |
$ |
10.98 |
||||||||||
Quarterly dividends/distributions per share |
$ |
2.16 |
$ |
2.16 |
$ |
1.89 |
$ |
1.65 |
$ |
0.43 |
||||||||||
Supplemental dividends/distributions per share |
0.40 |
0.20 |
— |
— |
— |
|||||||||||||||
Total dividends/distributions declared per share |
$ |
2.56 |
$2.36 |
$1.89 |
$1.65 |
$0.43 |
||||||||||||||
Weighted average number of shares outstanding — basic and diluted |
29,775 |
33,234 |
36,405 |
46,498 |
49,897 |
|||||||||||||||
65
Year Ended December 31, |
||||||||||||||||||||
2014 |
2015 |
2016 |
2017 |
2018 |
||||||||||||||||
(Dollars in thousands) |
||||||||||||||||||||
Balance sheet data: |
||||||||||||||||||||
Assets: |
||||||||||||||||||||
Investments at fair value |
$ |
887,223 |
$ |
977,277 |
$ |
1,037,907 |
$ |
1,016,284 |
$ |
1,121,856 |
||||||||||
Cash and cash equivalents |
78,759 |
52,615 |
107,088 |
191,850 |
12,427 |
|||||||||||||||
Interest and fees receivable |
7,409 |
4,892 |
10,190 |
7,807 |
6,009 |
|||||||||||||||
Prepaid expenses and other current assets |
439 |
947 |
1,660 |
1,855 |
2,732 |
|||||||||||||||
Deferred income taxes |
— |
— |
— |
— |
1,391 |
|||||||||||||||
Deferred financing fees |
1,231 |
3,480 |
2,700 |
5,186 |
252 |
|||||||||||||||
Receivable from unsettled transactions |
— |
— |
— |
— |
22,910 |
|||||||||||||||
Property and equipment, net |
109 |
106 |
106 |
81 |
— |
|||||||||||||||
Total assets |
$ |
975,170 |
$ |
1,039,317 |
$ |
1,159,651 |
$ |
1,223,063 |
$ |
1,167,577 |
||||||||||
Liabilities: |
||||||||||||||||||||
Accounts payable and accrued liabilities |
$ |
7,145 |
$ |
7,464 |
$ |
6,797 |
$ |
9,863 |
$ |
5,026 |
||||||||||
Interest payable |
3,365 |
3,714 |
3,997 |
3,997 |
750 |
|||||||||||||||
Taxes payable |
2,506 |
735 |
490 |
796 |
301 |
|||||||||||||||
Deferred income taxes |
3,364 |
4,988 |
2,054 |
1,332 |
— |
|||||||||||||||
Payable from unsettled transactions |
— |
— |
— |
— |
28,533 |
|||||||||||||||
Borrowings under credit facilities |
62,620 |
131,257 |
127,012 |
156,071 |
570,000 |
|||||||||||||||
Notes |
145,646 |
162,142 |
162,755 |
163,408 |
— |
|||||||||||||||
SBA-guaranteed debentures payable |
219,697 |
220,649 |
245,390 |
246,321 |
— |
|||||||||||||||
Total liabilities |
444,343 |
530,949 |
548,495 |
581,788 |
604,610 |
|||||||||||||||
Net assets |
530,827 |
508,368 |
611,156 |
641,275 |
562,967 |
|||||||||||||||
Total liabilities and net assets |
$ |
975,170 |
$ |
1,039,317 |
$ |
1,159,651 |
$ |
1,223,063 |
$ |
1,167,577 |
||||||||||
Other data: |
||||||||||||||||||||
Weighted average yield on total investments(1)(2) |
11.6 |
% |
10.6 |
% |
10.2 |
% |
9.6 |
% |
6.2 |
% |
||||||||||
Number of portfolio companies |
91 |
92 |
88 |
89 |
139 |
|||||||||||||||
Expense ratios (as percentage of average net assets): |
||||||||||||||||||||
Base management fee (net), compensation and general and administrative expenses |
4.4 |
% |
4.4 |
% |
5.0 |
% |
3.2 |
% |
9.0 |
% |
||||||||||
Interest and other financing fees |
4.4 |
5.1 |
4.8 |
4.4 |
3.8 |
|||||||||||||||
Total expenses, net of base management fee waived |
8.8 |
% |
9.5 |
% |
9.8 |
% |
7.6 |
% |
12.8 |
% |
||||||||||
Ratio of total expenses, net of base management fee waived, including loss on extinguishment of debt and (provision for) benefit from taxes, to average net assets |
9.5 |
% |
9.8 |
% |
9.9 |
% |
7.7 |
% |
14.3 |
% |
||||||||||
(1) |
Excludes non-accrual debt investments. |
(2) |
2018 weighted average yield of 6.2% represents the aggregate of the weighted average yield of the middle-market private debt portfolio and the syndicated senior loan portfolio. As of December 31, 2018 the weighted average yield on our syndicated senior secured loan portfolio and our middle-market private debt portfolio was approximately 5.8% and 7.6%, respectively.
|
66
Item 7. Management’s Discussion and Analysis of Financial Condition and Results of Operations.
The information in this section contains forward-looking statements that involve risks and uncertainties. Please see “Risk Factors” and “Forward-Looking Statements” for a discussion of the uncertainties, risks and assumptions associated with these statements. You should read the following discussion in conjunction with the combined financial statements and related notes and other financial information appearing elsewhere in this Annual Report.
The following discussion is designed to provide a better understanding of our financial statements, including a brief discussion of our business, key factors that impacted our performance and a summary of our operating results. The following discussion should be read in conjunction with the consolidated financial statements and the notes thereto included in Item 8 of this Annual Report on Form 10-K. Historical results and percentage relationships among any amounts in the financial statements are not necessarily indicative of trends in operating results for any future periods.
The Asset Sale and Externalization Transactions
On April 3, 2018, we entered into an asset purchase agreement, or the Asset Purchase Agreement, with BSP Asset Acquisition I, LLC, or the Asset Buyer (an affiliate of Benefit Street Partners L.L.C., or BSP), pursuant to which we agreed to sell our December 31, 2017 investment portfolio to the Asset Buyer for gross proceeds of $981.2 million in cash, subject to certain adjustments to take into account portfolio activity and other matters occurring since December 31, 2017, such transaction referred to herein as the Asset Sale Transaction.
Also on April 3, 2018, we entered into a stock purchase and transaction agreement, or the Externalization Agreement, with Barings LLC, or Barings, through which Barings agreed to become the investment adviser to the Company in exchange for (1) a payment by Barings of $85.0 million, or approximately $1.78 per share, directly to our stockholders, (2) an investment by Barings of $100.0 million in newly issued shares of our common stock at net asset value and (3) a commitment from Barings to purchase up to $50.0 million of shares of our common stock in the open market at prices up to and including our then-current net asset value per share for a two-year period, after which Barings agreed to use any remaining funds from the $50.0 million to purchase additional newly issued shares of our common stock at the greater of our then-current net asset value per share and market price (collectively, the Externalization Transaction). The Asset Sale Transaction and the Externalization Transaction are collectively referred to as the Transactions. The Transactions were approved by our stockholders at our July 24, 2018 special meeting of stockholders (the 2018 Special Meeting).
The Asset Sale Transaction closed on July 31, 2018. The gross cash proceeds received from the Asset Buyer and certain affiliates of the Asset Buyer in connection with the Asset Sale Transaction were approximately $793.3 million, after adjustments to take into account portfolio activity and other matters occurring since December 31, 2017, as described in greater detail in the Asset Purchase Agreement. Adjustments to the purchase price included, among other things, approximately $208.8 million of principal payments and prepayments, sales proceeds and distributions related to the investment portfolio that were received and retained by us between December 31, 2017 and the closing of the Asset Sale Transaction, offset by approximately $29.5 million of loans and equity investments originated by us between December 31, 2017 and the closing of the Asset Sale Transaction.
In connection with the closing of the Asset Sale Transaction, we caused notices to be issued to the holders of our December 2022 Notes and March 2022 Notes (each as defined in our consolidated financial statements for the fiscal year ended December 31, 2018 and notes thereto) regarding the redemption of all $80.5 million in aggregate principal amount of the December 2022 Notes and all $86.3 million in aggregate principal amount of the March 2022 Notes, in each case, on August 30, 2018. The December 2022 Notes and the March 2022 Notes were redeemed at 100% of their principal amount ($25.00 per Note), plus the accrued and unpaid interest thereon from June 15, 2018 to, but excluding, August 30, 2018. In furtherance of the redemption, on July 31, 2018, we irrevocably deposited with The Bank of New York Mellon Trust Company, N.A., as trustee under the indenture and supplements thereto relating to the December 2022 Notes and the March 2022 Notes, funds in trust for the purposes of redeeming all of the issued and outstanding December 2022 Notes and March 2022 Notes and paying all sums due and payable under the indenture and supplements thereto. As a result, our obligations under the indenture and supplements thereto relating to the December 2022 Notes and the March 2022 Notes were satisfied and discharged as of July 31,
67
2018, except with respect to those obligations that the indenture expressly provides shall survive the satisfaction and discharge of the indenture. In addition, in connection with the closing of the Asset Sale Transaction, we terminated our senior secured credit facility entered into in May 2015 (and subsequently amended in May 2017), or the May 2017 Credit Facility.
Our wholly-owned subsidiaries, Triangle Mezzanine Fund LLLP, or Triangle SBIC, Triangle Mezzanine Fund II LP, or Triangle SBIC II, and Triangle Mezzanine Fund III LP, or Triangle SBIC III, are specialty finance limited partnerships that were formed to make investments primarily in lower middle-market companies located throughout the United States. Each of Triangle SBIC, Triangle SBIC II and Triangle SBIC III held licenses to operate as Small Business Investment Companies, or SBICs, under the authority of the United States Small Business Administration, or SBA. In connection with the closing of the Asset Sale Transaction, we repaid all of our outstanding SBA-guaranteed debentures and delivered necessary materials to the SBA to surrender the SBIC licenses held by Triangle SBIC, Triangle SBIC II, and Triangle SBIC III.
The Externalization Transaction closed on August 2, 2018. Effective as of the Externalization Closing, we changed our name from Triangle Capital Corporation to Barings BDC, Inc. and on August 3, 2018 began trading on the New York Stock Exchange, or NYSE, under the symbol "BBDC."
In connection with the closing of the Externalization Transaction, we entered into an investment advisory agreement, or the Advisory Agreement, and an administration agreement, or the Administration Agreement, with Barings, pursuant to which Barings serves as our investment adviser and administrator and manages our investment portfolio which initially consisted primarily of the cash proceeds received in connection with the Asset Sale Transaction. On August 2, 2018, we issued 8,529,917 shares of our common stock to Barings at a price of $11.723443 per share, or an aggregate of $100.0 million in cash.
Furthermore, on August 7, 2018, we launched a $50.0 million issuer tender offer, or the Tender Offer. Pursuant to the Tender Offer, we purchased 4,901,961 shares of our common stock at a purchase price of $10.20 per share, for an aggregate cost of approximately $50.0 million, excluding fees and expenses relating to the Tender Offer. The shares of common stock purchased in the Tender Offer represented approximately 8.7% of the our issued and outstanding shares as of September 6, 2018.
On September 24, 2018, or the Effective Date, Barings entered into a Rule 10b5-1 Purchase Plan, or the 10b5-1 Plan, that qualifies for the safe harbors provided by Rules 10b5-1 and 10b-18 under the Exchange Act. Pursuant to the 10b5-1 Plan, an independent broker made purchases of shares of our common stock on the open market on behalf of Barings in accordance with purchase guidelines specified in the 10b5-1 Plan. The 10b5-1 Plan was established in accordance with Barings obligation under the Externalization Agreement to enter into a trading plan pursuant to which Barings committed to purchase $50.0 million in value of shares in open market transactions through an independent broker. The maximum aggregate purchase price of all shares purchased under the 10b5-1 Plan was $50.0 million. As of December 31, 2018, Barings had purchased 4,045,248 shares of our common stock pursuant to the 10b5-1 Plan and owned a total of 12,600,627 shares of our common stock, or 24.6% of the total shares outstanding. On February 11, 2019, Barings fulfilled its obligations under the 10b5-1 Plan to purchase an aggregate amount of $50.0 million in shares of our common stock and the 10b5-1 Plan terminated in accordance with its terms. Upon completion of the 10b5-1 Plan, Barings had purchased 5,084,302 shares of our common stock pursuant to the 10b5-1 Plan and owned a total of 13,639,681 shares of our common stock, or 26.6% of the total shares outstanding.
As previously disclosed in our definitive proxy statement relating to the Transactions, filed with the SEC on June 1, 2018, and any supplements thereto, collectively referred to as the 2018 Special Meeting Proxy Statement, all of the existing officers and directors resigned effective as of the closing of the Externalization Transaction. In addition, our Board of Directors, or the Board approved the election of, effective from and after the closing of the Externalization Transaction, directors identified by Barings and the appointment of each such director to a director class selected by Barings, as disclosed in the 2018 Special Meeting Proxy Statement. The Board has also appointed new officers of the Company as identified by Barings, effective from and after the closing of the Externalization Transaction. Refer to the 2018 Special Meeting Proxy Statement for more information.
68
Overview of Our Business
We are a Maryland corporation incorporated on October 10, 2006. From 2007 through the date of the Externalization Transaction, we were internally managed by our executive officers under the supervision of the Board. During this period, we did not pay management or advisory fees, but instead incurred the operating costs associated with employing executive management and investment and portfolio management professionals. On August 2, 2018, we entered into the Advisory Agreement and became an externally-managed BDC managed by Barings. An externally-managed BDC generally does not have any employees, and its investment and management functions are provided by an outside investment adviser and administrator under an advisory agreement and administration agreement. Instead of directly compensating employees, we pay Barings for investment and management services pursuant to the terms of the Advisory Agreement and the Administration Agreement. Under the terms of the Advisory Agreement, the fees paid to Barings for managing our affairs will be determined based upon an objective and fixed formula, as compared with the subjective and variable nature of the costs associated with employing management and employees in an internally-managed BDC structure, which include bonuses that cannot be directly tied to Company performance because of restrictions on incentive compensation under the 1940 Act.
Prior to the Transactions, our business was to provide capital to lower middle-market companies located primarily in the United States. We focused on investments in companies with a history of generating revenues and positive cash flows, an established market position and a proven management team with a strong operating discipline. Our target portfolio company had annual revenues between $20.0 million and $300.0 million and annual earnings before interest, taxes, depreciation and amortization, as adjusted, or Adjusted EBITDA, between $5.0 million and $75.0 million. We invested primarily in senior and subordinated debt securities of privately held companies, generally secured by security interests in portfolio company assets. In addition, we generally invested in one or more equity instruments of the borrower, such as direct preferred or common equity interests. Our investments generally ranged from $5.0 million to $50.0 million per portfolio company.
Beginning August 2, 2018, Barings shifted our investment focus to invest in syndicated senior secured loans, bonds and other fixed income securities. Over time, Barings expects to transition our portfolio to senior secured private debt investments in performing, well-established middle-market businesses that operate across a wide range of industries. Barings’ existing SEC exemptive relief under Sections 17(d) and 57(i) of the 1940 Act and Rule 17d-1 thereunder, granted on October 19, 2017, or the Exemptive Relief, permits us and Barings’ affiliated private funds and SEC-registered funds to co-invest in Barings-originated loans, which allows Barings to implement its senior secured private debt investment strategy for us on an accelerated timeline.
Barings employs fundamental credit analysis, and targets investments in businesses with relatively low levels of cyclicality and operating risk. The holding size of each position will generally be dependent upon a number of factors including total facility size, pricing and structure, and the number of other lenders in the facility. Barings has experienced managing levered vehicles, both public and private, and will seek to enhance our returns through the use of leverage with a prudent approach that prioritizes capital preservation. Barings believes this strategy and approach offers attractive risk/return with lower volatility given the potential for fewer defaults and greater resilience through market cycles.
We generate revenues in the form of interest income, primarily from our investments in debt securities, loan origination and other fees and dividend income. Fees generated in connection with our debt investments are recognized over the life of the loan using the effective interest method or, in some cases, recognized as earned. Our syndicated senior secured loans generally bear interest between LIBOR plus 300 basis points and LIBOR plus 400 points. As we transition to senior secured private debt investments, such investments will generally have terms of between five and seven years. Our senior secured private debt investments generally will bear interest between LIBOR plus 450 basis points and LIBOR plus 650 basis points per annum. From time to time, certain of our investments may have a form of interest, referred to as payment-in-kind, or PIK, interest, which is not paid currently but is instead accrued and added to the loan balance and paid at the end of the term.
As of December 31, 2018, the weighted average yield on our syndicated senior secured loan portfolio and our middle-market private debt portfolio was approximately 5.8% and 7.6%, respectively. As of December 31, 2018, the
69
weighted average yield on these two portfolios on a combined basis was approximately 6.2%. The weighted-average yield on all of our outstanding investments (including equity and equity-linked investments and short-term investments) was approximately 6.0% as of December 31, 2018.
As of December 31, 2017, the weighted average yield on our outstanding debt investments other than non-accrual debt investments was approximately 11.0%. The weighted average yield on all of our outstanding investments (including equity and equity-linked investments but excluding non-accrual debt investments) was approximately 9.6% as of December 31, 2017. The weighted average yield on all of our outstanding investments (including equity and equity-linked investments and non-accrual debt investments) was approximately 8.5% as of December 31, 2017.
The weighted average yields across our investment portfolio depend on the relative seniority of our investments within the capital structures of our portfolio companies and on our security interests in portfolio company assets. Historically, prior to the Transactions, from the time of our initial public offering, or IPO, in 2007, we primarily focused on investments in subordinated debt securities, which generally produce higher yields than more senior securities due to the risks inherent in investing in less senior positions. Beginning in 2016, we began to shift our focus toward larger and less cyclical portfolio companies and began steering our portfolio composition with a focus on a balance between senior and subordinated securities. Subsequent to the Transactions, Barings shifted our investment focus to invest in syndicated senior secured loans, bonds and other fixed income securities. Over time, Barings expects to transition our portfolio to senior secured private debt investments in performing, well-established middle-market businesses that operate across a wide range of industries. This shift toward predominately senior securities is intended to reduce our credit risks in exchange for lower-yielding investments, which in turn has resulted in a decrease in the weighted average yield on our investment portfolio.
Portfolio Composition
The total value of our investment portfolio was $1,121.9 million as of December 31, 2018, as compared to $1,016.3 million as of December 31, 2017. As of December 31, 2018, we had investments in 139 portfolio companies and one money market fund with an aggregate cost of $1,173.9 million. As of December 31, 2017, we had investments in 89 portfolio companies with an aggregate cost of $1,121.6 million. As of both December 31, 2018 and 2017, none of our portfolio investments represented greater than 10% of the total fair value of our investment portfolio.
As of December 31, 2018 and December 31, 2017, our investment portfolio consisted of the following investments:
Cost |
Percentage of
Total Portfolio
|
Fair Value |
Percentage of
Total Portfolio
|
|||||||||||
December 31, 2018: |
||||||||||||||
Senior debt and 1st lien notes
|
$ |
1,120,401,043 |
95 |
% |
$ |
1,068,436,847 |
95 |
% |
||||||
Subordinated debt and 2nd lien notes
|
7,777,847 |
1 |
7,679,132 |
1 |
||||||||||
Equity shares |
515,825 |
— |
515,825 |
— |
||||||||||
Short-term investments |
45,223,941 |
4 |
45,223,941 |
4 |
||||||||||
$ |
1,173,918,656 |
100 |
% |
$ |
1,121,855,745 |
100 |
% |
|||||||
December 31, 2017: |
||||||||||||||
Senior debt and 1st lien notes
|
$ |
275,088,787 |
25 |
% |
$ |
262,803,297 |
26 |
% |
||||||
Subordinated debt and 2nd lien notes
|
710,543,854 |
63 |
589,548,358 |
58 |
||||||||||
Equity shares |
134,301,587 |
12 |
162,543,691 |
16 |
||||||||||
Equity warrants |
1,691,617 |
— |
1,389,000 |
— |
||||||||||
$ |
1,121,625,845 |
100 |
% |
$ |
1,016,284,346 |
100 |
% |
|||||||
70
Investment Activity
During the year ended December 31, 2018, subsequent to the Transactions, we purchased $1,314.6 million in syndicated senior secured loans and made new investments in nineteen middle-market portfolio companies totaling $237.2 million, consisting of 17 senior secured private debt investments, two second lien private debt investments and two minority equity instruments. In addition, we invested $45.2 million, net, in money market fund investments during the year ended December 31, 2018, subsequent to the Transactions.
In addition, during the year ended December 31, 2018, subsequent to the Transactions, we received $14.2 million of principal payments and sold $405.2 million of syndicated senior secured loans, recognizing a net loss on the sales of $0.1 million. As previously disclosed, as part of the Asset Sale Transaction we received gross cash proceeds from the Asset Buyer and certain affiliates of the Asset Buyer of approximately $793.3 million, after adjustments to take into account portfolio activity and other matters occurring since December 31, 2017, as described in greater detail in the Asset Purchase Agreement. We recognized a net realized loss on the Asset Sale Transaction of approximately $115.9 million and a net realized loss on the repayments and sales that occurred between December 31, 2017 and the closing of the Asset Sale Transaction of approximately $43.8 million.
During the year ended December 31, 2017, we made twenty-nine new investments, including recapitalizations of existing portfolio companies, totaling $408.9 million, additional debt investments in eighteen existing portfolio companies totaling $70.4 million and additional equity investments in eleven existing portfolio companies totaling $4.4 million. We had twenty-one portfolio company loans repaid at par totaling $332.5 million and received normal principal repayments, partial loan prepayments and PIK interest repayments totaling $54.5 million. We recognized $25.6 million of realized losses related to two portfolio company restructurings. We wrote off equity investments in eight portfolio companies and recognized realized losses on the write-offs of $15.1 million and wrote off or sold debt investments in six portfolio companies and recognized realized losses of $31.6 million. In addition, we received proceeds related to the sales of certain equity securities totaling $29.6 million and recognized net realized gains on such sales totaling $20.9 million in the year ended December 31, 2017.
Total portfolio investment activity for the years ended December 31, 2018 and 2017 was as follows:
December 31, 2018 |
Senior Debt
and 1st Lien
Notes
|
Subordinated
Debt and 2nd
Lien Notes
|
Equity
Shares
|
Equity
Warrants
|
Short-term Investments |
Total |
|||||||||||||||||
Fair value, beginning of period |
$ |
262,803,297 |
$ |
589,548,358 |
$ |
162,543,691 |
$ |
1,389,000 |
$ |
— |
$ |
1,016,284,346 |
|||||||||||
New investments |
1,563,590,508 |
15,793,789 |
3,086,424 |
— |
1,363,333,538 |
2,945,804,259 |
|||||||||||||||||
Investment reclass |
8,617,000 |
(8,617,000 |
) |
— |
— |
— |
— |
||||||||||||||||
Proceeds from sales of investments |
(405,187,718 |
) |
— |
(36,265,416 |
) |
(708 |
) |
(1,318,109,597 |
) |
(1,759,563,439 |
) |
||||||||||||
Proceeds from sales of investments to BSP |
(234,603,624 |
) |
(418,521,991 |
) |
(132,723,128 |
) |
(1,202,274 |
) |
— |
(787,051,017 |
) |
||||||||||||
Loan origination fees received |
(3,937,106 |
) |
(168,690 |
) |
— |
— |
— |
(4,105,796 |
) |
||||||||||||||
Principal repayments received |
(43,281,056 |
) |
(143,419,588 |
) |
— |
— |
— |
(186,700,644 |
) |
||||||||||||||
PIK interest earned |
259,414 |
3,517,139 |
— |
— |
— |
3,776,553 |
|||||||||||||||||
PIK interest payments received |
(1,403,097 |
) |
(2,494,389 |
) |
— |
— |
— |
(3,897,486 |
) |
||||||||||||||
Accretion of loan discounts |
183,527 |
14,188 |
— |
— |
— |
197,715 |
|||||||||||||||||
Accretion of deferred loan origination revenue |
609,362 |
2,697,059 |
— |
— |
— |
3,306,421 |
|||||||||||||||||
Realized gain (loss) |
(43,212,056 |
) |
(147,889,422 |
) |
32,116,354 |
(488,635 |
) |
— |
(159,473,759 |
) |
|||||||||||||
Unrealized appreciation (depreciation) |
(36,001,604 |
) |
117,219,679 |
(28,242,100 |
) |
302,617 |
— |
53,278,592 |
|||||||||||||||
Fair value, end of period |
$ |
1,068,436,847 |
$ |
7,679,132 |
$ |
515,825 |
$ |
— |
$ |
45,223,941 |
$ |
1,121,855,745 |
|||||||||||
71
December 31, 2017 |
Senior Debt
and 1st Lien
Notes
|
Subordinated
Debt and 2nd
Lien Notes
|
Equity
Shares
|
Equity
Warrants
|
Total |
||||||||||||||
Fair value, beginning of period |
$ |
191,643,157 |
$ |
690,159,367 |
$ |
154,216,657 |
$ |
1,888,000 |
$ |
1,037,907,181 |
|||||||||
New investments |
205,493,670 |
262,333,868 |
15,915,860 |
— |
483,743,398 |
||||||||||||||
Investment reclass |
(42,014,656 |
) |
33,614,656 |
8,400,000 |
— |
— |
|||||||||||||
Proceeds from sales of investments |
— |
— |
(29,065,946 |
) |
(550,863 |
) |
(29,616,809 |
) |
|||||||||||
Loan origination fees received |
(2,938,834 |
) |
(4,355,181 |
) |
— |
— |
(7,294,015 |
) |
|||||||||||
Principal repayments received |
(71,949,131 |
) |
(302,112,732 |
) |
— |
— |
(374,061,863 |
) |
|||||||||||
PIK interest earned |
1,001,142 |
9,916,389 |
— |
— |
10,917,531 |
||||||||||||||
PIK interest payments received |
(507,979 |
) |
(12,431,539 |
) |
— |
— |
(12,939,518 |
) |
|||||||||||
Accretion of loan discounts |
57,778 |
419,114 |
— |
— |
476,892 |
||||||||||||||
Accretion of deferred loan origination revenue |
1,490,694 |
4,846,747 |
— |
— |
6,337,441 |
||||||||||||||
Realized gain (loss) |
(14,160,007 |
) |
(35,323,325 |
) |
(1,473,134 |
) |
(1,912,237 |
) |
(52,868,703 |
) |
|||||||||
Unrealized appreciation (depreciation) |
(5,312,537 |
) |
(57,519,006 |
) |
14,550,254 |
1,964,100 |
(46,317,189 |
) |
|||||||||||
Fair value, end of period |
$ |
262,803,297 |
$ |
589,548,358 |
$ |
162,543,691 |
$ |
1,389,000 |
$ |
1,016,284,346 |
|||||||||
Non-Accrual Assets
Generally, when interest and/or principal payments on a loan become past due, or if we otherwise do not expect the borrower to be able to service its debt and other obligations, we will place the loan on non-accrual status and will generally cease recognizing interest income on that loan for financial reporting purposes until all principal and interest have been brought current through payment or due to a restructuring such that the interest income is deemed to be collectible. As of December 31, 2018, we had no non-accrual assets. As of December 31, 2017, the fair value of our non-accrual assets was $15.8 million, which comprised 1.6% of the total fair value of our portfolio, and the cost of our non-accrual assets was $120.1 million, which comprised 10.7% of the total cost of our portfolio.
Results of Operations
Comparison of years ended December 31, 2018, 2017 and 2016
Operating results for the years ended December 31, 2018, 2017 and 2016 were as follows:
Year Ended December 31, |
||||||||||||
2018 |
2017 |
2016 |
||||||||||
Total investment income |
$ |
80,223,625 |
$ |
123,004,632 |
$ |
113,679,557 |
||||||
Net operating expenses |
80,284,347 |
50,766,815 |
54,802,684 |
|||||||||
Net investment income (loss) |
(60,722 |
) |
72,237,817 |
58,876,873 |
||||||||
Net realized gains (losses) |
(158,392,548 |
) |
(51,599,927 |
) |
1,985,048 |
|||||||
Net unrealized appreciation (depreciation) |
53,746,145 |
(48,416,941 |
) |
(26,170,244 |
) |
|||||||
Loss on extinguishment of debt |
(10,507,183 |
) |
— |
— |
||||||||
Benefit from (provision for) taxes |
932,172 |
(871,410 |
) |
(435,245 |
) |
|||||||
Net increase (decrease) in net assets resulting from operations |
$ |
(114,282,136 |
) |
$ |
(28,650,461 |
) |
$ |
34,256,432 |
||||
Net increases or decreases in net assets resulting from operations vary substantially from period to period due to various factors. The net decrease in net assets resulting from operations for the year ended December 31, 2018 was primarily due to the net realized loss related to the Asset Sale Transaction and certain one-time compensation expenses and direct costs related to the Transactions. See further discussion regarding the Transactions above in "The Asset Sale and Externalization Transactions" section. As a result, yearly comparisons of net increases or decreases in net assets resulting from operations may not be meaningful.
72
Investment Income
Year Ended December 31, |
||||||||||||
2018 |
2017 |
2016 |
||||||||||
Total interest income |
$ |
68,398,617 |
$ |
98,039,869 |
$ |
87,390,603 |
||||||
Total dividend income |
894,556 |
2,684,188 |
2,320,557 |
|||||||||
Total fee and other income |
5,168,901 |
10,648,016 |
8,385,865 |
|||||||||
Total payment-in-kind interest income |
3,776,554 |
10,917,531 |
15,234,419 |
|||||||||
Interest income from cash and cash equivalents |
1,984,997 |
715,028 |
348,113 |
|||||||||
Total investment income |
$ |
80,223,625 |
$ |
123,004,632 |
$ |
113,679,557 |
||||||
The decrease in interest income (including PIK interest income) for the year ended December 31, 2018, was primarily attributable to the Asset Sale Transaction and the shift in the composition of our investment portfolio. Subsequent to the Externalization Transaction, our investment portfolio has been primarily comprised of syndicated senior secured loans and senior secured private debt investments which are lower yielding debt investments as compared to our investment portfolio as of December 31, 2017. The weighted average yield on our debt investments was 6.2% (exclusive of short-term investments) as of December 31, 2018 as compared to 11.0% (exclusive of non-accrual investments) as of December 31, 2017. In addition, total investment income for the year ended December 31, 2018 was negatively impacted by a $3.9 million decrease in non-recurring fee income and an $1.8 million decrease in non-recurring dividend income. Non-recurring fee income was $3.4 million for the year ended December 31, 2018, as compared to $7.3 million for the year ended December 31, 2017, and non-recurring dividend income was $0.9 million for the year ended December 31, 2018, as compared to $2.7 million for the year ended December 31, 2017. Partially offsetting these decreases was an increase in interest income on cash and cash equivalents of $1.3 million in the year ended December 31, 2018.
The increase in total investment income for the year ended December 31, 2017, as compared to investment income for the year ended December 31, 2016, was primarily attributed to an increase in portfolio debt investments from December 31, 2016 to December 31, 2017, a $2.1 million increase in non-recurring fee income and a $0.7 million increase in non-recurring dividend income, partially offset by a decrease in PIK interest income due to a decrease in PIK yielding investments from December 31, 2016 to December 31, 2017 and a $7.6 million decrease in investment income relating to non-accrual assets. Non-recurring fee income was $7.3 million for the year ended December 31, 2017, as compared to $5.2 million for the year ended December 31, 2016, and non-recurring dividend income was $2.7 million for the year ended December 31, 2017, as compared to $2.0 million for the year ended December 31, 2016. Our non-recurring dividend income during the year ended December 31, 2016 consisted of non-recurring dividend income of approximately $3.3 million and a negative true-up adjustment of $1.3 million related to a portfolio company distribution that was received in 2015. In 2015, we received information that indicated that the tax character of the distribution was 100% dividend income, but received updated information in 2016 indicating that only 14% of the distribution was dividend income and the remainder was a return of capital, which necessitated the adjustment.
Operating Expenses
Year Ended December 31, |
||||||||||||
2018 |
2017 |
2016 |
||||||||||
Interest and other financing fees |
$ |
23,887,331 |
$ |
29,261,030 |
$ |
26,720,572 |
||||||
Base Management Fee |
4,218,628 |
— |
— |
|||||||||
Compensation expenses |
37,487,461 |
16,135,739 |
23,675,809 |
|||||||||
General and administrative expenses |
16,177,534 |
5,370,046 |
4,406,303 |
|||||||||
Total operating expenses |
81,770,954 |
50,766,815 |
54,802,684 |
|||||||||
Base management fee waived |
(1,486,607 |
) |
— |
— |
||||||||
Net operating expenses |
$ |
80,284,347 |
$ |
50,766,815 |
$ |
54,802,684 |
||||||
Interest and Other Financing Fees
The decrease in interest and other financing fees expense from the year ended December 31, 2017 to the year ended December 31, 2018 was primarily attributable to the repayment of our SBA-guaranteed debentures, the repayment of our May 2017 Credit Facility and the redemption of both the March 2022 Notes and the December
73
2022 Notes, partially offset by interest and fees incurred related to borrowings under our credit facility entered into in August 2018 with Bank of America, N.A. (as amended and restated in December 2018), or the August 2018 Credit Facility.
The increase in interest and other financing fees expense from the year ended December 31, 2016 to the year ended December 31, 2017 was related primarily to an increase of $2.0 million related to increased borrowings under the May 2017 Credit Facility and to interest and fee amortization of $0.5 million on incremental borrowings of $25.0 million under our SBA-guaranteed debentures.
Base Management Fees
Under the Advisory Agreement, we pay Barings a base management fee, or the Base Management Fee, quarterly in arrears on a calendar quarter basis. The Base Management Fee is calculated based on the average value of our gross assets, excluding cash and cash equivalents, at the end of the two most recently completed calendar quarters prior to the quarter for which such fees are being calculated. Base Management Fees for any partial month or quarter are appropriately pro-rated. Prior to the Externalization Transaction we were an internally-managed BDC and did not pay any base management fees. See Note 2 to our consolidated financial statements for the year ended December 31, 2018 for additional information regarding the Advisory Agreement.
For the year ended December 31, 2018, the Base Management Fee determined in accordance with the terms of the Advisory Agreement was approximately $4.2 million. For the quarter ended September 30, 2018, the calculation of the Base Management Fee under the terms of the Advisory Agreement was based on the average of our gross assets, excluding cash and cash equivalents, as of March 31, 2018 and June 30, 2018, both of which were dates prior to the consummation of the Transactions. For the quarter ended December 31, 2018, the calculation of the Base Management Fee under the terms of the Advisory Agreement was based on the average of our gross assets, excluding cash and cash equivalents, as of June 30, 2018, which was prior to the Transactions, and September 30, 2018. In light of this fact, and in order to ensure that Barings did not earn a Management Fee on assets that it did not manage prior to the Transactions, Barings calculated the Base Management Fee for the quarter ended September 30, 2018 based on our average gross assets as of August 2, 2018 and September 30, 2018, excluding (i) cash and cash equivalents, (ii) short-term investments, (iii) unsettled purchased investments and (iv) assets subject to participation agreements (the “Q3 2018 Adjusted Management Fee”). For the quarter ended December 31, 2018, Barings calculated the Base Management Fee based on our average gross assets as of September 30, 2018 and December 31, 2018, excluding (i) cash and cash equivalents, (ii) short-term investments, (iii) unsettled purchased investments and (iv) assets subject to participation agreements (the “Q4 2018 Adjusted Management Fee,” and together with the Q3 2018 Adjusted Management Fee,” the “FY 2018 Adjusted Management Fee”). Barings voluntary agreed to waive the difference between the $4.2 million Base Management Fee calculated under the terms of the Advisory Agreement and the FY 2018 Adjusted Management Fee, which resulted in a net Base Management Fee of approximately $2.7 million for the year ended December 31, 2018 after taking into account a waiver of approximately $1.5 million based on the calculations noted above. We expect Barings to begin calculating the Management Fee in accordance with the terms of the Advisory Agreement, and without any additional waiver, starting with the quarter ending March 31, 2019.
Compensation Expenses
Prior to the Transactions, compensation expenses were primarily influenced by headcount and levels of business activity. Our compensation expenses included salaries, discretionary compensation, equity-based compensation and benefits. Discretionary compensation was significantly impacted by our level of total investment income, our investment results, including investment realizations, prevailing labor markets and the external environment.
The increase in compensation expenses for the year ended December 31, 2018 related predominantly to the Transactions, and the subsequent change of control and related termination of our employees. In the year ended December 31, 2018, we recognized approximately $27.6 million in one-time compensation expenses associated with the Transactions which included severance expenses, pro-rata incentive compensation, transaction-related bonuses, expenses related to the acceleration of vesting of restricted stock grants and deferred compensation grants, and other expenses associated with the obligations under our existing severance agreements and severance policy.
74
Compensation expenses for the year ended December 31, 2017 decreased as compared to compensation expenses for the year ended December 31, 2016, primarily due to one-time expenses associated with the retirement of our former Chief Executive Officer, Garland S. Tucker, III, from his officer positions in February 2016 and the resignation of Brent P.W. Burgess as the Company's Chief Investment Officer in October 2016. The Board awarded Mr. Tucker a $2.5 million cash bonus and accelerated the vesting of his outstanding shares of restricted stock, including 47,000 shares of restricted stock awarded to him in February 2016 based on his performance during 2015, and certain other compensation in connection with his retirement and in recognition of his long service. We recognized $5.5 million in one-time compensation expenses for the year ended December 31, 2016 associated with Mr. Tucker's retirement. In connection with Mr. Burgess’s resignation, we entered into an agreement with Mr. Burgess, pursuant to which he received his unpaid salary and accrued but unused vacation leave through October 14, 2016, cash payments totaling $250,000, accelerated vesting of the 93,284 shares of the Company’s restricted stock held by him and certain other benefits. We recognized $1.5 million in one-time compensation expenses for the year ended December 31, 2016 in connection with Mr. Burgess' resignation. In addition, compensation expenses decreased by $0.6 million for the year ended December 31, 2017 related to decreased discretionary compensation expenses.
General and Administrative Expenses
General and administrative expenses increased for the year ended December 31, 2018 as compared to the year ended December 31, 2017 primarily as a result of transaction advisory fees, increased legal expenses and other direct costs associated with the Transactions. These direct costs related to the Transactions totaled approximately $11.8 million for year ended December 31, 2018. See further discussion regarding the Transactions above under "The Asset Sale and Externalization Transactions."
On August 2, 2018, we entered into the Administration Agreement with Barings. Under the terms of the Administration Agreement, Barings performs (or oversees, or arranges for, the performance of) certain administrative services necessary for our operations. We are required to reimburse Barings for the costs and expenses incurred by Barings in performing its obligations and providing personnel and facilities under the Administration Agreement, or such lesser amount as may be agreed to in writing by us and Barings from time to time. If we and Barings agree to a reimbursement amount for any period which is less than the full amount otherwise permitted under the Administration Agreement, then Barings will not be entitled to recoup any difference thereof in any subsequent period or otherwise. During the year ended December 31, 2018, we incurred and were invoiced by Barings for expenses of approximately $0.5 million under the terms of the Administration Agreement. See Note 2 to our consolidated financial statements for the year ended December 31, 2018 for additional information regarding the Administration Agreement.
The increase in general and administrative expenses for the year ended December 31, 2017 as compared to the year ended December 31, 2016 was primarily due to increased legal and other professional fees incurred in connection with previously disclosed litigation and the strategic alternatives review process undertaken in connection with the Transactions. See Item 3 of Part I of this Annual Report entitled “Legal Proceedings” for additional information.
Net Realized Gains (Losses)
Net realized gains (losses) during the years ended December 31, 2018, 2017 and 2016 were as follows:
Year Ended December 31, |
||||||||||||
2018 |
2017 |
2016 |
||||||||||
Non-Control / Non-Affiliate investments |
$ |
(130,870,385 |
) |
$ |
(3,683,168 |
) |
$ |
(2,413,750 |
) |
|||
Affiliate investments |
9,939,330 |
(3,979,667 |
) |
4,398,798 |
||||||||
Control investments |
(38,542,704 |
) |
(45,205,868 |
) |
— |
|||||||
Net realized gains (losses) on investments |
(159,473,759 |
) |
(52,868,703 |
) |
1,985,048 |
|||||||
Foreign currency borrowings |
1,081,211 |
1,268,776 |
— |
|||||||||
Net realized gains (losses) |
$ |
(158,392,548 |
) |
$ |
(51,599,927 |
) |
$ |
1,985,048 |
||||
75
For the year ended December 31, 2018, we recognized net realized losses totaling $158.4 million, which consisted primarily of a net loss on the Asset Sale Transaction of approximately $115.9 million, a net loss on the repayments, sales and write-offs that occurred between December 31, 2017 and the closing of the Asset Sale Transaction of approximately $43.8 million and net losses on the syndicated senior secured loan portfolio of $0.1 million. These net losses were partially offset by gains on escrows received of $0.3 million and a gain on foreign currency borrowings of $1.1 million.
For the year ended December 31, 2017, we recognized net realized losses totaling $51.6 million, which consisted primarily of net losses on the write-offs of three control investments totaling $19.9 million, a net loss on the restructuring of one control investment totaling $25.3 million, net losses on the write-off of two affiliate investments totaling $9.5 million and net losses on the restructurings/write-offs of five non-control/non-affiliate investments totaling $17.7 million, partially offset by net gains on the sales of sixteen non-control/non-affiliate investments totaling $14.0 million, net gains on the sales of six affiliate investments totaling $5.5 million and a gain on foreign currency borrowings of $1.3 million.
For the year ended December 31, 2016, we recognized net realized gains totaling $2.0 million, which consisted primarily of net gains on the sales/repayments of seventeen non-control/non-affiliate investments totaling $15.3 million and net gains on the sales/write-off of seven affiliate investments totaling $4.4 million, partially off-set by a loss on the restructuring of one non-control/non-affiliate investment totaling $1.6 million and a loss on the write-off of one non-control/non-affiliate investment totaling $16.1 million.
Net Unrealized Appreciation and Depreciation
Net unrealized appreciation and depreciation during the year ended December 31, 2018, 2017 and 2016 was as follows:
Year Ended December 31, |
||||||||||||
2018 |
2017 |
2016 |
||||||||||
Non-Control / Non-Affiliate investments |
$ |
27,025,025 |
$ |
(65,786,245 |
) |
$ |
(9,079,811 |
) |
||||
Affiliate investments |
3,197,568 |
(7,356,046 |
) |
(5,473,012 |
) |
|||||||
Control investments |
24,387,532 |
27,547,274 |
(11,464,464 |
) |
||||||||
Net unrealized appreciation (depreciation) on investments |
54,610,125 |
(45,595,017 |
) |
(26,017,287 |
) |
|||||||
Foreign currency borrowings |
(863,980 |
) |
(2,821,924 |
) |
(152,957 |
) |
||||||
Net unrealized appreciation (depreciation) |
$ |
53,746,145 |
$ |
(48,416,941 |
) |
$ |
(26,170,244 |
) |
||||
For the year ended December 31, 2018, we recorded net unrealized appreciation totaling $53.7 million consisting of net unrealized depreciation on our current portfolio of $52.1 million and net unrealized appreciation reclassification adjustments of $105.8 million related to realized gains and losses recognized during the period, including those attributable to the Asset Sale Transaction. For the year ended December 31, 2017, we recorded net unrealized depreciation totaling $48.4 million, consisting of net unrealized depreciation on our then-current portfolio of $102.8 million and net unrealized appreciation reclassification adjustments of $54.4 million related to realized gains and losses. In addition, for the year ended December 31, 2016, we recorded net unrealized depreciation totaling $26.2 million, consisting of net unrealized depreciation on our then-current portfolio of $26.8 million and net unrealized appreciation reclassification adjustments of $0.6 million related to realized gains and losses.
76
Supplemental Financial Information
We report our financial results in accordance with U.S. GAAP. On a supplemental basis, the information in the table below presents our results of operations for the year ended December 31, 2018 for (i) the period from January 1, 2018 through August 2, 2018, the date of the Externalization Transaction, and (ii) for the period from August 3, 2018 through December 31, 2018.
January 1, 2018 through August 2, 2018 |
August 3, 2018 through December 31, 2018 |
Year Ended Ended December 31, 2018(1) |
||||||||||
Investment income: |
||||||||||||
Interest income |
$ |
48,166,613 |
$ |
20,232,004 |
$ |
68,398,617 |
||||||
Dividend income |
693,779 |
200,777 |
894,556 |
|||||||||
Fee and other income |
4,926,632 |
242,269 |
5,168,901 |
|||||||||
Payment-in-kind interest income |
3,776,554 |
— |
3,776,554 |
|||||||||
Interest income from cash and cash equivalents |
1,650,663 |
334,334 |
1,984,997 |
|||||||||
Total investment income |
59,214,241 |
21,009,384 |
80,223,625 |
|||||||||
Operating expenses: |
||||||||||||
Interest and other financing fees |
19,144,380 |
4,742,951 |
23,887,331 |
|||||||||
Base management fee |
— |
4,218,628 |
4,218,628 |
|||||||||
Compensation expenses |
37,282,803 |
204,658 |
37,487,461 |
|||||||||
General and administrative expenses |
14,333,177 |
1,844,357 |
16,177,534 |
|||||||||
Total operating expenses |
70,760,360 |
11,010,594 |
81,770,954 |
|||||||||
Base management fee waived |
— |
(1,486,607 |
) |
(1,486,607 |
) |
|||||||
Net operating expenses |
70,760,360 |
9,523,987 |
80,284,347 |
|||||||||
Net investment income (loss) |
(11,546,119 |
) |
11,485,397 |
(60,722 |
) |
|||||||
Realized and unrealized gains (losses) on investments and foreign currency borrowings: |
||||||||||||
Net realized gains (losses)(2) |
(162,288,479 |
) |
3,895,931 |
(158,392,548 |
) |
|||||||
Net unrealized appreciation (depreciation)(3) |
109,442,320 |
(55,696,175 |
) |
53,746,145 |
||||||||
Net realized and unrealized losses |
(52,846,159 |
) |
(51,800,244 |
) |
(104,646,403 |
) |
||||||
Loss on extinguishment of debt |
(10,507,183 |
) |
— |
(10,507,183 |
) |
|||||||
Benefit from (provision for) taxes |
(612,990 |
) |
1,545,162 |
932,172 |
||||||||
Net decrease in net assets resulting from operations |
$ |
(75,512,451 |
) |
$ |
(38,769,685 |
) |
$ |
(114,282,136 |
) |
|||
Net investment income (loss) per share—basic and diluted |
$ |
(0.24 |
) |
$ |
0.22 |
$ |
— |
|||||
Net decrease in net assets resulting from operations per share—basic and diluted |
$ |
(1.57 |
) |
$ |
(0.74 |
) |
$ |
(2.29 |
) |
|||
Weighted average shares outstanding—basic and diluted |
$ |
47,979,262 |
$ |
52,615,060 |
$ |
49,897,085 |
||||||
(1) Amounts from our Consolidated Statement of Operations for the year ended December 31, 2018, representing the sums of the amounts for (i) the period from January 1, 2018 through August 2, 2018 and (ii) the period from August 3, 2018 through December 31, 2018, excluding per share amounts and weighted average shares outstanding.
(2) Net realized gains of $3.9 million for the period from August 3, 2018 through December 31, 2018 included a net realized gain on the Asset Sale of $3.6 million and a realized gain from escrow payments of $0.3 million, partially offset by a net realized loss on the sales of syndicated senior secured loans of $0.1 million.
(3) Net unrealized depreciation of $55.7 million for the period from August 3, 2018 through December 31, 2018 includes $52.1 million in net unrealized depreciation on our current portfolio and $3.6 million of net unrealized depreciation reclassification adjustments related to the net realized gain on the Asset Sale of $3.6 million discussed in footnote (2) above.
Liquidity and Capital Resources
We believe that our current cash and cash equivalents on hand, our short-term investments, sales of our syndicated senior secured loans, our available borrowing capacity under the August 2018 Credit Facility, our
77
available borrowing capacity under the 2019 Credit Facility (as defined and discussed below under "Recent Developments") and our anticipated cash flows from operations will be adequate to meet our cash needs for our daily operations for at least the next twelve months.
Cash Flows
For the year ended December 31, 2018, we experienced a net decrease in cash and cash equivalents in the amount of $179.4 million. During that period, our operating activities used $198.3 million in cash, consisting primarily of purchases of portfolio investments of $1,553.9 million, purchases of short-term investments of $1,363.3 million, partially offset by the sale of our investment portfolio to the Asset Buyer for $793.3 million, proceeds from sales of investments totaling $606.8 million and proceeds from the sales of short-term investments of $1,318.1 million. In addition, financing activities provided net cash of $18.8 million, consisting primarily of borrowings under the May 2017 Credit Facility and the August 2018 Credit Facility of $574.1 million and net proceeds from the issuance of common stock to Barings of $99.8 million, partially offset by repayment of SBA-guaranteed debentures of $250.0 million, redemption of the December 2022 Notes and March 2022 Notes for $166.8 million in aggregate, repayments under the May 2017 Credit Facility of $160.0 million, purchases of shares of our common stock in the Tender Offer and related expenses of $51.0 million and cash dividends and distributions paid in the amount of $21.1 million. At December 31, 2018, we had $12.4 million of cash and cash equivalents on hand.
For the year ended December 31, 2017, we experienced a net increase in cash and cash equivalents in the amount of $84.8 million. During that period, our operating activities provided $8.0 million in cash, consisting primarily of repayments received from portfolio companies and proceeds from the sales of investments totaling $403.7 million, which in addition to the cash provided by other operating activities, was partially offset by new portfolio investments of $483.7 million. In addition, financing activities provided cash of $76.8 million, consisting primarily of proceeds from the public stock offering of $132.0 million and net borrowings under the May 2017 Credit Facility of $27.5 million, partially offset by cash dividends paid in the amount of $77.1 million. At December 31, 2017, we had $191.8 million of cash and cash equivalents on hand.
For the year ended December 31, 2016, we experienced a net increase in cash and cash equivalents in the amount of $54.5 million. During that period, our operating activities used $23.1 million in cash, consisting primarily of new portfolio investments of $319.5 million, partially offset by repayments received from portfolio companies and proceeds from the sales of investments totaling $236.7 million. In addition, financing activities provided cash of $77.7 million, consisting primarily of proceeds from the public stock offering of $129.1 million and borrowings under SBA-guaranteed debentures of $32.8 million, partially offset by cash dividends paid in the amount of $66.5 million, the repayment of our SBA-guaranteed Low or Moderate Income debenture of $7.8 million and net repayments under the May 2017 Credit Facility (prior to amendment in May 2017) of $4.4 million. At December 31, 2016, we had $107.1 million of cash and cash equivalents on hand.
Financing Transactions
In connection with the Asset Sale Transaction, we repaid all of our outstanding SBA-guaranteed debentures and delivered necessary materials to the SBA to surrender the SBIC licenses held by Triangle SBIC, Triangle SBIC II, and Triangle SBIC III. Upon the repayment of the SBA-guaranteed debentures, we recognized a loss on the extinguishment of debt of $3.5 million. Also in connection with the closing of the Asset Sale Transaction, we terminated the May 2017 Credit Facility, which resulted in a loss on the extinguishment of debt of $4.1 million. See Note 5 to our consolidated financial statements for the year ended December 31, 2018 for additional information regarding our SBA-guaranteed debentures and the May 2017 Credit Facility.
In October 2012, we issued $70.0 million in aggregate principal amount of the December 2022 Notes, and in November 2012, we issued $10.5 million of the December 2022 Notes pursuant to the exercise of an over-allotment option. In connection with the closing of the Asset Sale Transaction, we caused notices to be issued to the holders of the December 2022 Notes regarding the redemption of the December 2022 Notes. The December 2022 Notes were redeemed in full on August 30, 2018 for a total redemption price of $80.5 million, which resulted in a loss on the extinguishment of debt of $1.4 million. Prior to the redemption, the December 2022 Notes bore interest at a rate of 6.375% per year payable quarterly on March 15, June 15, September 15 and December 15 of each year, beginning December 15, 2012.
78
In February 2015, we issued $86.3 million in aggregate principal amount of the March 2022 Notes. The net proceeds from the sale of the March 2022 Notes, after underwriting discounts and offering expenses, were $83.4 million. In connection with the closing of the Asset Sale Transaction, we also caused notices to be issued to the holders of the March 2022 Notes regarding the redemption of all the March 2022 Notes. The March 2022 Notes were redeemed in full on August 30, 2018 for a total redemption price of $86.3 million, which resulted in a loss on the extinguishment of debt of $1.5 million. Prior to the redemption, the March 2022 Notes bore interest at a rate of 6.375% per year payable quarterly on March 15, June 15, September 15 and December 15 of each year, beginning March 15, 2015. See Note 5 to our consolidated financial statements for the year ended December 31, 2018 for additional information regarding the December 2022 Notes and the March 2022 Notes.
On July 3, 2018, we formed Barings BDC Senior Funding I, LLC, an indirectly wholly-owned Delaware limited liability company, or BSF, the primary purpose of which is to function as our special purpose, bankruptcy-remote, financing subsidiary in connection with the August 2018 Credit Facility. On August 3, 2018, BSF entered into the August 2018 Credit Facility, as amended and restated from time to time, with Bank of America, N.A., as administrative agent, or the Administrative Agent and Class A-1 Lender, Société Générale, as Class A Lender, and Bank of America Merrill Lynch, as sole lead arranger and sole book manager. BSF and the Administrative Agent also entered into a security agreement dated as of August 3, 2018, or the Security Agreement pursuant to which BSF’s obligations under the August 2018 Credit Facility are secured by a first-priority security interest in substantially all of the assets of BSF, including its portfolio of investments, or the Pledged Property. In connection with the first-priority security interest established under the Security Agreement, all of the Pledged Property will be held in the custody of State Street Bank and Trust Company, as collateral administrator, or the Collateral Administrator. The Collateral Administrator will maintain and perform certain collateral administration services with respect to the Pledged Property pursuant to a collateral administration agreement among BSF, the Administrative Agent and the Collateral Administrator. Generally, the Collateral Administrator will only be authorized to make distributions and payments from Pledged Property based on the written instructions of the Administrative Agent.
The August 2018 Credit Facility provides for borrowings in an aggregate amount up to $750.0 million including up to $250 million borrowed under the Class A Loan Commitments and up to $500 million borrowed under the Class A-1 Loan Commitments. All borrowings under the August 2018 Credit Facility bear interest, subject to BSF’s election, on a per annum basis equal to (i) the applicable base rate plus the applicable spread or (ii) the applicable LIBOR rate plus the applicable spread. The applicable base rate is equal to the greater of (i) the federal funds rate plus 0.5%, (ii) the prime rate or (iii) one-month LIBOR plus 1.0%. The applicable LIBOR rate depends on the term of the borrowing under the August 2018 Credit Facility, which can be either one month or three months. As of December 31, 2018, the weighted average interest rate on the borrowings outstanding under the August 2018 Credit Facility was 3.654%. BSF is required to pay commitment fees on the unused portion of the August 2018 Credit Facility beginning the ninetieth day after the closing date. BSF may prepay any borrowing at any time without premium or penalty, except that BSF may be liable for certain funding breakage fees if prepayments occur prior to expiration of the relevant interest period. BSF may also permanently reduce all or a portion of the commitment amount under the August 2018 Credit Facility without penalty after the six-month anniversary of the closing date.
Any amounts borrowed under the Class A Loan Commitments will mature, and all accrued and unpaid interest thereunder will be due and payable, on August 3, 2019, or upon earlier termination of the August 2018 Credit Facility. Any amounts borrowed under the Class A-1 Loan Commitments will mature, and all accrued and unpaid interest thereunder will be due and payable, on August 3, 2020, or upon earlier termination of the August 2018 Credit Facility.
As of December 31, 2018, BSF was in compliance with all covenants under the August 2018 Credit Facility and had borrowings of $570.0 million outstanding under the August 2018 Credit Facility. The fair values of the borrowings outstanding under the August 2018 Credit Facility are based on a market yield approach and current interest rates, which are Level 3 inputs to the market yield model. As of December 31, 2018, the total fair value of the borrowings outstanding under the August 2018 Credit Facility was $570.0 million. See Note 5 to our consolidated financial statements for the year ended December 31, 2018 for additional information regarding the August 2018 Credit Facility.
79
Distributions to Stockholders
We have elected to be treated as a RIC under the Internal Revenue Code of 1986, as amended, or the Code, and intend to make the required distributions to our stockholders as specified therein. In order to maintain our tax treatment as a RIC and to obtain RIC tax benefits, we must meet certain minimum distribution, source-of-income and asset diversification requirements. If such requirements are met, then we are generally required to pay income taxes only on the portion of our taxable income and gains we do not distribute (actually or constructively) and certain built-in gains. We have historically met our minimum distribution requirements and continually monitor our distribution requirements with the goal of ensuring compliance with the Code. We can offer no assurance that we will achieve results that will permit the payment of any cash distributions and our ability to make distributions will be limited by the asset coverage requirement and related provisions under the 1940 Act and contained in any applicable indenture and related supplements.
The minimum distribution requirements applicable to RICs require us to distribute to our stockholders each year at least 90% of our investment company taxable income, or ICTI, as defined by the Code. Depending on the level of ICTI earned in a tax year, we may choose to carry forward ICTI in excess of current year distributions into the next tax year and pay a 4% U.S. federal excise tax on such excess. Any such carryover ICTI must be distributed before the end of the next tax year through a dividend declared prior to filing the final tax return related to the year which generated such ICTI.
ICTI generally differs from net investment income for financial reporting purposes due to temporary and permanent differences in the recognition of income and expenses. We may be required to recognize ICTI in certain circumstances in which we do not receive cash. For example, if we hold debt obligations that are treated under applicable tax rules as having original issue discount (such as debt instruments issued with warrants), we must include in ICTI each year a portion of the original issue discount that accrues over the life of the obligation, regardless of whether cash representing such income is received by us in the same taxable year. We may also have to include in ICTI other amounts that we have not yet received in cash, such as (i) PIK interest income and (ii) interest income from investments that have been classified as non-accrual for financial reporting purposes. Interest income on non-accrual investments is not recognized for financial reporting purposes, but generally is recognized in ICTI. Because any original issue discount or other amounts accrued will be included in our ICTI for the year of accrual, we may be required to make a distribution to our stockholders in order to satisfy the minimum distribution requirements, even though we will not have received and may not ever receive any corresponding cash amount. ICTI also excludes net unrealized appreciation or depreciation, as investment gains or losses are not included in taxable income until they are realized.
Critical Accounting Policies and Use of Estimates
The preparation of our financial statements in accordance with U.S. GAAP requires management to make certain estimates and assumptions that affect the reported amounts of assets and liabilities at the date of the financial statements and the reported amounts of revenues and expenses for the periods covered by such financial statements. We have identified investment valuation and revenue recognition as our most critical accounting estimates. On an on-going basis, we evaluate our estimates, including those related to the matters described below. These estimates are based on the information that is currently available to us and on various other assumptions that we believe to be reasonable under the circumstances. Actual results could differ materially from those estimates under different assumptions or conditions. A discussion of our critical accounting policies follows.
Investment Valuation
The most significant estimate inherent in the preparation of our financial statements is the valuation of investments and the related amounts of unrealized appreciation and depreciation of investments recorded. We have a valuation policy, as well as established and documented processes and methodologies for determining the fair values of portfolio company investments on a recurring (quarterly) basis in accordance with the 1940 Act and FASB ASC Topic 820, Fair Value Measurements and Disclosures, or ASC Topic 820. Our current valuation policy and processes were established by Barings and were approved by the Board.
80
Under ASC Topic 820, fair value is the price that would be received to sell an asset or paid to transfer a liability in an orderly transaction between a willing buyer and a willing seller at the measurement date. For our portfolio securities, fair value is generally the amount that we might reasonably expect to receive upon the current sale of the security. The fair value measurement assumes that the sale occurs in the principal market for the security, or in the absence of a principal market, in the most advantageous market for the security. If no market for the security exists or if we do not have access to the principal market, the security should be valued based on the sale occurring in a hypothetical market.
Under ASC Topic 820, there are three levels of valuation inputs, as follows:
Level 1 Inputs – include quoted prices (unadjusted) in active markets for identical assets or liabilities.
Level 2 Inputs – include quoted prices for similar assets and liabilities in active markets, and inputs that are observable for the asset or liability, either directly or indirectly, for substantially the full term of the financial instrument.
Level 3 Inputs – include inputs that are unobservable and significant to the fair value measurement.
A financial instrument is categorized within the ASC Topic 820 valuation hierarchy based upon the lowest level of input to the valuation process that is significant to the fair value measurement. For example, a Level 3 fair value measurement may include inputs that are observable (Levels 1 and 2) and unobservable (Level 3). Therefore, unrealized appreciation and depreciation related to such investments categorized as Level 3 investments within the tables below may include changes in fair value that are attributable to both observable inputs (Levels 1 and 2) and unobservable inputs (Level 3).
Our investment portfolio includes certain debt and equity instruments of privately held companies for which quoted prices or other inputs falling within the categories of Level 1 and Level 2 are generally not available. In such cases, we determine the fair value of our investments in good faith primarily using Level 3 inputs. In certain cases, quoted prices or other observable inputs exist, and if so, we assess the appropriateness of the use of these third-party quotes in determining fair value based on (i) our understanding of the level of actual transactions used by the broker to develop the quote and whether the quote was an indicative price or binding offer and (ii) the depth and consistency of broker quotes and the correlation of changes in broker quotes with underlying performance of the portfolio company.
There is no single standard for determining fair value in good faith, as fair value depends upon the specific circumstances of each individual investment. The recorded fair values of our Level 3 investments may differ significantly from fair values that would have been used had an active market for the securities existed. In addition, changes in the market environment and other events that may occur over the life of the investments may cause the gains or losses ultimately realized on these investments to be different than the valuations currently assigned.
Investment Valuation Process Prior to the Transactions
Prior to the Transactions, our valuation process was led by our executive officers. The valuation process began with a quarterly review of each investment in our investment portfolio by our executive officers and our investment committee. Valuations of each portfolio security were then prepared by our investment professionals, who had direct responsibility for the origination, management and monitoring of each investment. Each investment valuation was subject to (i) a review by the lead investment officer responsible for the portfolio company investment and (ii) a peer review by a second investment officer or executive officer. Generally, any investment that was valued below cost was subjected to review by one of our executive officers. After the peer review was complete, we engaged two independent valuation firms, collectively referred to as the Valuation Firms, to provide third-party reviews of certain investments, as described further below. Finally, the Board had the responsibility for reviewing and approving, in good faith, the fair value of our investments in accordance with the 1940 Act.
The Valuation Firms provided third-party valuation consulting services to us which consisted of certain limited procedures that we identified and requested the Valuation Firms to perform, which we refer to herein as the Procedures. The Procedures were performed with respect to each portfolio company at least once in every calendar year and for new portfolio companies, at least once in the twelve-month period subsequent to the initial investment.
81
In addition, the Procedures were generally performed with respect to a portfolio company when there was a significant change in the fair value of the investment. In certain instances, we determined that it was not cost-effective, and as a result was not in our stockholders’ best interest, to request the Valuation Firms to perform the Procedures on one or more portfolio companies. Such instances included, but were not limited to, situations where the fair value of the investment in the portfolio company was determined to be insignificant relative to the total investment portfolio.
The total number of investments and the percentage of our investment portfolio on which the Procedures were performed, prior to the Transactions, are summarized below by period:
For the quarter ended: |
Total
companies
|
Percent of total
investments at
fair value(1)
|
||
March 31, 2016 |
18 |
27% |
||
June 30, 2016 |
19 |
30% |
||
September 30, 2016 |
19 |
33% |
||
December 31, 2016 |
20 |
33% |
||
March 31, 2017 |
18 |
30% |
||
June 30, 2017 |
20 |
29% |
||
September 30, 2017 |
22 |
25% |
||
December 31, 2017 |
21 |
35% |
||
March 31, 2018 |
14 |
24% |
||
June 30, 2018 |
23 |
47% |
||
(1) |
Exclusive of the fair value of new investments made during the quarter. |
Prior to the Transactions, the securities in which we invested were generally only purchased and sold in merger and acquisition transactions, in which case the entire portfolio company was sold to a third-party purchaser. As a result, unless we had the ability to control such a transaction, the assumed principal market for our securities was a hypothetical secondary market. The Level 3 inputs to our valuation process reflect management’s best estimate of the assumptions that would be used by market participants in pricing the investment in a transaction in a hypothetical secondary market.
Investment Valuation Process Subsequent to the Transactions
Barings has established a Pricing Committee that is responsible for the approval, implementation and oversight of the processes and methodologies that relate to the pricing and valuation of assets we hold. Barings uses internal pricing models, in accordance with internal pricing procedures established by the Pricing Committee, to price an asset in the event an acceptable price cannot be obtained from an approved external source.
Barings reviews its valuation methodologies on an ongoing basis and updates are made accordingly to meet changes in the marketplace. Barings has established internal controls to ensure our validation process is operating in an effective manner. Barings (1) maintains valuation and pricing procedures that describe the specific methodology used for valuation and (2) approves and documents exceptions and overrides of valuations. In addition, the Pricing Committee performs an annual review of valuation methodologies.
Our money market fund investments are generally valued using Level 1 inputs and our syndicated senior secured loans are generally valued using Level 2 inputs. Our senior secured private middle-market debt investments will generally be valued using Level 3 inputs.
An independent valuation firm is engaged to perform the Procedures with respect to portfolio investments. The Procedures are generally performed with respect to each portfolio investment each quarter beginning in the quarter after the investment is made. In certain instances, we determine that it is not cost-effective, and as a result is not in our stockholders' best interest, to request independent valuation firms to perform the Procedures on certain portfolio investments. Such instances include, but are not limited to, situations where the fair value of the investment in the portfolio company is determined to be insignificant relative to the total investment portfolio.
82
We did not engage any independent valuation firms to perform the Procedures for the third quarter of 2018 as our investment portfolio consisted primarily of newly-originated investments. Beginning in the fourth quarter of 2018, we engaged an independent valuation firm to perform the Procedures noted above with respect to certain of our portfolio investments. For the quarter ended December 31, 2018, the independent valuation firm performed the Procedures on all five middle-market private debt investments that originated and settled during the third quarter of 2018. Finally, the Board has the responsibility for reviewing and approving, in good faith, the fair value of our investments in accordance with the 1940 Act.
Investment Valuation Inputs and Techniques
Currently, our valuation techniques are based upon both observable and unobservable pricing inputs. Observable inputs reflect market data obtained from independent sources, while unobservable inputs reflect our market assumptions. Our assessment of the significance of a particular input to the fair value measurement in its entirety requires judgment and considers factors specific to the financial instrument.
We determine the estimated fair value of our loans and investments using primarily an income approach. Generally, a vendor is the preferred source of pricing a loan, however, to the extent the vendor price is unavailable or not relevant and reliable, we may use broker quotes. We attempt to maximize the use of observable inputs and minimize the use of unobservable inputs. The availability of observable inputs can vary from investment to investment and is affected by a wide variety of factors, including the type of security, whether the security is new and not yet established in the marketplace, the liquidity of markets, and other characteristics particular to the security.
Enterprise Value Waterfall Approach
In valuing equity securities, we estimate fair value using an "Enterprise Value Waterfall" valuation model. We estimate the enterprise value of a portfolio company and then allocate the enterprise value to the portfolio company’s securities in order of their relative liquidation preference. In addition, the model assumes that any outstanding debt or other securities that are senior to our equity securities are required to be repaid at par. Generally, the waterfall proceeds flow from senior debt tranches of the capital structure to junior and subordinated debt, followed by each class or preferred stock and finally the common stock. Additionally, we may estimate the fair value of a debt security using the Enterprise Value Waterfall approach when we do not expect to receive full repayment.
To estimate the enterprise value of the portfolio company, we primarily use a valuation model based on a transaction multiple, which generally is the original transaction multiple, and measures of the portfolio company’s financial performance. In addition, we consider other factors, including but not limited to (i) offers from third parties to purchase the portfolio company, (ii) the implied value of recent investments in the equity securities of the portfolio company, (iii) publicly available information regarding recent sales of private companies in comparable transactions and (iv) when management believes there are comparable companies that are publicly traded, we perform a review of these publicly traded companies and the market multiple of their equity securities. For certain non-performing assets, we may utilize the liquidation or collateral value of the portfolio company's assets in our estimation of enterprise value.
The significant Level 3 inputs to the Enterprise Value Waterfall model are (i) an appropriate transaction multiple and (ii) a measure of the portfolio company’s financial performance, which generally is either earnings before interest, taxes, depreciation and amortization, as adjusted, or Adjusted EBITDA, or revenues. Such inputs can be based on historical operating results, projections of future operating results or a combination thereof. The operating results of a portfolio company may be unaudited, projected or pro forma financial information and may require adjustments for certain non-recurring items. In determining the operating results input, we utilize the most recent portfolio company financial statements and forecasts available as of the valuation date. Management also consults with the portfolio company’s senior management to obtain updates on the portfolio company’s performance, including information such as industry trends, new product development, loss of customers and other operational issues. Additionally, we consider some or all of the following factors:
• |
financial standing of the issuer of the security; |
• |
comparison of the business and financial plan of the issuer with actual results; |
83
• |
the size of the security held; |
• |
pending reorganization activity affecting the issuer, such as merger or debt restructuring; |
• |
ability of the issuer to obtain needed financing; |
• |
changes in the economy affecting the issuer; |
• |
financial statements and reports from portfolio company senior management and ownership; |
• |
the type of security, the security’s cost at the date of purchase and any contractual restrictions on the disposition of the security; |
• |
information as to any transactions or offers with respect to the security and/or sales to third parties of similar securities; |
• |
the issuer’s ability to make payments and the type of collateral; |
• |
the current and forecasted earnings of the issuer; |
• |
statistical ratios compared to lending standards and to other similar securities; |
• |
pending public offering of common stock by the issuer of the security; |
• |
special reports prepared by analysts; and |
• |
any other factors we deem pertinent with respect to a particular investment. |
Fair value measurements using the Enterprise Value Waterfall model can be sensitive to changes in one or more of the inputs. Assuming all other inputs to the Enterprise Value Waterfall model remain constant, any increase (decrease) in either the transaction multiple, Adjusted EBITDA or revenues for a particular equity security would result in a higher (lower) fair value for that security.
Income Approach
Prior to the Externalization Transaction, in valuing debt securities, we utilized an "Income Approach" model that considered factors including, but not limited to, (i) the stated yield on the debt security, (ii) the portfolio company’s current Adjusted EBITDA as compared to the portfolio company’s historical or projected Adjusted EBITDA as of the date the investment was made and the portfolio company’s anticipated Adjusted EBITDA for the next twelve months of operations, (iii) the portfolio company’s current Leverage Ratio (defined as the portfolio company’s total indebtedness divided by Adjusted EBITDA) as compared to its Leverage Ratio as of the date the investment was made, (iv) publicly available information regarding current pricing and credit metrics for similar proposed and executed investment transactions of private companies and (v) when management believes a relevant comparison exists, current pricing and credit metrics for similar proposed and executed investment transactions of publicly traded debt. In addition, we used a risk rating system to estimate the probability of default on the debt securities and the probability of loss if there is a default. This risk rating system covered both qualitative and quantitative aspects of the business and the securities held.
We considered the factors above, particularly any significant changes in the portfolio company’s results of operations and leverage, and developed an expectation of the yield that a hypothetical market participant would require when purchasing the debt investment, which we refer to herein as the Required Rate of Return. The Required Rate of Return, along with the Leverage Ratio and Adjusted EBITDA, were the significant Level 3 inputs to the Income Approach model. For investments where the Leverage Ratio and Adjusted EBITDA had not fluctuated significantly from the date the investment was made or had not fluctuated significantly from management’s expectations as of the date the investment was made, and where there had been no significant fluctuations in the market pricing for such investments, we may have concluded that the Required Rate of Return was equal to the stated rate on the investment and therefore, the debt security was appropriately priced. In instances where we determined that the Required Rate of Return was different from the stated rate on the investment, we discounted the contractual cash flows on the debt instrument using the Required Rate of Return in order to estimate the fair value of the debt security.
84
Fair value measurements using the Income Approach model can be sensitive to changes in one or more of the inputs. Assuming all other inputs to the Income Approach model remain constant, any increase (decrease) in the Required Rate of Return or Leverage Ratio inputs for a particular debt security would result in a lower (higher) fair value for that security. Assuming all other inputs to the Income Approach model remain constant, any increase (decrease) in the Adjusted EBITDA input for a particular debt security would result in a higher (lower) fair value for that security.
Subsequent to the Transactions, we utilize a similar Income Approach model in valuing our private debt investment portfolio, which consists of middle-market senior secured loans with floating reference rates. As vendor and broker quotes have not historically been consistently relevant and reliable, the fair value is determined using an internal index-based pricing model that takes into account both the movement in the spread of a performing credit index as well as changes in the credit profile of the borrower. The implicit yield for each debt investment is calculated at the date the investment is made. This calculation takes into account the acquisition price (par less any upfront fee) and the relative maturity assumptions of the underlying asset. As of each balance sheet date, the implied yield for each investment is reassessed, taking into account changes in the discount margin of the baseline index, probabilities of default and any changes in the credit profile of the issuer of the security, such as fluctuations in operating levels and leverage. If there is an observable price available on a comparable security/issuer, it is used to calibrate the internal model. The implied yield used within the model is considered a significant unobservable input. As such, these assets are generally classified within Level 3. If the valuation process for a particular debt investment results in a value above par, the value is typically capped at the greater of the principal amount plus any prepayment penalty in effect or 100% of par on the basis that a market participant is likely unwilling to pay a greater amount than that at which the borrower could refinance.
Market Approach
We value our syndicated senior secured loans using values provided by independent pricing services that have been approved by the Barings' Pricing Committee. The prices received from these pricing service providers are based on yields or prices of securities of comparable quality, type, coupon and maturity and/or indications as to value from dealers and exchanges. We seek to obtain two prices from the pricing services with one price representing the primary source and the other representing an independent control valuation. We evaluate the prices obtained from brokers or pricing vendors based on available market information, including trading activity of the subject or similar securities, or by performing a comparable security analysis to ensure that fair values are reasonably estimated. We also perform back-testing of valuation information obtained from pricing vendors and brokers against actual prices received in transactions. In addition to ongoing monitoring and back-testing, we perform due diligence procedures surrounding pricing vendors to understand their methodology and controls to support their use in the valuation process.
Revenue Recognition
Interest and Dividend Income
Interest income, including amortization of premium and accretion of discount, is recorded on the accrual basis to the extent that such amounts are expected to be collected. Generally, when interest and/or principal payments on a loan become past due, or if we otherwise do not expect the borrower to be able to service its debt and other obligations, we will place the loan on non-accrual status and will generally cease recognizing interest income on that loan for financial reporting purposes until all principal and interest have been brought current through payment or due to a restructuring such that the interest income is deemed to be collectible. The cessation of recognition of such interest will negatively impact the reported fair value of the investment. We write off any previously accrued and uncollected interest when it is determined that interest is no longer considered collectible. Dividend income is recorded on the ex-dividend date.
We may have to include interest income in our ICTI, including original issue discount income, from investments that have been classified as non-accrual for financial reporting purposes. Interest income on non-accrual investments is not recognized for financial reporting purposes, but generally is recognized in ICTI. As a result, we may be required to make a distribution to our stockholders in order to satisfy the minimum distribution requirements to maintain our RIC tax treatment, even though we will not have received and may not ever receive any
85
corresponding cash amount. Additionally, any loss recognized by us for U.S. federal income tax purposes on previously accrued interest income will be treated as a capital loss.
Fee Income
Origination, facility, commitment, consent and other advance fees received in connection with the origination of a loan, or Loan Origination Fees, are recorded as deferred income and recognized as investment income over the term of the loan. Upon prepayment of a loan, any unamortized Loan Origination Fees are recorded as investment income. In the general course of our business, we receive certain fees from portfolio companies, which are non-recurring in nature. Such fees include loan prepayment penalties, advisory, loan amendment and other fees, and are recorded as investment income when earned.
Fee income for the years ended December 31, 2018, 2017 and 2016 was as follows:
Years Ended December 31, |
|||||||||||
2018 |
2017 |
2016 |
|||||||||
Recurring Fee Income: |
|||||||||||
Amortization of loan origination fees |
$ |
1,374,049 |
$ |
2,445,485 |
$ |
2,161,711 |
|||||
Management, valuation and other fees |
427,628 |
940,361 |
1,024,213 |
||||||||
Total Recurring Fee Income |
1,801,677 |
3,385,846 |
3,185,924 |
||||||||
Non-Recurring Fee Income: |
|||||||||||
Prepayment fees |
1,191,943 |
2,688,814 |
1,903,251 |
||||||||
Acceleration of unamortized loan origination fees |
1,932,367 |
4,202,078 |
2,406,688 |
||||||||
Advisory, loan amendment and other fees |
242,914 |
371,278 |
890,002 |
||||||||
Total Non-Recurring Fee Income |
3,367,224 |
7,262,170 |
5,199,941 |
||||||||
Total Fee Income |
$ |
5,168,901 |
$ |
10,648,016 |
$ |
8,385,865 |
|||||
Payment-in-Kind (PIK) Interest Income
As of December 31, 2018 we did not hold, but may hold in the future, loans that contained PIK interest provisions. PIK interest, computed at the contractual rate specified in each loan agreement, is periodically added to the principal balance of the loan, rather than being paid to us in cash, and is recorded as interest income. Thus, the actual collection of PIK interest may be deferred until the time of debt principal repayment.
PIK interest, which is a non-cash source of income at the time of recognition, is included in our taxable income and therefore affects the amount we are required to distribute to our stockholders to maintain our tax treatment as a RIC for U.S. federal income tax purposes, even though we have not yet collected the cash. Generally, when current cash interest and/or principal payments on a loan become past due, or if we otherwise do not expect the borrower to be able to service its debt and other obligations, we will place the loan on non-accrual status and will generally cease recognizing PIK interest income on that loan for financial reporting purposes until all principal and interest have been brought current through payment or due to a restructuring such that the interest income is deemed to be collectible. We write off any previously accrued and uncollected PIK interest when it is determined that the PIK interest is no longer collectible.
We may have to include in our ICTI, PIK interest income from investments that have been classified as non-accrual for financial reporting purposes. Interest income on non-accrual investments is not recognized for financial reporting purposes, but generally is recognized in ICTI. As a result, we may be required to make a distribution to our stockholders in order to satisfy the minimum distribution requirements, even though we will not have received and may not ever receive any corresponding cash amount.
Quantitative and Qualitative Disclosures About Market Risk
We are subject to market risk. Market risk includes risks that arise from changes in interest rates, commodity prices, equity prices and other market changes that affect market sensitive instruments. The prices of securities held
86
by us may decline in response to certain events, including those directly involving the companies we invest in; conditions affecting the general economy; overall market changes; legislative reform; local, regional, national or global political, social or economic instability; and interest rate fluctuations.
In addition, we are subject to interest rate risk. Interest rate risk is defined as the sensitivity of our current and future earnings to interest rate volatility, variability of spread relationships, the difference in re-pricing intervals between our assets and liabilities and the effect that interest rates may have on our cash flows. Changes in the general level of interest rates can affect our net interest income, which is the difference between the interest income earned on interest earning assets and our interest expense incurred in connection with our interest bearing debt and liabilities. Changes in interest rates can also affect, among other things, our ability to acquire and originate loans and securities and the value of our investment portfolio. Our net investment income is affected by fluctuations in various interest rates. Our risk management systems and procedures are designed to identify and analyze our risk, to set appropriate policies and limits and to continually monitor these risks. We regularly measure exposure to interest rate risk and determine whether or not any hedging transactions are necessary to mitigate exposure to changes in interest rates. As of December 31, 2018, we were not a party to any hedging arrangements.
As of December 31, 2018, all of our debt portfolio investments (principal amount of approximately $1,177.8 million as of December 31, 2018) bore interest at variable rates, which generally are LIBOR-based, and many of which are subject to certain floors. A hypothetical 200 basis point increase or decrease in the interest rates on our variable-rate debt investments could increase or decrease, as applicable, our investment income by a maximum of $23.6 million on an annual basis.
All borrowings under the August 2018 Credit Facility bear interest, subject to BSF’s election, on a per annum basis equal to (i) the applicable base rate plus the applicable spread or (ii) the applicable LIBOR rate plus the applicable spread. The applicable base rate is equal to the greater of (i) the federal funds rate plus 0.5%, (ii) the prime rate or (iii) one-month LIBOR plus 1.0%. The applicable LIBOR rate depends on the term of the borrowing under the August 2018 Credit Facility, which can be either one month or three months. A hypothetical 200 basis point increase or decrease in the interest rates on the August 2018 Credit Facility could increase or decrease, as applicable, our interest expense by a maximum of $11.4 million on an annual basis (based on the amount of outstanding borrowings under the August 2018 Credit Facility as of December 31, 2018). BSF is required to pay commitment fees on the unused portion of the August 2018 Credit Facility beginning the ninetieth day after the closing date. BSF may prepay any borrowing at any time without premium or penalty, except that BSF may be liable for certain funding breakage fees if prepayments occur prior to expiration of the relevant interest period. BSF may also permanently reduce all or a portion of the commitment amount under the August 2018 Credit Facility without penalty after the six-month anniversary of the closing date.
In July 2017, the head of the United Kingdom Financial Conduct Authority announced the desire to phase out the use of LIBOR by the end of 2021. There is currently no definitive information regarding the future utilization of LIBOR or of any particular replacement rate. As such, the potential effect of any such event on our cost of capital and net investment income cannot yet be determined. In addition, any further changes or reforms to the determination or supervision of LIBOR may result in a sudden or prolonged increase or decrease in reported LIBOR, which could have an adverse impact on the market value for or value of any LIBOR-linked securities, loans, and other financial obligations or extensions of credit held by or due to us and could have a material adverse effect on our business, financial condition and results of operations.
Because we have previously borrowed, and plan to borrow in the future, money to make investments, our net investment income will be dependent upon the difference between the rate at which we borrow funds and the rate at which we invest the funds borrowed. Accordingly, there can be no assurance that a significant change in market interest rates will not have a material adverse effect on our net investment income. In periods of rising interest rates, our cost of funds would increase, which could reduce our net investment income if there is not a corresponding increase in interest income generated by our investment portfolio.
We may also have exposure to foreign currencies related to certain investments. Such investments are translated into United States dollars based on the spot rate at each balance sheet date, exposing us to movements in the exchange rate.
87
Off-Balance Sheet Arrangements
In the normal course of business, we are party to financial instruments with off-balance sheet risk, consisting primarily of unused commitments to extend financing to our portfolio companies. Since commitments may expire without being drawn upon, the total commitment amount does not necessarily represent future cash requirements. The balance of unused commitments to extend financing as of December 31, 2018 was as follows:
Portfolio Company |
Investment Type |
December 31, 2018 |
||
Aveanna Healthcare Holdings, Inc. (f/k/a BCPE Eagle Buyer LLC) |
Delayed Draw Term Loan |
$ |
804,620 |
|
JS Held, LLC |
Delayed Draw Term Loan |
2,275,039 |
||
Lighthouse Autism Center |
Delayed Draw Term Loan |
6,172,840 |
||
Smile Brands, Inc. |
Delayed Draw Term Loan |
1,325,699 |
||
Transportation Insight, LLC |
Delayed Draw Term Loan |
5,516,932 |
||
US Legal Support, Inc. |
Delayed Draw Term Loan |
3,153,265 |
||
Total unused commitments |
$ |
19,248,395 |
||
Contractual Obligations
As of December 31, 2018, our future fixed commitments for cash payments were as follows:
Total |
2019 |
2020-2021 |
2022-2023 |
2024-Future |
||||||||||||||||
August 2018 Credit Facility borrowings |
$ |
570,000,000 |
$ |
190,000,000 |
$ |
380,000,000 |
$ |
— |
$ |
— |
||||||||||
Interest and fees on August 2018 Credit Facility(1) |
27,445,008 |
18,904,662 |
8,540,346 |
— |
— |
|||||||||||||||
Unused commitments to extend financing |
19,248,395 |
19,248,395 |
— |
— |
— |
|||||||||||||||
Total |
$ |
616,693,403 |
$ |
228,153,057 |
$ |
388,540,346 |
$ |
— |
$ |
— |
||||||||||
(1) |
Amounts represent (i) credit facility commitment fees calculated on the unused amount, which was $180.0 million as of December 31, 2018, (ii) interest expense calculated at a rate of 3.654% of outstanding credit facility borrowings, which were $570.0 million as of December 31, 2018 and (iii) annual fees of the credit facility administrative agent.
|
Recent Developments
Subsequent to December 31, 2018, we made approximately $43.6 million of new middle-market private debt commitments, of which approximately $15.7 million closed. The $43.6 million of middle-market investments consist of 100% first lien senior secured debt. The weighted average origination yield based on a three-year average life (inclusive of the upfront fees received) was 8.3%.
On February 21, 2019, we entered into a senior secured revolving credit agreement, or the 2019 Credit Facility, with ING Capital LLC, or ING, as administrative agent, and the lenders party thereto. The initial commitments under the 2019 Credit Facility total $800.0 million. The 2019 Credit Facility has an accordion feature that allows for an increase in the total commitments of up to $400.0 million, subject to certain conditions and the satisfaction of specified financial covenants. We can borrow foreign currencies directly under the 2019 Credit Facility. The 2019 Credit Facility, which is structured as a revolving credit facility, is secured primarily by a material portion of our assets and guaranteed by certain of our subsidiaries. The revolving period of the 2019 Credit Facility ends on February 21, 2023, followed by a one-year amortization period with a final maturity date of February 21, 2024.
Borrowings under the 2019 Credit Facility bear interest, subject to our election, on a per annum basis equal to (i) the applicable base rate plus 1.25% (or, after one year, 1.00% if we receive an investment grade credit rating),
88
(ii) the applicable LIBOR rate plus 2.25% (or, after one year, 2.00% if we receive an investment grade credit rating), (iii) for borrowings denominated in Canadian dollars, the applicable Canadian dollars Screen Rate plus 2.25% (or, after one year, 2.00% if we receive an investment grade credit rating), or (iv) for borrowings denominated in Australian dollars, the applicable Australian dollars Screen Rate, plus 2.45% (or, after one year, 2.20% if the we receive an investment grade credit rating). The applicable base rate is equal to the greatest of (i) the prime rate, (ii) the federal funds rate plus 0.5%, (iii) the Overnight Bank Funding Rate plus 0.5%, (iv) the adjusted three-month LIBOR plus 1.0% and (v) 1%. The applicable LIBOR rate depends on the term of the draw under the 2019 Credit Facility. We pay a commitment fee of (i) for the period beginning on the closing date of the 2019 Credit Facility to and including the date that is six months after the closing date of the 2019 Credit Facility, 0.375% per annum on undrawn amounts, and (ii) for the period beginning on the date that is six months after the closing date of the 2019 Credit Facility, (x) 0.5% per annum on undrawn amounts if the unused portion of the 2019 Credit Facility is greater than one third of total commitments or (y) 0.375% per annum on undrawn amounts if the unused portion of the 2019 Credit Facility is equal to or less than one third of total commitments.
The 2019 Credit Facility contains certain affirmative and negative covenants, including but not limited to (i) maintaining minimum shareholders' equity, (ii) maintaining minimum obligors' net worth, (iii) maintaining a minimum asset coverage ratio, (iv) meeting a minimum liquidity test and (v) maintaining our status as a regulated investment company and as a business development company. The 2019 Credit Facility also contains customary events of default with customary cure and notice provisions, including, without limitation, nonpayment, misrepresentation of representations and warranties in a material respect, breach of covenant, cross-default to other indebtedness, bankruptcy, change of control, and material adverse effect. The 2019 Credit Facility also permits the administrative agent to select an independent third party valuation firm to determine valuations of certain portfolio investments for purposes of borrowing base provisions. In connection with the 2019 Credit Facility, we also entered into new collateral documents.
Following the closing of the 2019 Credit Facility, we provided notice to the lenders under the August 2018 Credit Facility that we would reduce our Class A Loan Commitments under the August 2018 Credit Facility from $250.0 million to $100.0 million, which reduces total commitments under the August 2018 Credit Facility from $750.0 million to $600.0 million effective February 28, 2019.
On February 25, 2019, the Board declared a quarterly distribution of $0.12 per share payable on March 20, 2019 to holders of record as of March 13, 2019.
On February 25, 2019, we adopted a share repurchase plan, pursuant to Board approval, for the purpose of repurchasing shares of our common stock in the open market (the "Share Repurchase Plan"). The Board has authorized us to repurchase in 2019 up to a maximum of 5.0% of the amount of shares outstanding under the following targets:
• |
a maximum of 2.5% of the amount of shares of our common stock outstanding if shares trade below NAV per share but in excess of 90% of NAV per share; and |
• |
a maximum of 5.0% of the amount of shares of our common stock outstanding if shares trade below 90% of NAV per share. |
The Share Repurchase Plan will be executed in accordance with applicable rules under the Exchange Act including Rules 10b5-1 and 10b-18 thereunder, as well as certain price, market volume and timing constraints specified in the Share Repurchase Plan. The Share Repurchase Plan is designed to allow us to repurchase our shares both during its open window periods and at times when it otherwise might be prevented from doing so under applicable insider trading laws or because of self-imposed trading blackout periods. A broker selected by us has been delegated the authority to repurchase shares on our behalf in the open market, pursuant to, and under the terms and limitations of, the Share Repurchase Plan. There is no assurance that we will purchase shares at any specific discount levels or in any specific amounts. Our repurchase activity will be disclosed in our periodic reports for the relevant fiscal periods. There is no assurance that the market price of our shares, either absolutely or relative to net asset value, will increase as a result of any share repurchases, or that the Share Repurchase Plan will enhance stockholder value over the long term.
89
Item 7A. Quantitative and Qualitative Disclosures About Market Risk.
See the section entitled “Quantitative and Qualitative Disclosures About Market Risk” included in “Management’s Discussion and Analysis of Financial Condition and Results of Operations,” which is included in Item 7 of Part II of this Annual Report and is incorporated by reference herein.
Item 8. Financial Statements and Supplementary Data.
See our Financial Statements included herein and listed in Item 15(a) of this Annual Report.
Item 9. Changes in and Disagreements with Accountants on Accounting and Financial Disclosure.
Not applicable.
Item 9A. Controls and Procedures.
Evaluation of Disclosure Controls and Procedures
We maintain disclosure controls and procedures that are designed to ensure that information required to be disclosed in the reports that we file or submit under the Exchange Act is recorded, processed, summarized and reported within the time periods specified in the SEC’s rules and forms and that such information is accumulated and communicated to our management, including our Chief Executive Officer and Chief Financial Officer, as appropriate, to allow timely decisions regarding required disclosure. Our Chief Executive Officer and Chief Financial Officer carried out an evaluation of the effectiveness of the design and operation of our disclosure controls and procedures as of the end of the period covered by this report. Based on the evaluation of these disclosure controls and procedures, the Chief Executive Officer and Chief Financial Officer concluded that our disclosure controls and procedures were effective. It should be noted that any system of controls, however well designed and operated, can provide only reasonable, and not absolute, assurance that the objectives of the system are met. In addition, the design of any control system is based in part upon certain assumptions about the likelihood of future events. Because of these and other inherent limitations of control systems, there can be no assurance that any design will succeed in achieving its stated goals under all potential future conditions, regardless of how remote.
Management’s Report on Internal Control over Financial Reporting
Our management, including our Chief Executive Officer and Chief Financial Officer, is responsible for establishing and maintaining adequate internal control over financial reporting, as such term is defined in Rules 13a-15(f) and 15d-15(f) under the Exchange Act. Our internal control over financial reporting is a process designed to provide reasonable assurance regarding the reliability of financial reporting and the preparation of our financial statements for external reporting purposes in accordance with U.S. GAAP. Internal control over financial reporting includes those policies and procedures that: (i) pertain to the maintenance of records that in reasonable detail accurately and fairly reflect the transactions and dispositions of the assets of the company; (ii) provide reasonable assurance that transactions are recorded as necessary to permit preparation of financial statements in accordance with U.S. GAAP, and that receipts and expenditures of the company are being made only in accordance with authorizations of management and directors of the company; and (iii) provide reasonable assurance regarding prevention or timely detection of unauthorized acquisition, use, or disposition of the company’s assets that could have a material effect on the financial statements. Because of its inherent limitations, internal control over financial reporting may not prevent or detect misstatements. Also, projections of any evaluation of effectiveness to future periods are subject to the risk that controls may become inadequate because of changes in conditions, or that the degree of compliance with policies or procedures may deteriorate.
Management (with the participation of our Chief Executive Officer and Chief Financial Officer) conducted an evaluation of the effectiveness of our internal control over financial reporting based on the framework in Internal Control — Integrated Framework issued in 2013 by the Committee of Sponsoring Organizations of the Treadway Commission. Based on this evaluation, management concluded that our internal control over financial reporting was effective as of December 31, 2018.
90
Our internal control over financial reporting as of December 31, 2018 has been audited by Ernst & Young LLP, an independent registered public accounting firm, as stated in their report, which is included in Item 15 of Part III of this Annual Report.
Changes in Internal Control Over Financial Reporting
There were no changes in our internal control over financial reporting during the fourth quarter of 2018 that have materially affected, or are reasonably likely to materially affect, our internal control over financial reporting.
Item 9B. Other Information.
Not applicable.
PART III
Item 10. Directors, Executive Officers and Corporate Governance.
We have adopted a code of ethics, the Global Code of Ethics Policy, which apply to, among others, our executive officers, including our Chief Executive Officer and Chief Financial Officer, as well as Barings' officers, directors and employees. The Global Code of Ethics Policy is publicly available on our website under “Corporate Governance” at the following URL: https://ir.barings.com/governance-docs.
We will provide any person, without charge, upon request, a copy of our Global Code of Ethics Policy. To receive a copy, please provide a written request to: Barings BDC, Inc., Attn: Chief Compliance Officer, 300 South Tryon Street, Suite 2500 Charlotte, North Carolina, 28202. There have been no material changes to the procedures by which stockholders may recommend nominees to the Board that have been implemented since the date the Company last filed a periodic report with the SEC.
Except as set forth above, the information required by this Item with respect to our directors, executive officers and corporate governance matters is incorporated by reference from our definitive Proxy Statement for our 2019 Annual Meeting of Stockholders, to be filed with the SEC pursuant to Regulation 14A under the Exchange Act. Our definitive Proxy Statement will be filed with the SEC within 120 days after the date of our fiscal year-end, which was December 31, 2018.
Item 11. Executive Compensation.
The information required by this Item with respect to compensation of executive officers and directors is incorporated by reference from our definitive Proxy Statement for our 2019 Annual Meeting of Stockholders, to be filed with the SEC pursuant to Regulation 14A under the Exchange Act. Our definitive Proxy Statement will be filed with the SEC within 120 days after the date of our fiscal year-end, which was December 31, 2018.
Item 12. Security Ownership of Certain Beneficial Owners and Management and Related Stockholder Matters.
The information required by this Item with respect to security ownership of certain beneficial owners and management is incorporated by reference from our definitive Proxy Statement for our 2019 Annual Meeting of Stockholders, to be filed with the SEC pursuant to Regulation 14A under the Exchange Act. Our definitive Proxy Statement will be filed with the SEC within 120 days after the date of our fiscal year-end, which was December 31, 2018.
Item 13. Certain Relationships and Related Transactions, and Director Independence.
The information required by this Item with respect to certain relationships and related transactions and director independence is incorporated by reference from our definitive Proxy Statement for our 2019 Annual Meeting of Stockholders, to be filed with the SEC pursuant to Regulation 14A under the Exchange Act. Our definitive Proxy Statement will be filed with the SEC within 120 days after the date of our fiscal year-end, which was December 31, 2018.
91
Item 14. Principal Accountant Fees and Services.
The information required by this Item with respect to principal accountant fees and services is incorporated by reference from our definitive Proxy Statement for our 2019 Annual Meeting of Stockholders, to be filed with the SEC pursuant to Regulation 14A under the Exchange Act. Our definitive Proxy Statement will be filed with the SEC within 120 days after the date of our fiscal year-end, which was December 31, 2018.
PART IV
Item 15. Exhibits and Financial Statement Schedules.
(a) The following documents are filed as part of this Report:
(1) Financial Statements
Barings BDC, Inc. Financial Statements:
Page |
|
(2) Financial Statement Schedules
None.
Schedules that are not listed herein have been omitted because they are not applicable or the information required to be set forth therein is included in the Consolidated Financial Statements or notes thereto.
(3) List of Exhibits
The exhibits required by Item 601 of Regulation S-K, except as otherwise noted, have been filed with previous reports by the Registrant and are herein incorporated by reference.
Number |
Exhibit |
|
2.1 |
||
3.1 |
||
3.2 |
||
3.3 |
||
3.4 |
||
92
Number |
Exhibit |
|
3.5 |
||
3.6 |
||
4.1 |
||
4.2 |
||
4.3 |
||
10.1 |
||
10.2 |
||
10.3 |
||
10.4 |
||
10.5 |
||
10.6 |
||
10.7 |
||
10.8 |
||
10.9 |
||
10.10 |
||
93
Number |
Exhibit |
|
10.11† |
||
10.12† |
||
10.13† |
||
10.14† |
||
21.1 |
||
31.1 |
||
31.2 |
||
32.1 |
||
32.2 |
||
† |
Management contract or compensatory plan or arrangement. |
* |
Filed herewith. |
** |
Furnished herewith. |
(b) Exhibits
See Item 15(a)(3) above.
(c) Financial Statement Schedules
See Item 15(a)(2) above.
94
SIGNATURES
Pursuant to the requirements of Section 13 or 15(d) the Securities Exchange Act of 1934, the Registrant has duly caused this report to be signed on its behalf by the undersigned, thereunto duly authorized.
Date: February 27, 2019
BARINGS BDC, INC. |
||||
By: |
/s/ Eric Lloyd |
|||
Name: Eric Lloyd |
||||
Title: Chief Executive Officer |
||||
Pursuant to the requirements of the Securities Exchange Act of 1934, this report has been signed below by the following persons on behalf of the registrant and in the capacities and on the dates indicated.
Signature |
Title |
Date |
||
/s/ Eric Lloyd |
Chief Executive Officer and Director
(Principal Executive Officer)
|
February 27, 2019 |
||
Eric Lloyd |
||||
/s/ Ian Fowler |
President |
February 27, 2019 |
||
Ian Fowler |
||||
/s/ Jonathan Bock |
Chief Financial Officer
(Principal Financial Officer)
|
February 27, 2019 |
||
Jonathan Bock |
||||
/s/ C. Robert Knox, Jr. |
Controller (Principal Accounting Officer) |
February 27, 2019 |
||
C. Robert Knox, Jr. |
||||
/s/ Michael Freno |
Chairman of the Board |
February 27, 2019 |
||
Michael Freno |
||||
/s/ Tom Finke |
Director |
February 27, 2019 |
||
Tom Finke |
||||
/s/ Mark F. Mulhern |
Director |
February 27, 2019 |
||
Mark F. Mulhern |
||||
/s/ Thomas W. Okel |
Director |
February 27, 2019 |
||
Thomas W. Okel |
||||
/s/ Jill Olmstead |
Director |
February 27, 2019 |
||
Jill Olmstead |
||||
/s/ John A. Switzer |
Director |
February 27, 2019 |
||
John A. Switzer |
||||
95
Barings BDC, Inc.
Index to Financial Statements and Financial Statement Schedules
Page |
|||
Report of Independent Registered Public Accounting Firm
To the Shareholders and the Board of Directors of Barings BDC, Inc.
Opinion on the Financial Statements
We have audited the accompanying consolidated balance sheets of Barings BDC, Inc. (the “Company”), including the consolidated schedules of investments, as of December 31, 2018 and 2017, the related consolidated statements of operations, changes in net assets, and cash flows for each of the three years in the period ended December 31, 2018, and the related notes (collectively referred to as the “consolidated financial statements”). In our opinion, the consolidated financial statements present fairly, in all material respects, the financial position of the Company at December 31, 2018 and 2017, the results of its operations, changes in its net assets, and its cash flows for each of the three years in the period ended December 31, 2018, in conformity with U.S. generally accepted accounting principles.
We also have audited, in accordance with the standards of the Public Company Accounting Oversight Board (United States) (PCAOB), the Company's internal control over financial reporting as of December 31, 2018, based on criteria established in Internal Control-Integrated Framework issued by the Committee of Sponsoring Organizations of the Treadway Commission (2013 framework) and our report dated February 27, 2019 expressed an unqualified opinion thereon.
Basis for Opinion
These financial statements are the responsibility of the Company's management. Our responsibility is to express an opinion on the Company’s financial statements based on our audits. We are a public accounting firm registered with the PCAOB and are required to be independent with respect to the Company in accordance with the U.S. federal securities laws and the applicable rules and regulations of the Securities and Exchange Commission and the PCAOB.
We conducted our audits in accordance with the standards of the PCAOB. Those standards require that we plan and perform the audit to obtain reasonable assurance about whether the financial statements are free of material misstatement, whether due to error or fraud. Our audits included performing procedures to assess the risks of material misstatement of the financial statements, whether due to error or fraud, and performing procedures that respond to those risks. Such procedures included examining, on a test basis, evidence regarding the amounts and disclosures in the financial statements. Our procedures included confirmation of investments owned as of December 31, 2018 and 2017, by correspondence with the custodians, agents and/or directly with management or designees of the portfolio companies or by other appropriate auditing procedures where replies from agents were not received, as applicable. Our audits also included evaluating the accounting principles used and significant estimates made by management, as well as evaluating the overall presentation of the financial statements. We believe that our audits provide a reasonable basis for our opinion.
/s/ Ernst & Young LLP
We have served as the Company's auditor since 2006.
Charlotte, North Carolina
February 27, 2019
F-1
Report of Independent Registered Public Accounting Firm
To the Shareholders and the Board of Directors of Barings BDC, Inc.
Opinion on Internal Control over Financial Reporting
We have audited Barings BDC, Inc.’s internal control over financial reporting as of December 31, 2018, based on criteria established in Internal Control - Integrated Framework issued by the Committee of Sponsoring Organizations of the Treadway Commission (2013 framework) (the COSO criteria). In our opinion, Barings BDC, Inc. (the "Company") maintained, in all material respects, effective internal control over financial reporting as of December 31, 2018, based on the COSO criteria.
We also have audited, in accordance with the standards of the Public Company Accounting Oversight Board (United States) (PCAOB), the consolidated balance sheets of the Company, including the consolidated schedules of investments, as of December 31, 2018 and 2017, and the related consolidated statements of operations, changes in net assets, and cash flows for each of the three years in the period ended December 31, 2018, and the related notes and our report dated February 27, 2019 expressed an unqualified opinion thereon.
Basis for Opinion
The Company’s management is responsible for maintaining effective internal control over financial reporting and for its assessment of the effectiveness of internal control over financial reporting included in the accompanying Management’s Report on Internal Control over Financial Reporting. Our responsibility is to express an opinion on the Company’s internal control over financial reporting based on our audit. We are a public accounting firm registered with the PCAOB and are required to be independent with respect to the Company in accordance with the U.S. federal securities laws and the applicable rules and regulations of the Securities and Exchange Commission and the PCAOB.
We conducted our audit in accordance with the standards of the PCAOB. Those standards require that we plan and perform the audit to obtain reasonable assurance about whether effective internal control over financial reporting was maintained in all material respects.
Our audit included obtaining an understanding of internal control over financial reporting, assessing the risk that a material weakness exists, testing and evaluating the design and operating effectiveness of internal control based on the assessed risk, and performing such other procedures as we considered necessary in the circumstances. We believe that our audit provides a reasonable basis for our opinion.
Definition and Limitations of Internal Control Over Financial Reporting
A company’s internal control over financial reporting is a process designed to provide reasonable assurance regarding the reliability of financial reporting and the preparation of financial statements for external purposes in accordance with generally accepted accounting principles. A company’s internal control over financial reporting includes those policies and procedures that (1) pertain to the maintenance of records that, in reasonable detail, accurately and fairly reflect the transactions and dispositions of the assets of the company; (2) provide reasonable assurance that transactions are recorded as necessary to permit preparation of financial statements in accordance with generally accepted accounting principles, and that receipts and expenditures of the company are being made only in accordance with authorizations of management and directors of the company; and (3) provide reasonable assurance regarding prevention or timely detection of unauthorized acquisition, use, or disposition of the company’s assets that could have a material effect on the financial statements.
F-2
Because of its inherent limitations, internal control over financial reporting may not prevent or detect misstatements. Also, projections of any evaluation of effectiveness to future periods are subject to the risk that controls may become inadequate because of changes in conditions, or that the degree of compliance with the policies or procedures may deteriorate.
/s/ Ernst & Young LLP
Charlotte, North Carolina
February 27, 2019
F-3
Barings BDC, Inc.
Consolidated Balance Sheets
December 31, |
||||||||
2018 |
2017 |
|||||||
Assets: |
||||||||
Investments at fair value: |
||||||||
Non-Control / Non-Affiliate investments (cost of $1,128,694,715 and $910,150,765 at December 31, 2018 and 2017, respectively) |
$ |
1,076,631,804 |
$ |
831,194,397 |
||||
Affiliate investments (cost of $149,099,548 at December 31, 2017) |
— |
147,101,949 |
||||||
Control investments (cost of $62,375,532 at December 31, 2017) |
— |
37,988,000 |
||||||
Short-term investments (cost of $45,223,941 at December 31, 2018) |
45,223,941 |
— |
||||||
Total investments at fair value |
1,121,855,745 |
1,016,284,346 |
||||||
Cash |
12,426,982 |
191,849,697 |
||||||
Interest and fees receivable |
6,008,700 |
7,806,887 |
||||||
Prepaid expenses and other assets |
4,123,742 |
1,936,010 |
||||||
Deferred financing fees |
251,908 |
5,186,672 |
||||||
Receivable from unsettled transactions |
22,909,998 |
— |
||||||
Total assets |
$ |
1,167,577,075 |
$ |
1,223,063,612 |
||||
Liabilities: |
||||||||
Accounts payable and accrued liabilities |
$ |
5,327,249 |
$ |
11,990,848 |
||||
Interest payable |
749,525 |
3,997,480 |
||||||
Payable from unsettled transactions |
28,533,014 |
— |
||||||
Borrowings under credit facilities |
570,000,000 |
156,070,484 |
||||||
Notes, net of deferred financing fees |
— |
163,408,301 |
||||||
SBA-guaranteed debentures payable, net of deferred financing fees |
— |
246,321,125 |
||||||
Total liabilities |
604,609,788 |
581,788,238 |
||||||
Commitments and contingencies (Note 9) |
||||||||
Net Assets: |
||||||||
Common stock, $0.001 par value per share (150,000,000 shares authorized, 51,284,064 and 47,740,832 shares issued and outstanding as of December 31, 2018 and 2017, respectively) |
51,284 |
47,741 |
||||||
Additional paid in capital |
884,894,249 |
823,614,881 |
||||||
Total distributable earnings (loss) |
(321,978,246 |
) |
(182,387,248 |
) |
||||
Total net assets |
562,967,287 |
641,275,374 |
||||||
Total liabilities and net assets |
$ |
1,167,577,075 |
$ |
1,223,063,612 |
||||
Net asset value per share |
$ |
10.98 |
$ |
13.43 |
||||
See accompanying notes.
F-4
Barings BDC, Inc.
Consolidated Statements of Operations
Year Ended December 31, |
||||||||||||
2018 |
2017 |
2016 |
||||||||||
Investment income: |
||||||||||||
Interest income: |
||||||||||||
Non-Control / Non-Affiliate investments |
$ |
61,223,025 |
$ |
83,421,527 |
$ |
73,110,821 |
||||||
Affiliate investments |
5,580,051 |
13,462,551 |
13,262,066 |
|||||||||
Control investments |
644,805 |
1,155,791 |
1,017,716 |
|||||||||
Short-term investments |
950,736 |
— |
— |
|||||||||
Total interest income |
68,398,617 |
98,039,869 |
87,390,603 |
|||||||||
Dividend income: |
||||||||||||
Non-Control / Non-Affiliate investments |
252,369 |
2,364,569 |
912,304 |
|||||||||
Affiliate investments |
642,187 |
319,619 |
1,107,920 |
|||||||||
Control investments |
— |
— |
300,333 |
|||||||||
Total dividend income |
894,556 |
2,684,188 |
2,320,557 |
|||||||||
Fee and other income: |
||||||||||||
Non-Control / Non-Affiliate investments |
4,459,511 |
9,134,573 |
6,735,108 |
|||||||||
Affiliate investments |
601,571 |
1,106,151 |
1,250,757 |
|||||||||
Control investments |
107,819 |
407,292 |
400,000 |
|||||||||
Total fee and other income |
5,168,901 |
10,648,016 |
8,385,865 |
|||||||||
Payment-in-kind interest income: |
||||||||||||
Non-Control / Non-Affiliate investments |
2,814,474 |
8,367,457 |
11,113,845 |
|||||||||
Affiliate investments |
962,080 |
2,550,074 |
4,120,574 |
|||||||||
Total payment-in-kind interest income |
3,776,554 |
10,917,531 |
15,234,419 |
|||||||||
Interest income from cash and cash equivalent investments |
1,984,997 |
715,028 |
348,113 |
|||||||||
Total investment income |
80,223,625 |
123,004,632 |
113,679,557 |
|||||||||
Operating expenses: |
||||||||||||
Interest and other financing fees |
23,887,331 |
29,261,030 |
26,720,572 |
|||||||||
Base management fee (Note 2) |
4,218,628 |
— |
— |
|||||||||
Compensation expenses |
37,487,461 |
16,135,739 |
23,675,809 |
|||||||||
General and administrative expenses (Note 2) |
16,177,534 |
5,370,046 |
4,406,303 |
|||||||||
Total operating expenses |
81,770,954 |
50,766,815 |
54,802,684 |
|||||||||
Base management fee waived (Note 2) |
(1,486,607 |
) |
— |
— |
||||||||
Net operating expenses |
80,284,347 |
50,766,815 |
54,802,684 |
|||||||||
Net investment income (loss) |
(60,722 |
) |
72,237,817 |
58,876,873 |
||||||||
F-5
|
Barings BDC, Inc.
Consolidated Statements of Operations - (Continued)
| ||||||||||||
Year Ended December 31, |
||||||||||||
2018 |
2017 |
2016 |
||||||||||
Realized and unrealized gains (losses) on investments and foreign currency borrowings: |
||||||||||||
Net realized gains (losses): |
||||||||||||
Non-Control / Non-Affiliate investments |
$ |
(130,870,385 |
) |
$ |
(3,683,168 |
) |
$ |
(2,413,750 |
) |
|||
Affiliate investments |
9,939,330 |
(3,979,667 |
) |
4,398,798 |
||||||||
Control investments |
(38,542,704 |
) |
(45,205,868 |
) |
— |
|||||||
Net realized gains (losses) on investments |
(159,473,759 |
) |
(52,868,703 |
) |
1,985,048 |
|||||||
Foreign currency borrowings |
1,081,211 |
1,268,776 |
— |
|||||||||
Net realized gains (losses) |
(158,392,548 |
) |
(51,599,927 |
) |
1,985,048 |
|||||||
Net unrealized appreciation (depreciation): |
||||||||||||
Non-Control / Non-Affiliate investments |
27,025,025 |
(65,786,245 |
) |
(9,079,811 |
) |
|||||||
Affiliate investments |
3,197,568 |
(7,356,046 |
) |
(5,473,012 |
) |
|||||||
Control investments |
24,387,532 |
27,547,274 |
(11,464,464 |
) |
||||||||
Net unrealized appreciation (depreciation) on investments |
54,610,125 |
(45,595,017 |
) |
(26,017,287 |
) |
|||||||
Foreign currency borrowings |
(863,980 |
) |
(2,821,924 |
) |
(152,957 |
) |
||||||
Net unrealized appreciation (depreciation) |
53,746,145 |
(48,416,941 |
) |
(26,170,244 |
) |
|||||||
Net realized and unrealized losses on investments and foreign currency borrowings |
(104,646,403 |
) |
(100,016,868 |
) |
(24,185,196 |
) |
||||||
Loss on extinguishment of debt |
(10,507,183 |
) |
— |
— |
||||||||
Benefit from (provision for) taxes |
932,172 |
(871,410 |
) |
(435,245 |
) |
|||||||
Net increase (decrease) in net assets resulting from operations |
$ |
(114,282,136 |
) |
$ |
(28,650,461 |
) |
$ |
34,256,432 |
||||
Net investment income (loss) per share — basic and diluted |
$ |
— |
$ |
1.55 |
$ |
1.62 |
||||||
Net increase (decrease) in net assets resulting from operations per share — basic and diluted |
$ |
(2.29 |
) |
$ |
(0.62 |
) |
$ |
0.94 |
||||
Dividends/distributions per share: |
||||||||||||
Total dividends/distributions |
$ |
0.43 |
$ |
1.65 |
$ |
1.89 |
||||||
Weighted average number of shares outstanding — basic and diluted |
49,897,085 |
46,497,977 |
36,405,024 |
|||||||||
See accompanying notes.
F-6
Barings BDC, Inc.
Consolidated Statements of Changes in Net Assets
Common Stock |
Additional
Paid-In
Capital
|
Total Distributable Earnings (Loss) |
|||||||||||||||||
|
Number
of Shares
|
Par
Value
|
Total
Net Assets
|
|||||||||||||||||
Balance, January 1, 2016 |
33,375,126 |
$ |
33,375 |
$ |
549,242,439 |
$ |
(40,908,059 |
) |
$ |
508,367,755 |
|||||||||
Net investment income |
— |
— |
— |
58,876,873 |
58,876,873 |
||||||||||||||
Stock-based compensation |
— |
— |
10,331,464 |
— |
10,331,464 |
||||||||||||||
Net realized gain on investments / foreign currency |
— |
— |
— |
1,985,048 |
1,985,048 |
||||||||||||||
Net unrealized depreciation on investments / foreign currency |
— |
— |
— |
(26,170,244 |
) |
(26,170,244 |
) |
||||||||||||
Provision for taxes |
— |
— |
— |
(435,245 |
) |
(435,245 |
) |
||||||||||||
Return of capital and other tax related adjustments |
— |
— |
(484,037 |
) |
484,037 |
— |
|||||||||||||
Dividends / distributions |
160,948 |
160 |
3,075,393 |
(69,551,607 |
) |
(66,476,054 |
) |
||||||||||||
Public offering of common stock |
6,742,362 |
6,742 |
129,119,482 |
— |
129,126,224 |
||||||||||||||
Issuance of restricted stock |
364,605 |
365 |
(365 |
) |
— |
— |
|||||||||||||
Common stock withheld for payroll taxes upon vesting of restricted stock |
(241,749 |
) |
(241 |
) |
(4,449,322 |
) |
— |
(4,449,563 |
) |
||||||||||
Balance, December 31, 2016 |
40,401,292 |
$ |
40,401 |
$ |
686,835,054 |
$ |
(75,719,197 |
) |
$ |
611,156,258 |
|||||||||
Net investment income |
— |
— |
— |
72,237,817 |
72,237,817 |
||||||||||||||
Stock-based compensation |
— |
— |
6,022,861 |
— |
6,022,861 |
||||||||||||||
Net realized loss on investments / foreign currency |
— |
— |
— |
(51,599,927 |
) |
(51,599,927 |
) |
||||||||||||
Net unrealized depreciation on investments / foreign currency |
— |
— |
— |
(48,416,941 |
) |
(48,416,941 |
) |
||||||||||||
Provision for taxes |
— |
— |
— |
(871,410 |
) |
(871,410 |
) |
||||||||||||
Return of capital and other tax related adjustments |
— |
— |
(689,101 |
) |
689,101 |
— |
|||||||||||||
Dividends / distributions |
91,366 |
91 |
1,637,467 |
(78,706,691 |
) |
(77,069,133 |
) |
||||||||||||
Public offering of common stock |
7,000,000 |
7,000 |
131,989,144 |
— |
131,996,144 |
||||||||||||||
Issuance of restricted stock |
360,470 |
361 |
(361 |
) |
— |
— |
|||||||||||||
Common stock withheld for payroll taxes upon vesting of restricted stock |
(112,296 |
) |
(112 |
) |
(2,180,183 |
) |
— |
(2,180,295 |
) |
||||||||||
Balance, December 31, 2017 |
47,740,832 |
$ |
47,741 |
$ |
823,614,881 |
$ |
(182,387,248 |
) |
$ |
641,275,374 |
|||||||||
Net investment loss |
— |
— |
— |
(60,722 |
) |
(60,722 |
) |
||||||||||||
Stock-based compensation |
— |
— |
14,229,633 |
— |
14,229,633 |
||||||||||||||
Net realized loss on investments / foreign currency |
— |
— |
— |
(158,392,548 |
) |
(158,392,548 |
) |
||||||||||||
Net unrealized appreciation on investments / foreign currency |
— |
— |
— |
53,746,145 |
53,746,145 |
||||||||||||||
Loss on extinguishment of debt |
— |
— |
— |
(10,507,183 |
) |
(10,507,183 |
) |
||||||||||||
Income tax benefit |
— |
— |
— |
932,172 |
932,172 |
||||||||||||||
Return of capital and other tax related adjustments |
— |
— |
5,085,295 |
(5,085,295 |
) |
— |
|||||||||||||
Dividends / distributions |
— |
(850,745 |
) |
(20,223,567 |
) |
(21,074,312 |
) |
||||||||||||
Issuance of shares to Adviser |
8,529,917 |
8,530 |
99,831,315 |
— |
99,839,845 |
||||||||||||||
Purchase of shares in tender offer |
(4,901,961 |
) |
(4,902 |
) |
(50,997,387 |
) |
— |
(51,002,289 |
) |
||||||||||
Issuance of restricted stock |
435,106 |
435 |
(435 |
) |
— |
— |
|||||||||||||
Common stock withheld for payroll taxes upon vesting of restricted stock |
(519,830 |
) |
(520 |
) |
(6,018,308 |
) |
— |
(6,018,828 |
) |
||||||||||
Balance, December 31, 2018 |
51,284,064 |
$ |
51,284 |
$ |
884,894,249 |
$ |
(321,978,246 |
) |
$ |
562,967,287 |
|||||||||
See accompanying notes.
F-7
Barings BDC, Inc.
Consolidated Statements of Cash Flows
Year Ended December 31, |
||||||||||||
2018 |
2017 |
2016 |
||||||||||
Cash flows from operating activities: |
||||||||||||
Net increase (decrease) in net assets resulting from operations |
$ |
(114,282,136 |
) |
$ |
(28,650,461 |
) |
$ |
34,256,432 |
||||
Adjustments to reconcile net increase (decrease) in net assets resulting from operations to net cash used in operating activities: |
||||||||||||
Purchases of portfolio investments |
(1,553,937,707 |
) |
(483,743,398 |
) |
(319,466,966 |
) |
||||||
Repayments received/sales of portfolio investments |
606,803,725 |
403,678,672 |
236,692,865 |
|||||||||
Proceeds from sale of portfolio to Asset Buyer |
793,281,722 |
— |
— |
|||||||||
Purchases of short-term investments |
(1,363,333,538 |
) |
— |
— |
||||||||
Sales of short-term investments |
1,318,109,597 |
— |
— |
|||||||||
Loan origination and other fees received |
4,105,796 |
7,294,015 |
5,813,991 |
|||||||||
Net realized (gains) losses on investments |
159,473,759 |
52,868,703 |
(1,985,048 |
) |
||||||||
Net realized gain on foreign currency borrowings |
(1,081,211 |
) |
(1,268,776 |
) |
— |
|||||||
Net unrealized (appreciation) depreciation on investments |
(53,278,592 |
) |
46,317,189 |
28,951,901 |
||||||||
Net unrealized depreciation on foreign currency borrowings |
863,980 |
2,821,924 |
152,957 |
|||||||||
Payment-in-kind interest accrued, net of payments received |
120,933 |
2,021,987 |
(5,671,705 |
) |
||||||||
Amortization of deferred financing fees |
1,758,226 |
2,514,459 |
2,226,066 |
|||||||||
Loss on extinguishment of debt |
10,507,183 |
— |
— |
|||||||||
Loss on disposal of property and equipment |
22,236 |
— |
— |
|||||||||
Accretion of loan origination and other fees |
(3,306,421 |
) |
(6,337,441 |
) |
(4,568,399 |
) |
||||||
Amortization/accretion of purchased loan premium/discount |
(197,715 |
) |
(476,892 |
) |
(397,104 |
) |
||||||
Accretion of discount on SBA-guaranteed debentures payable |
— |
— |
31,899 |
|||||||||
Depreciation expense |
27,414 |
65,857 |
70,108 |
|||||||||
Stock-based compensation |
14,229,633 |
6,022,861 |
10,331,464 |
|||||||||
Changes in operating assets and liabilities: |
||||||||||||
Interest and fees receivable |
(5,991,755 |
) |
2,382,901 |
(5,297,642 |
) |
|||||||
Prepaid expenses and other assets |
(2,268,881 |
) |
(195,291 |
) |
(712,502 |
) |
||||||
Accounts payable and accrued liabilities |
(6,665,600 |
) |
2,650,212 |
(3,846,693 |
) |
|||||||
Interest payable |
(3,247,955 |
) |
540 |
282,470 |
||||||||
Net cash provided by (used in) operating activities |
(198,287,307 |
) |
7,967,061 |
(23,135,906 |
) |
|||||||
Cash flows from investing activities: |
||||||||||||
Purchases of property and equipment |
— |
(40,512 |
) |
(70,904 |
) |
|||||||
Proceeds from sales of property and equipment |
31,499 |
— |
— |
|||||||||
Net cash used in investing activities |
31,499 |
(40,512 |
) |
(70,904 |
) |
|||||||
Cash flows from financing activities: |
||||||||||||
Borrowings under SBA-guaranteed debentures payable |
— |
— |
32,800,000 |
|||||||||
Repayments of SBA-guaranteed debentures payable |
(250,000,000 |
) |
— |
(7,800,000 |
) |
|||||||
Borrowings under credit facilities |
574,100,000 |
141,700,000 |
104,901,849 |
|||||||||
Repayments of credit facilities |
(159,953,253 |
) |
(114,194,139 |
) |
(109,300,000 |
) |
||||||
Redemption of notes |
(166,750,000 |
) |
— |
— |
||||||||
Financing fees paid |
(308,070 |
) |
(3,417,092 |
) |
(1,123,401 |
) |
||||||
Net proceeds related to issuance of common stock |
99,839,845 |
131,996,144 |
129,126,224 |
|||||||||
Common stock withheld for taxes upon vesting of restricted stock |
(6,018,828 |
) |
(2,180,295 |
) |
(4,449,563 |
) |
||||||
Cash dividends/distributions paid |
(21,074,312 |
) |
(77,069,133 |
) |
(66,476,054 |
) |
||||||
Purchase of common stock in tender offer |
(51,002,289 |
) |
— |
— |
||||||||
Net cash provided by financing activities |
18,833,093 |
76,835,485 |
77,679,055 |
|||||||||
Net increase (decrease) in cash and cash equivalents |
(179,422,715 |
) |
84,762,034 |
54,472,245 |
||||||||
Cash, beginning of year |
191,849,697 |
107,087,663 |
52,615,418 |
|||||||||
Cash, end of year |
$ |
12,426,982 |
$ |
191,849,697 |
$ |
107,087,663 |
||||||
Supplemental disclosure of cash flow information: |
||||||||||||
Cash paid for interest |
$ |
23,630,783 |
$ |
25,587,590 |
$ |
23,366,963 |
||||||
Summary of non-cash financing transactions: |
||||||||||||
Dividends paid through DRIP share issuances |
$ |
— |
$ |
1,637,558 |
$ |
3,075,553 |
||||||
See accompanying notes.
F-8
|
Barings BDC, Inc.
Consolidated Schedule of Investments
December 31, 2018
| ||||||||||||||||
Portfolio Company |
Industry |
Type of Investment(1) (2)
|
Principal
Amount
|
Cost |
Fair
Value
|
|||||||||||
Non–Control / Non–Affiliate Investments: |
||||||||||||||||
24 Hour Fitness Worldwide, Inc. (1.6%)*(4)
|
Leisure Facilities |
First Lien Senior Secured Term Loan (LIBOR + 3.5%, 6.0% Cash, Due 05/25) |
$ |
9,452,500 |
$ |
9,543,878 |
$ |
9,224,033 |
||||||||
9,452,500 |
9,543,878 |
9,224,033 |
||||||||||||||
Accelerate Learning (1.5%)*(5)
|
Education Services |
First Lien Senior Secured Term Loan (LIBOR + 4.5%, 7.0% Cash, Due 12/24) |
8,455,827 |
8,287,632 |
8,234,888 |
|||||||||||
8,455,827 |
8,287,632 |
8,234,888 |
||||||||||||||
Accurus Aerospace (4.3%)*(5)
|
Aerospace & Defense |
First Lien Senior Secured Term Loan (LIBOR + 4.5%, 7.0% Cash, Due 10/24) |
25,000,000 |
24,636,436 |
24,312,943 |
|||||||||||
25,000,000 |
24,636,436 |
24,312,943 |
||||||||||||||
Acrisure, LLC (1.7%)*(4)
|
Property & Casualty Insurance |
First Lien Senior Secured Term Loan (LIBOR + 4.25%, 6.8% Cash, Due 11/23) |
9,949,622 |
10,011,600 |
9,620,091 |
|||||||||||
9,949,622 |
10,011,600 |
9,620,091 |
||||||||||||||
ADMI Corp. (0.6%)*(4)
|
Health Care Services |
First Lien Senior Secured Term Loan (LIBOR + 3.0%, 5.5% Cash, Due 04/25) |
3,482,500 |
3,495,133 |
3,302,559 |
|||||||||||
3,482,500 |
3,495,133 |
3,302,559 |
||||||||||||||
AlixPartners LLP (1.4%)*(4)
|
Investment Banking & Brokerage |
First Lien Senior Secured Term Loan (LIBOR + 2.75%, 5.3% Cash, Due 04/24) |
8,058,987 |
8,103,759 |
7,725,104 |
|||||||||||
8,058,987 |
8,103,759 |
7,725,104 |
||||||||||||||
Alliant Holdings LP (0.8%)*(4)
|
Property & Casualty Insurance |
First Lien Senior Secured Term Loan (LIBOR + 2.75%, 5.2% Cash, Due 05/25) |
4,972,506 |
4,980,447 |
4,689,372 |
|||||||||||
4,972,506 |
4,980,447 |
4,689,372 |
||||||||||||||
American Airlines Group Inc. (2.3%)*(3) (4)
|
Airport Services |
First Lien Senior Secured Term Loan (LIBOR + 1.75%, 4.3% Cash, Due 06/25) |
13,985,519 |
13,734,123 |
13,058,978 |
|||||||||||
13,985,519 |
13,734,123 |
13,058,978 |
||||||||||||||
American Dental Partners, Inc. (1.7%)* |
Health Care Services |
First Lien Senior Secured Term Loan (LIBOR + 4.25%, 7.1% Cash, Due 03/23) |
10,000,000 |
9,975,555 |
9,850,000 |
|||||||||||
10,000,000 |
9,975,555 |
9,850,000 |
||||||||||||||
Amscan Holdings Inc. (0.4%)*(3) (4)
|
Specialty Stores |
First Lien Senior Secured Term Loan (LIBOR + 2.75%, 5.0% Cash, Due 08/22) |
2,411,098 |
2,428,340 |
2,321,694 |
|||||||||||
2,411,098 |
2,428,340 |
2,321,694 |
||||||||||||||
Apex Tool Group, LLC (1.3%)*(4)
|
Industrial Machinery |
First Lien Senior Secured Term Loan (LIBOR + 3.75%, 6.3% Cash, Due 02/22) |
7,335,300 |
7,364,994 |
7,056,558 |
|||||||||||
7,335,300 |
7,364,994 |
7,056,558 |
||||||||||||||
Applied Systems Inc. (1.6%)*(4)
|
Application Software |
First Lien Senior Secured Term Loan (LIBOR + 3.0%, 5.5% Cash, Due 09/24) |
9,313,068 |
9,380,593 |
8,855,144 |
|||||||||||
9,313,068 |
9,380,593 |
8,855,144 |
||||||||||||||
Ascend Learning, LLC (1.3%)*(4)
|
IT Consulting & Other Services |
First Lien Senior Secured Term Loan (LIBOR + 3.0%, 5.5% Cash, Due 07/24) |
7,959,698 |
7,981,529 |
7,502,015 |
|||||||||||
7,959,698 |
7,981,529 |
7,502,015 |
||||||||||||||
AssuredPartners Capital, Inc. (2.0%)*(4)
|
Property & Casualty Insurance |
First Lien Senior Secured Term Loan (LIBOR + 3.25%, 5.8% Cash, Due 10/24) |
11,951,703 |
11,975,322 |
11,257,070 |
|||||||||||
11,951,703 |
11,975,322 |
11,257,070 |
||||||||||||||
Aveanna Healthcare Holdings, Inc. (f/k/a BCPE Eagle Buyer LLC) (0.7%)*(4) (5)
|
Health Care Facilities |
First Lien Senior Secured Term Loan (LIBOR + 4.25%, 6.8% Cash, Due 03/24) |
1,488,712 |
1,469,694 |
1,384,502 |
|||||||||||
First Lien Senior Secured Term Loan (LIBOR + 5.5%, 8.0% Cash, Due 03/24) |
2,751,801 |
2,752,766 |
2,641,729 |
|||||||||||||
4,240,513 |
4,222,460 |
4,026,231 |
||||||||||||||
AVSC Holding Corp. (1.3%)*(4)
|
Advertising |
First Lien Senior Secured Term Loan (LIBOR + 3.25%, 5.9% Cash, Due 03/25) |
7,959,900 |
7,917,296 |
7,522,105 |
|||||||||||
7,959,900 |
7,917,296 |
7,522,105 |
||||||||||||||
F-9
|
Barings BDC, Inc.
Consolidated Schedule of Investments — (Continued)
December 31, 2018
| ||||||||||||||||
Portfolio Company |
Industry |
Type of Investment(1) (2)
|
Principal
Amount
|
Cost |
Fair
Value
|
|||||||||||
Bausch Health Companies Inc. (1.5%)*(3) (4)
|
Health Care Services |
First Lien Senior Secured Term Loan (LIBOR + 3.0%, 5.4% Cash, Due 05/25) |
$ |
8,820,910 |
$ |
8,866,316 |
$ |
8,406,856 |
||||||||
8,820,910 |
8,866,316 |
8,406,856 |
||||||||||||||
BDP International, Inc. (4.3%)*(5)
|
Air Freight & Logistics |
First Lien Senior Secured Term Loan (LIBOR + 5.25%, 8.1% Cash, Due 12/24) |
25,000,000 |
24,502,972 |
24,347,685 |
|||||||||||
25,000,000 |
24,502,972 |
24,347,685 |
||||||||||||||
Berlin Packaging LLC (1.4%)*(4)
|
Forest Products /Containers |
First Lien Senior Secured Term Loan (LIBOR + 3.0%, 5.4% Cash, Due 11/25) |
8,457,500 |
8,477,268 |
7,944,045 |
|||||||||||
8,457,500 |
8,477,268 |
7,944,045 |
||||||||||||||
Blackhawk Network Holdings Inc (1.7%)*(4)
|
Data Processing & Outsourced Services |
First Lien Senior Secured Term Loan (LIBOR + 3.0%, 5.5% Cash, Due 06/25) |
9,974,937 |
9,974,937 |
9,470,006 |
|||||||||||
9,974,937 |
9,974,937 |
9,470,006 |
||||||||||||||
Brookfield WEC Holdings Inc. (0.1%)*(4)
|
Construction & Engineering |
First Lien Senior Secured Term Loan (LIBOR + 3.75%, 6.3% Cash, Due 08/25) |
500,000 |
504,904 |
483,305 |
|||||||||||
500,000 |
504,904 |
483,305 |
||||||||||||||
Brown Machine LLC (1.0%)*(5)
|
Industrial equipment |
First Lien Senior Secured Term Loan (LIBOR + 5.25%, 7.8% Cash, Due 10/24) |
5,568,910 |
5,502,125 |
5,431,063 |
|||||||||||
5,568,910 |
5,502,125 |
5,431,063 |
||||||||||||||
Cadent (fka Cross MediaWorks) (1.4%)*(5)
|
Media & Entertainment |
First Lien Senior Secured Term Loan (LIBOR + 5.5%, 7.7% Cash, Due 09/23) |
7,966,133 |
7,891,122 |
7,793,161 |
|||||||||||
7,966,133 |
7,891,122 |
7,793,161 |
||||||||||||||
Caesars Entertainment Corp. (0.5%)*(3) (4)
|
Casinos & Gaming |
First Lien Senior Secured Term Loan (LIBOR + 2.75%, 5.3% Cash, Due 12/24) |
3,134,171 |
3,153,038 |
3,004,322 |
|||||||||||
3,134,171 |
3,153,038 |
3,004,322 |
||||||||||||||
Callaway Golf Co. (0.6%)*(3) (4)
|
Leisure Products |
First Lien Senior Secured Term Loan (LIBOR + 4.5%, 7.3% Cash, Due 12/25) |
3,266,060 |
3,200,739 |
3,225,234 |
|||||||||||
3,266,060 |
3,200,739 |
3,225,234 |
||||||||||||||
Calpine Corp. (0.8%)*(4)
|
Independent Power Producers & Energy Traders |
First Lien Senior Secured Term Loan7 (LIBOR + 2.5%, 5.3% Cash, Due 05/23) |
129,118 |
129,583 |
122,379 |
|||||||||||
First Lien Senior Secured Term Loan5 (LIBOR + 2.5%, 5.3% Cash, Due 01/24) |
4,497,510 |
4,513,817 |
4,264,899 |
|||||||||||||
4,626,628 |
4,643,400 |
4,387,278 |
||||||||||||||
Capital Automotive LLC (2.0%)*(4)
|
Automotive Retail |
First Lien Senior Secured Term Loan (LIBOR + 2.5%, 5.0% Cash, Due 03/24) |
11,939,394 |
11,966,567 |
11,443,909 |
|||||||||||
11,939,394 |
11,966,567 |
11,443,909 |
||||||||||||||
Carlyle Group L.P., (The) (f/k/a Nautilus Power, LLC) (0.6%)*(4) |
Independent Power Producers & Energy Traders |
First Lien Senior Secured Term Loan (LIBOR + 4.25%, 6.8% Cash, Due 05/24) |
3,487,410 |
3,504,691 |
3,434,227 |
|||||||||||
3,487,410 |
3,504,691 |
3,434,227 |
||||||||||||||
Charter Communications Inc. (0.8%)*(3) (4)
|
Cable & Satellite |
First Lien Senior Secured Term Loan (LIBOR + 2.0%, 4.5% Cash, Due 04/25) |
4,585,127 |
4,493,899 |
4,385,124 |
|||||||||||
4,585,127 |
4,493,899 |
4,385,124 |
||||||||||||||
Concentra Inc. (0.5%)*(4)
|
Health Care Services |
First Lien Senior Secured Term Loan (LIBOR + 2.75%, 5.1% Cash, Due 06/22) |
3,000,000 |
3,028,601 |
2,865,000 |
|||||||||||
3,000,000 |
3,028,601 |
2,865,000 |
||||||||||||||
Consolidated Container Co. LLC (1.3%)*(4)
|
Metal & Glass Containers |
First Lien Senior Secured Term Loan (LIBOR + 2.75%, 5.3% Cash, Due 05/24) |
7,462,312 |
7,485,496 |
7,114,045 |
|||||||||||
7,462,312 |
7,485,496 |
7,114,045 |
||||||||||||||
Container Store Group, Inc., (The) (0.5%)* (3) (4) (5)
|
Retail |
First Lien Senior Secured Term Loan (LIBOR + 5.0%, 7.5% Cash, Due 09/23) |
3,124,404 |
3,126,010 |
2,858,830 |
|||||||||||
3,124,404 |
3,126,010 |
2,858,830 |
||||||||||||||
Core & Main LP (1.7%)*(4)
|
Building Products |
First Lien Senior Secured Term Loan (LIBOR + 3.0%, 5.7% Cash, Due 08/24) |
9,974,811 |
10,022,554 |
9,617,414 |
|||||||||||
9,974,811 |
10,022,554 |
9,617,414 |
||||||||||||||
F-10
|
Barings BDC, Inc.
Consolidated Schedule of Investments — (Continued)
December 31, 2018
| ||||||||||||||||
Portfolio Company |
Industry |
Type of Investment(1) (2)
|
Principal
Amount
|
Cost |
Fair
Value
|
|||||||||||
Covia Holdings Corporation (Unimin Corporation) (0.3%)*(3) (4)
|
Diversified Metals & Mining |
First Lien Senior Secured Term Loan (LIBOR + 3.75%, 6.6% Cash, Due 06/25) |
$ |
2,435,500 |
$ |
2,444,146 |
$ |
1,753,560 |
||||||||
2,435,500 |
2,444,146 |
1,753,560 |
||||||||||||||
CPG Intermediate LLC (f/k/a Encapsys, LLC) (0.4%)* |
Specialty Chemicals |
First Lien Senior Secured Term Loan (LIBOR + 3.25%, 6.0% Cash, Due 11/24) |
2,172,331 |
2,174,889 |
2,108,964 |
|||||||||||
2,172,331 |
2,174,889 |
2,108,964 |
||||||||||||||
CPI International Inc. (0.8%)*(4)
|
Electronic Components |
First Lien Senior Secured Term Loan (LIBOR + 3.5%, 6.0% Cash, Due 07/24) |
4,795,633 |
4,803,762 |
4,631,766 |
|||||||||||
4,795,633 |
4,803,762 |
4,631,766 |
||||||||||||||
CVS Holdings I, LP (MyEyeDr) (0.3%)*(4)
|
Health Care Supplies |
First Lien Senior Secured Term Loan (LIBOR + 3.0%, 5.3% Cash, Due 02/25) |
1,953,701 |
1,952,568 |
1,846,248 |
|||||||||||
1,953,701 |
1,952,568 |
1,846,248 |
||||||||||||||
Dimora Brands, Inc. (0.5%)* |
Building Products |
First Lien Senior Secured Term Loan (LIBOR + 3.5%, 6.0% Cash, Due 08/24) |
2,984,887 |
2,988,439 |
2,839,373 |
|||||||||||
2,984,887 |
2,988,439 |
2,839,373 |
||||||||||||||
Dole Food Co. Inc. (2.4%)* (4)
|
Packaged Foods & Meats |
First Lien Senior Secured Term Loan (LIBOR + 2.75%, 5.3% Cash, Due 04/24) |
13,919,794 |
13,927,211 |
13,484,800 |
|||||||||||
13,919,794 |
13,927,211 |
13,484,800 |
||||||||||||||
Dresser Natural Gas Solutions (2.1%)*(5)
|
Natural Gas |
First Lien Senior Secured Term Loan (LIBOR + 4.25%, 6.8% Cash, Due 10/25) |
12,115,385 |
12,056,896 |
11,903,574 |
|||||||||||
12,115,385 |
12,056,896 |
11,903,574 |
||||||||||||||
Duff & Phelps Corporation (2.2%)*(4)
|
Research & Consulting Services |
First Lien Senior Secured Term Loan (LIBOR + 3.25%, 5.8% Cash, Due 02/25) |
13,341,288 |
13,378,119 |
12,593,642 |
|||||||||||
13,341,288 |
13,378,119 |
12,593,642 |
||||||||||||||
Edelman Financial Group, Inc. (1.8%)*(4)
|
Investment Banking & Brokerage |
First Lien Senior Secured Term Loan (LIBOR + 3.25%, 5.7% Cash, Due 07/25) |
10,486,000 |
10,569,223 |
10,074,005 |
|||||||||||
10,486,000 |
10,569,223 |
10,074,005 |
||||||||||||||
Endo International PLC (1.3%)*(3) (4)
|
Pharmaceuticals |
First Lien Senior Secured Term Loan (LIBOR + 4.25%, 6.8% Cash, Due 04/24) |
7,959,596 |
8,032,969 |
7,521,818 |
|||||||||||
7,959,596 |
8,032,969 |
7,521,818 |
||||||||||||||
Equian Buyer Corp. (0.6%)*(4)
|
Health Care Services |
First Lien Senior Secured Term Loan (LIBOR + 3.25%, 5.8% Cash, Due 05/24) |
3,482,323 |
3,488,194 |
3,358,701 |
|||||||||||
3,482,323 |
3,488,194 |
3,358,701 |
||||||||||||||
Exelon Corp. (0.5%)*(3) (4)
|
Electric Utilities |
First Lien Senior Secured Term Loan (LIBOR + 3.0%, 5.7% Cash, Due 11/24) |
3,000,000 |
3,028,710 |
2,835,000 |
|||||||||||
3,000,000 |
3,028,710 |
2,835,000 |
||||||||||||||
Eyemart Express (0.6%)*(4)
|
Retail |
First Lien Senior Secured Term Loan (LIBOR + 3.0%, 5.5% Cash, Due 08/24) |
3,478,637 |
3,490,449 |
3,365,581 |
|||||||||||
3,478,637 |
3,490,449 |
3,365,581 |
||||||||||||||
Fieldwood Energy LLC (1.7%)*(4)
|
Oil & Gas Equipment & Services |
First Lien Senior Secured Term Loan (LIBOR + 5.25%, 7.8% Cash, Due 04/22) |
10,000,000 |
10,091,054 |
9,318,800 |
|||||||||||
10,000,000 |
10,091,054 |
9,318,800 |
||||||||||||||
Filtration Group Corporation (1.9%)*(4)
|
Industrial Machinery |
First Lien Senior Secured Term Loan (LIBOR + 3.0%, 5.5% Cash, Due 03/25) |
10,944,862 |
11,032,278 |
10,525,346 |
|||||||||||
10,944,862 |
11,032,278 |
10,525,346 |
||||||||||||||
Flex Acquisition Holdings, Inc. (1.7%)*(4)
|
Paper Packaging |
First Lien Senior Secured Term Loan (LIBOR + 3.25%, 5.6% Cash, Due 06/25) |
9,972,500 |
9,993,054 |
9,419,026 |
|||||||||||
9,972,500 |
9,993,054 |
9,419,026 |
||||||||||||||
Gardner Denver Inc. (0.3%)*(3) (4)
|
Industrial Machinery |
First Lien Senior Secured Term Loan (LIBOR + 2.75%, 5.3% Cash, Due 07/24) |
1,682,557 |
1,694,790 |
1,621,043 |
|||||||||||
1,682,557 |
1,694,790 |
1,621,043 |
||||||||||||||
F-11
|
Barings BDC, Inc.
Consolidated Schedule of Investments — (Continued)
December 31, 2018
| ||||||||||||||||
Portfolio Company |
Industry |
Type of Investment(1) (2)
|
Principal
Amount
|
Cost |
Fair
Value
|
|||||||||||
GlobalTranz (0.5%)*(5)
|
Transportation Services |
Second Lien Senior Secured Term Loan (LIBOR + 8.0%, 10.5% Cash, Due 10/26) |
$ |
2,980,874 |
$ |
2,937,205 |
$ |
2,900,969 |
||||||||
2,980,874 |
2,937,205 |
2,900,969 |
||||||||||||||
GMS Inc. (1.2%)*(3) (4)
|
Construction & Engineering |
First Lien Senior Secured Term Loan (LIBOR + 2.75%, 5.3% Cash, Due 06/25) |
7,481,203 |
7,440,285 |
7,032,331 |
|||||||||||
7,481,203 |
7,440,285 |
7,032,331 |
||||||||||||||
Graftech International Ltd. (1.8%)*(3) (4) (5)
|
Specialty Chemicals |
First Lien Senior Secured Term Loan (LIBOR + 3.5%, 6.0% Cash, Due 02/25) |
10,725,000 |
10,812,431 |
10,135,125 |
|||||||||||
10,725,000 |
10,812,431 |
10,135,125 |
||||||||||||||
Gray Television Inc. (0.1)*(3) (4)
|
Broadcasting |
First Lien Senior Secured Term Loan (LIBOR + 2.25%, 4.6% Cash, Due 02/24) |
655,812 |
641,096 |
627,940 |
|||||||||||
655,812 |
641,096 |
627,940 |
||||||||||||||
Gulf Finance, LLC (0.1)*(4)
|
Oil & Gas Exploration & Production |
First Lien Senior Secured Term Loan (LIBOR + 5.25%, 7.9% Cash, Due 08/23) |
1,069,652 |
900,943 |
811,598 |
|||||||||||
1,069,652 |
900,943 |
811,598 |
||||||||||||||
Hanley Wood LLC (2.2%)*(5)
|
Advertising |
First Lien Senior Secured Term Loan (LIBOR + 6.25%, 9.0% Cash, Due 12/24) |
12,500,000 |
12,190,695 |
12,375,000 |
|||||||||||
12,500,000 |
12,190,695 |
12,375,000 |
||||||||||||||
Harbor Freight Tools USA Inc.(1.0%)*(4)
|
Specialty Stores |
First Lien Senior Secured Term Loan (LIBOR + 2.5%, 5.0% Cash, Due 08/23) |
5,994,942 |
5,934,386 |
5,640,880 |
|||||||||||
5,994,942 |
5,934,386 |
5,640,880 |
||||||||||||||
Hayward Industries, Inc. (1.4%)*(4)
|
Leisure Products |
First Lien Senior Secured Term Loan (LIBOR + 3.5%, 6.0% Cash, Due 08/24) |
8,457,179 |
8,488,506 |
8,115,340 |
|||||||||||
8,457,179 |
8,488,506 |
8,115,340 |
||||||||||||||
Healthline Media, Inc (2.2%)*(5)
|
Healthcare |
First Lien Senior Secured Term Loan (LIBOR + 4.75%, 7.6% Cash, Due 11/24) |
12,840,895 |
12,588,998 |
12,434,145 |
|||||||||||
12,840,895 |
12,588,998 |
12,434,145 |
||||||||||||||
Hertz Corporation (The) (1.0%)*(3) (4)
|
Rental & Leasing Services |
First Lien Senior Secured Term Loan (LIBOR + 2.75%, 5.3% Cash, Due 06/23) |
5,938,303 |
5,927,654 |
5,696,555 |
|||||||||||
5,938,303 |
5,927,654 |
5,696,555 |
||||||||||||||
Holley Performance Products (Holley Purchaser, Inc.) (3.9%)*(5)
|
Packaging |
First Lien Senior Secured Term Loan (LIBOR + 5.0%, 7.5% Cash, Due 10/25) |
22,535,000 |
22,204,286 |
21,971,625 |
|||||||||||
22,535,000 |
22,204,286 |
21,971,625 |
||||||||||||||
Hub International Limited (1.7%)*(4)
|
Property & Casualty Insurance |
First Lien Senior Secured Term Loan (LIBOR + 2.75%, 5.2% Cash, Due 04/25) |
10,333,075 |
10,347,614 |
9,735,720 |
|||||||||||
10,333,075 |
10,347,614 |
9,735,720 |
||||||||||||||
Husky Injection Molding Systems Ltd. (1.7%)*(3) (4)
|
Industrial Machinery |
First Lien Senior Secured Term Loan (LIBOR + 3.0%, 5.5% Cash, Due 03/25) |
10,790,581 |
10,369,552 |
9,841,873 |
|||||||||||
10,790,581 |
10,369,552 |
9,841,873 |
||||||||||||||
Hyland Software Inc. (1.5%)*(4)
|
Technology Distributors |
First Lien Senior Secured Term Loan (LIBOR + 3.5%, 6.0% Cash, Due 07/24) |
8,715,134 |
8,776,016 |
8,427,535 |
|||||||||||
8,715,134 |
8,776,016 |
8,427,535 |
||||||||||||||
Immucor Inc. (0.4%)*(4)
|
Healthcare |
First Lien Senior Secured Term Loan (LIBOR + 5.0%, 7.8% Cash, Due 06/21) |
2,491,354 |
2,524,676 |
2,444,641 |
|||||||||||
2,491,354 |
2,524,676 |
2,444,641 |
||||||||||||||
Infor Software Parent, LLC (1.4%)*(4)
|
Systems Software |
First Lien Senior Secured Term Loan (LIBOR + 2.75%, 5.3% Cash, Due 02/22) |
8,000,000 |
8,012,613 |
7,653,760 |
|||||||||||
8,000,000 |
8,012,613 |
7,653,760 |
||||||||||||||
Intelsat S.A. (2.2%)*(3) (4)
|
Broadcasting |
First Lien Senior Secured Term Loan (LIBOR + 3.75%, 6.3% Cash, Due 11/23) |
13,000,000 |
13,079,847 |
12,558,910 |
|||||||||||
13,000,000 |
13,079,847 |
12,558,910 |
||||||||||||||
ION Trading Technologies Ltd. (2.5%)*(4) (5)
|
Electrical Components & Equipment |
First Lien Senior Secured Term Loan (LIBOR + 4.0%, 6.5% Cash, Due 11/24) |
14,819,339 |
14,786,308 |
13,967,227 |
|||||||||||
14,819,339 |
14,786,308 |
13,967,227 |
||||||||||||||
F-12
|
Barings BDC, Inc.
Consolidated Schedule of Investments — (Continued)
December 31, 2018
| ||||||||||||||||
Portfolio Company |
Industry |
Type of Investment(1) (2)
|
Principal
Amount
|
Cost |
Fair
Value
|
|||||||||||
IRB Holding Corporation (1.3%)*(4)
|
Food Retail |
First Lien Senior Secured Term Loan (LIBOR + 3.25%, 5.7% Cash, Due 02/25) |
$ |
7,969,854 |
$ |
7,989,532 |
$ |
7,583,316 |
||||||||
7,969,854 |
7,989,532 |
7,583,316 |
||||||||||||||
Jaguar Holding Company I (0.8%)*(4)
|
Life Sciences Tools & Services |
First Lien Senior Secured Term Loan (LIBOR + 2.5%, 5.0% Cash, Due 08/22) |
4,974,227 |
4,975,425 |
4,713,080 |
|||||||||||
4,974,227 |
4,975,425 |
4,713,080 |
||||||||||||||
JS Held, LLC (3.1%)*(5)
|
Property & Casualty Insurance |
First Lien Senior Secured Term Loan (LIBOR + 4.5%, 7.3% Cash, Due 09/24) |
17,593,912 |
17,403,946 |
17,179,827 |
|||||||||||
17,593,912 |
17,403,946 |
17,179,827 |
||||||||||||||
Kenan Advantage Group Inc. (1.4%)*(4)
|
Trucking |
First Lien Senior Secured Term Loan (LIBOR + 3.0%, 5.5% Cash, Due 07/22) |
8,449,929 |
8,442,949 |
8,138,380 |
|||||||||||
8,449,929 |
8,442,949 |
8,138,380 |
||||||||||||||
K-Mac Holdings Corp (0.6%)*(4)
|
Restaurants |
First Lien Senior Secured Term Loan (LIBOR + 3.25%, 5.8% Cash, Due 03/25) |
3,482,456 |
3,492,379 |
3,310,527 |
|||||||||||
3,482,456 |
3,492,379 |
3,310,527 |
||||||||||||||
Kronos Inc. (1.9%)*(4)
|
Application Software |
First Lien Senior Secured Term Loan (LIBOR + 3.0%, 5.5% Cash, Due 11/23) |
11,505,463 |
11,551,608 |
10,910,976 |
|||||||||||
11,505,463 |
11,551,608 |
10,910,976 |
||||||||||||||
Lighthouse Autism Center (1.1%)*(5)
|
Healthcare and Pharmaceuticals |
First Lien Senior Secured Term Loan (LIBOR + 5.75%, 8.1% Cash, Due 09/24) |
6,157,408 |
5,891,621 |
5,817,408 |
|||||||||||
Class A LLC Units (154,320 units) |
154,320 |
154,320 |
||||||||||||||
6,157,408 |
6,045,941 |
5,971,728 |
||||||||||||||
Lindstrom (Metric Enterprises, Inc.) (1.2%)*(5)
|
Capital Equipment |
First Lien Senior Secured Term Loan (LIBOR + 4.5%, 7.0% Cash, Due 09/24) |
7,023,012 |
6,972,814 |
6,885,353 |
|||||||||||
7,023,012 |
6,972,814 |
6,885,353 |
||||||||||||||
LTI Holdings, Inc. (2.0%)*(4)
|
Industrial Conglomerates |
First Lien Senior Secured Term Loan (LIBOR + 3.5%, 6.0% Cash, Due 09/25) |
11,970,000 |
12,035,076 |
11,241,865 |
|||||||||||
11,970,000 |
12,035,076 |
11,241,865 |
||||||||||||||
Mallinckrodt Plc (1.9%)*(3) (4)
|
Health Care Services |
First Lien Senior Secured Term Loan (LIBOR + 2.75%, 5.6% Cash, Due 09/24) |
11,753,810 |
11,679,642 |
10,754,736 |
|||||||||||
11,753,810 |
11,679,642 |
10,754,736 |
||||||||||||||
Men's Wearhouse, Inc. (The) (1.7%)*(3) (4)
|
Apparel Retail |
First Lien Senior Secured Term Loan (LIBOR + 3.25%, 5.6% Cash, Due 04/25) |
9,974,874 |
10,073,027 |
9,588,348 |
|||||||||||
9,974,874 |
10,073,027 |
9,588,348 |
||||||||||||||
Micro Holding Corp. (1.8%)* |
Internet Software & Services |
First Lien Senior Secured Term Loan (LIBOR + 3.25%, 5.8% Cash, Due 12/24) (5)
|
2,712,876 |
2,725,787 |
2,590,796 |
|||||||||||
First Lien Senior Secured Term Loan (LIBOR + 3.75%, 6.3% Cash, Due 09/24) (4)
|
7,959,698 |
8,017,449 |
7,531,864 |
|||||||||||||
10,672,574 |
10,743,236 |
10,122,660 |
||||||||||||||
NFP Corp. (1.4%)*(4)
|
Specialized Finance |
First Lien Senior Secured Term Loan (LIBOR + 3.0%, 5.5% Cash, Due 01/24) |
8,630,128 |
8,628,301 |
8,144,684 |
|||||||||||
8,630,128 |
8,628,301 |
8,144,684 |
||||||||||||||
NVA Holdings, Inc. (1.3%)*(4)
|
Health Care Facilities |
First Lien Senior Secured Term Loan (LIBOR + 2.75%, 5.3% Cash, Due 02/25) |
7,916,170 |
7,900,214 |
7,441,200 |
|||||||||||
7,916,170 |
7,900,214 |
7,441,200 |
||||||||||||||
Omaha Holdings LLC (1.7%)*(4)
|
Auto Parts & Equipment |
First Lien Senior Secured Term Loan (LIBOR + 2.75%, 5.3% Cash, Due 03/24) |
9,949,622 |
10,021,886 |
9,430,351 |
|||||||||||
9,949,622 |
10,021,886 |
9,430,351 |
||||||||||||||
Omnitracs, LLC.(1.4%)*(4)
|
Application Software |
First Lien Senior Secured Term Loan (LIBOR + 2.75%, 5.6% Cash, Due 03/25) |
8,435,312 |
8,407,343 |
7,933,411 |
|||||||||||
8,435,312 |
8,407,343 |
7,933,411 |
||||||||||||||
Ortho-Clinical Diagnostics Bermuda Co. Ltd. (1.9%)*(4)
|
Health Care Services |
First Lien Senior Secured Term Loan (LIBOR + 3.25%, 5.8% Cash, Due 06/25) |
11,520,080 |
11,524,382 |
10,659,645 |
|||||||||||
11,520,080 |
11,524,382 |
10,659,645 |
||||||||||||||
F-13
|
Barings BDC, Inc.
Consolidated Schedule of Investments — (Continued)
December 31, 2018
| ||||||||||||||||
Portfolio Company |
Industry |
Type of Investment(1) (2)
|
Principal
Amount
|
Cost |
Fair
Value
|
|||||||||||
PAREXEL International Corp. (1.2%)*(4)
|
Pharmaceuticals |
First Lien Senior Secured Term Loan (LIBOR + 2.75%, 5.3% Cash, Due 09/24) |
$ |
7,470,248 |
$ |
7,436,079 |
$ |
6,732,561 |
||||||||
7,470,248 |
7,436,079 |
6,732,561 |
||||||||||||||
Penn Engineering & Manufacturing Corp. (0.3%)*(4)
|
Industrial Conglomerates |
First Lien Senior Secured Term Loan (LIBOR + 2.75%, 5.3% Cash, Due 06/24) |
1,989,899 |
2,006,604 |
1,916,929 |
|||||||||||
1,989,899 |
2,006,604 |
1,916,929 |
||||||||||||||
Phoenix Services International LLC (0.5%)*(4)
|
Steel |
First Lien Senior Secured Term Loan (LIBOR + 3.75%, 6.1% Cash, Due 03/25) |
2,984,962 |
2,996,845 |
2,868,042 |
|||||||||||
2,984,962 |
2,996,845 |
2,868,042 |
||||||||||||||
PMHC II, Inc. (0.1%)* |
Diversified Chemicals |
First Lien Senior Secured Term Loan (LIBOR + 3.5%, 6.2% Cash, Due 03/25) |
621,867 |
625,543 |
565,899 |
|||||||||||
621,867 |
625,543 |
565,899 |
||||||||||||||
PODS Enterprises, Inc. (1.4%)*(4)
|
Packaging |
First Lien Senior Secured Term Loan (LIBOR + 2.75%, 5.2% Cash, Due 12/24) |
7,959,712 |
7,985,095 |
7,608,132 |
|||||||||||
7,959,712 |
7,985,095 |
7,608,132 |
||||||||||||||
Prime Security Services Borrower, LLC (2.1%)*(3) (4)
|
Security & Alarm Services |
First Lien Senior Secured Term Loan (LIBOR + 2.75%, 5.3% Cash, Due 05/22) |
12,593,945 |
12,633,406 |
11,976,842 |
|||||||||||
12,593,945 |
12,633,406 |
11,976,842 |
||||||||||||||
Pro Mach Inc. (1.0%)*(4)
|
Industrial Machinery |
First Lien Senior Secured Term Loan (LIBOR + 3.0%, 5.4% Cash, Due 03/25) |
5,969,925 |
5,950,852 |
5,659,011 |
|||||||||||
5,969,925 |
5,950,852 |
5,659,011 |
||||||||||||||
ProAmpac Intermediate Inc. (1.7%)*(4)
|
Packaged Foods & Meats |
First Lien Senior Secured Term Loan (LIBOR + 3.5%, 6.0% Cash, Due 11/23) |
9,947,995 |
9,962,292 |
9,475,466 |
|||||||||||
9,947,995 |
9,962,292 |
9,475,466 |
||||||||||||||
Qlik Technologies Inc. (Alpha Intermediate Holding, Inc.) (1.3%)*(4)
|
Application Software |
First Lien Senior Secured Term Loan (LIBOR + 3.5%, 5.9% Cash, Due 04/24) |
7,436,794 |
7,443,394 |
7,139,322 |
|||||||||||
7,436,794 |
7,443,394 |
7,139,322 |
||||||||||||||
Red Ventures, LLC (1.9%)*(4)
|
Advertising |
First Lien Senior Secured Term Loan (LIBOR + 3.0%, 5.5% Cash, Due 11/24) |
10,966,554 |
11,103,689 |
10,418,227 |
|||||||||||
10,966,554 |
11,103,689 |
10,418,227 |
||||||||||||||
RedPrairie Holding, Inc (1.7%)*(4)
|
Computer Storage & Peripherals |
First Lien Senior Secured Term Loan (LIBOR + 2.75%, 5.3% Cash, Due 10/23) |
9,949,239 |
10,022,004 |
9,564,203 |
|||||||||||
9,949,239 |
10,022,004 |
9,564,203 |
||||||||||||||
Renaissance Learning, Inc. (0.9%)*(4)
|
Application Software |
First Lien Senior Secured Term Loan (LIBOR + 3.25%, 5.8% Cash, Due 05/25) |
5,446,052 |
5,441,904 |
5,041,029 |
|||||||||||
5,446,052 |
5,441,904 |
5,041,029 |
||||||||||||||
Reynolds Group Holdings Ltd. (2.6%)*(4)
|
Packaging |
First Lien Senior Secured Term Loan (LIBOR + 2.75%, 5.3% Cash, Due 02/23) |
15,421,320 |
15,498,970 |
14,650,254 |
|||||||||||
15,421,320 |
15,498,970 |
14,650,254 |
||||||||||||||
Sabre Holdings Corp (0.2%)*(4)
|
Data Processing & Outsourced Services |
First Lien Senior Secured Term Loan (LIBOR + 2.0%, 4.5% Cash, Due 02/24) |
914,018 |
895,738 |
882,786 |
|||||||||||
914,018 |
895,738 |
882,786 |
||||||||||||||
SCI Packaging Inc. (f/k/a BWAY Holding Company) (2.3%)*(4)
|
Metal & Glass Containers |
First Lien Senior Secured Term Loan (LIBOR + 3.25%, 5.7% Cash, Due 04/24) |
13,929,293 |
13,906,708 |
13,070,274 |
|||||||||||
13,929,293 |
13,906,708 |
13,070,274 |
||||||||||||||
Seadrill Ltd. (1.4%)*(4)
|
Oil & Gas Equipment & Services |
First Lien Senior Secured Term Loan (LIBOR + 6.0%, 8.8% Cash, Due 02/21) |
9,918,283 |
9,372,499 |
7,742,509 |
|||||||||||
9,918,283 |
9,372,499 |
7,742,509 |
||||||||||||||
Seaworld Entertainment, Inc. (1.4%)*(3) (4)
|
Leisure Facilities |
First Lien Senior Secured Term Loan (LIBOR + 3.0%, 5.5% Cash, Due 03/24) |
8,456,962 |
8,446,134 |
8,055,256 |
|||||||||||
8,456,962 |
8,446,134 |
8,055,256 |
||||||||||||||
Serta Simmons Bedding LLC (0.4%)*(4)
|
Home Furnishings |
First Lien Senior Secured Term Loan (LIBOR + 3.5%, 5.9% Cash, Due 11/23) |
2,992,386 |
2,704,234 |
2,493,645 |
|||||||||||
2,992,386 |
2,704,234 |
2,493,645 |
||||||||||||||
F-14
|
Barings BDC, Inc.
Consolidated Schedule of Investments — (Continued)
December 31, 2018
| ||||||||||||||||
Portfolio Company |
Industry |
Type of Investment(1) (2)
|
Principal
Amount
|
Cost |
Fair
Value
|
|||||||||||
SIWF Holdings, Inc. (f/k/a Springs Industries Inc.) (1.6%)*(4)
|
Home Furnishings |
First Lien Senior Secured Term Loan (LIBOR + 4.25%, 6.7% Cash, Due 06/25) |
$ |
9,445,430 |
$ |
9,507,419 |
$ |
9,156,211 |
||||||||
9,445,430 |
9,507,419 |
9,156,211 |
||||||||||||||
SK Blue Holdings, LP (0.7%)*(4) (5)
|
Commodity Chemicals |
First Lien Senior Secured Term Loan (LIBOR + 4.75%, 7.2% Cash, Due 10/25) |
4,202,638 |
4,200,204 |
4,034,533 |
|||||||||||
4,202,638 |
4,200,204 |
4,034,533 |
||||||||||||||
SmartBear (0.8%)*(5)
|
High Tech Industries |
Second Lien Senior Secured Term Loan (LIBOR + 8.0%, 10.4% Cash, Due 05/24) |
4,959,088 |
4,840,642 |
4,778,162 |
|||||||||||
4,959,088 |
4,840,642 |
4,778,162 |
||||||||||||||
Smile Brands Group Inc. (0.9%)*(5)
|
Health Care Services |
First Lien Senior Secured Term Loan (LIBOR + 4.5%, 7.1% Cash, Due 10/24) |
5,043,318 |
4,981,982 |
4,912,691 |
|||||||||||
5,043,318 |
4,981,982 |
4,912,691 |
||||||||||||||
Solenis Holdings, L.P. (1.4%)*(4)
|
Specialty Chemicals |
First Lien Senior Secured Term Loan (LIBOR + 4.0%, 6.7% Cash, Due 12/23) |
7,960,000 |
8,010,373 |
7,681,400 |
|||||||||||
7,960,000 |
8,010,373 |
7,681,400 |
||||||||||||||
SonicWALL, Inc. (0.8%)*(4)
|
Internet Software & Services |
First Lien Senior Secured Term Loan (LIBOR + 3.5%, 6.1% Cash, Due 05/25) |
4,500,000 |
4,502,358 |
4,289,985 |
|||||||||||
4,500,000 |
4,502,358 |
4,289,985 |
||||||||||||||
Sophia Holding Finance, L.P . (2.7%)*(4)
|
Systems Software |
First Lien Senior Secured Term Loan (LIBOR + 3.25%, 6.1% Cash, Due 09/22) |
15,925,386 |
15,975,609 |
15,305,411 |
|||||||||||
15,925,386 |
15,975,609 |
15,305,411 |
||||||||||||||
SRS Distribution, Inc. (1.6%)*(4)
|
Building Products |
First Lien Senior Secured Term Loan (LIBOR + 3.25%, 5.8% Cash, Due 05/25) |
9,975,000 |
9,787,668 |
9,283,034 |
|||||||||||
9,975,000 |
9,787,668 |
9,283,034 |
||||||||||||||
SS&C Technologies, Inc. (0.3%)*(3) (4)
|
Computer & Electronics Retail |
First Lien Senior Secured Term Loan (LIBOR + 2.25%, 4.8% Cash, Due 04/25) |
1,760,188 |
1,755,852 |
1,657,886 |
|||||||||||
1,760,188 |
1,755,852 |
1,657,886 |
||||||||||||||
Staples Inc. (2.4%)*(4)
|
Retail |
First Lien Senior Secured Term Loan (LIBOR + 4.0%, 6.5% Cash, Due 09/24) |
13,964,736 |
13,944,087 |
13,359,644 |
|||||||||||
13,964,736 |
13,944,087 |
13,359,644 |
||||||||||||||
Syniverse Holdings, Inc. (1.7%)*(4)
|
Technology Distributors |
First Lien Senior Secured Term Loan (LIBOR + 5.0%, 7.5% Cash, Due 03/23) |
10,447,368 |
10,401,186 |
9,315,605 |
|||||||||||
10,447,368 |
10,401,186 |
9,315,605 |
||||||||||||||
Tahoe Subco 1 Ltd (2.5%)*(3) (4)
|
Internet Software & Services |
First Lien Senior Secured Term Loan (LIBOR + 3.5%, 6.3% Cash, Due 06/24) |
14,960,151 |
14,967,158 |
13,902,319 |
|||||||||||
14,960,151 |
14,967,158 |
13,902,319 |
||||||||||||||
Team Health Holdings, Inc. (1.1%)*(4)
|
Health Care Services |
First Lien Senior Secured Term Loan (LIBOR + 2.75%, 5.3% Cash, Due 02/24) |
6,964,557 |
6,701,992 |
6,207,162 |
|||||||||||
6,964,557 |
6,701,992 |
6,207,162 |
||||||||||||||
Tempo Acquisition LLC (2.0%)*(4)
|
Investment Banking & Brokerage |
First Lien Senior Secured Term Loan (LIBOR + 3.0%, 5.5% Cash, Due 05/24) |
11,616,035 |
11,663,099 |
11,093,314 |
|||||||||||
11,616,035 |
11,663,099 |
11,093,314 |
||||||||||||||
Transportation Insight, LLC (3.4%)*(5)
|
Air Freight & Logistics |
First Lien Senior Secured Term Loan (LIBOR + 4.5%, 7.0% Cash, Due 12/24) |
19,483,068 |
19,245,141 |
19,007,740 |
|||||||||||
19,483,068 |
19,245,141 |
19,007,740 |
||||||||||||||
TransUnion (0.1%)*(3) (4)
|
Research & Consulting Services |
First Lien Senior Secured Term Loan (LIBOR + 2.0%, 4.5% Cash, Due 04/23) |
634,147 |
619,996 |
608,781 |
|||||||||||
634,147 |
619,996 |
608,781 |
||||||||||||||
Travelport Ltd. (0.3%)*(3) (4)
|
Data Processing & Outsourced Services |
First Lien Senior Secured Term Loan (LIBOR + 2.5%, 5.1% Cash, Due 03/25) |
1,989,228 |
1,987,991 |
1,951,691 |
|||||||||||
1,989,228 |
1,987,991 |
1,951,691 |
||||||||||||||
Tronox Ltd. (1.2%)*(3) (4)
|
Commodity Chemicals |
First Lien Senior Secured Term Loan (LIBOR + 3.0%, 5.5% Cash, Due 09/24) |
6,964,824 |
7,001,035 |
6,745,920 |
|||||||||||
6,964,824 |
7,001,035 |
6,745,920 |
||||||||||||||
F-15
|
Barings BDC, Inc.
Consolidated Schedule of Investments — (Continued)
December 31, 2018
| ||||||||||||||||
Portfolio Company |
Industry |
Type of Investment(1) (2)
|
Principal
Amount
|
Cost |
Fair
Value
|
|||||||||||
Trystar, Inc. (3.1%)*(5)
|
Power Distribution Solutions |
First Lien Senior Secured Term Loan (LIBOR + 5.0%, 7.4% Cash, Due 09/23) |
$ |
17,850,676 |
$ |
17,554,515 |
$ |
17,320,845 |
||||||||
LLC Units (361.5 units) |
361,505 |
361,505 |
||||||||||||||
17,850,676 |
17,916,020 |
17,682,350 |
||||||||||||||
U.S. Anesthesia Partners, Inc. (2.3%)*(4)
|
Managed Health Care |
First Lien Senior Secured Term Loan (LIBOR + 3.0%, 5.5% Cash, Due 06/24) |
13,724,874 |
13,787,932 |
13,086,668 |
|||||||||||
13,724,874 |
13,787,932 |
13,086,668 |
||||||||||||||
U.S. Silica Company (0.2%)*(3) (4)
|
Metal & Glass Containers |
First Lien Senior Secured Term Loan (LIBOR + 4.0%, 6.6% Cash, Due 05/25) |
1,518,304 |
1,522,294 |
1,322,822 |
|||||||||||
1,518,304 |
1,522,294 |
1,322,822 |
||||||||||||||
Univision Communications Inc. (0.9%)*(4)
|
Broadcasting |
First Lien Senior Secured Term Loan (LIBOR + 2.75%, 5.3% Cash, Due 03/24) |
5,470,018 |
5,279,013 |
4,938,989 |
|||||||||||
5,470,018 |
5,279,013 |
4,938,989 |
||||||||||||||
US Legal Support, Inc. (2.3%)*(5)
|
Legal Services |
First Lien Senior Secured Term Loan (LIBOR + 5.75%, 8.5% Cash, Due 11/24) |
13,513,994 |
13,216,624 |
13,065,980 |
|||||||||||
13,513,994 |
13,216,624 |
13,065,980 |
||||||||||||||
USF Holdings LLC (0.8%)*(4) (5)
|
Auto Parts & Equipment |
First Lien Senior Secured Term Loan (LIBOR + 3.5%, 6.3% Cash, Due 12/21) |
4,870,130 |
4,887,672 |
4,650,974 |
|||||||||||
4,870,130 |
4,887,672 |
4,650,974 |
||||||||||||||
USI, Inc. (1.4%)*(4)
|
Property & Casualty Insurance |
First Lien Senior Secured Term Loan (LIBOR + 3.0%, 5.8% Cash, Due 05/24) |
8,457,179 |
8,449,689 |
7,960,320 |
|||||||||||
8,457,179 |
8,449,689 |
7,960,320 |
||||||||||||||
USIC Holdings, Inc. (1.2%)*(4)
|
Packaged Foods & Meats |
First Lien Senior Secured Term Loan (LIBOR + 3.25%, 5.8% Cash, Due 12/23) |
6,965,629 |
7,001,297 |
6,599,933 |
|||||||||||
6,965,629 |
7,001,297 |
6,599,933 |
||||||||||||||
Vail Holdco Corp (f/k/a Avantor, Inc.) (2.4%)*(4)
|
Health Care Equipment |
First Lien Senior Secured Term Loan (LIBOR + 3.75%, 6.6% Cash, Due 11/24) |
14,193,506 |
14,381,790 |
13,720,436 |
|||||||||||
14,193,506 |
14,381,790 |
13,720,436 |
||||||||||||||
Venator Materials LLC (0.5%)*(3) (4)
|
Commodity Chemicals |
First Lien Senior Secured Term Loan (LIBOR + 3.0%, 5.5% Cash, Due 08/24) |
2,984,887 |
2,995,737 |
2,846,836 |
|||||||||||
2,984,887 |
2,995,737 |
2,846,836 |
||||||||||||||
Veritas Bermuda Intermediate Holdings Ltd. (1.4%)*(4)
|
Technology Distributors |
First Lien Senior Secured Term Loan (LIBOR + 4.5%, 7.1% Cash, Due 01/23) |
9,451,899 |
9,033,056 |
8,027,403 |
|||||||||||
9,451,899 |
9,033,056 |
8,027,403 |
||||||||||||||
Verscend Holding Corp. (0.4%)*(4)
|
Health Care Technology |
First Lien Senior Secured Term Loan (LIBOR + 4.5%, 7.0% Cash, Due 08/25) |
2,493,750 |
2,523,202 |
2,406,469 |
|||||||||||
2,493,750 |
2,523,202 |
2,406,469 |
||||||||||||||
VF Holding Corp. (2.0%)*(4)
|
Systems Software |
First Lien Senior Secured Term Loan (LIBOR + 3.25%, 6.1% Cash, Due 07/25) |
12,000,000 |
12,006,052 |
11,373,720 |
|||||||||||
12,000,000 |
12,006,052 |
11,373,720 |
||||||||||||||
Wilsonart, LLC (1.7%)*(4)
|
Building Products |
First Lien Senior Secured Term Loan (LIBOR + 3.25%, 6.1% Cash, Due 12/23) |
9,974,683 |
9,974,683 |
9,519,638 |
|||||||||||
9,974,683 |
9,974,683 |
9,519,638 |
||||||||||||||
Winebow Group, LLC, (The) (0.2%)*(4)
|
Consumer goods |
First Lien Senior Secured Term Loan (LIBOR + 3.75%, 6.3% Cash, Due 07/21) |
1,572,129 |
1,483,331 |
1,353,335 |
|||||||||||
1,572,129 |
1,483,331 |
1,353,335 |
||||||||||||||
Wink Holdco, Inc (1.3%)*(4)
|
Managed Health Care |
First Lien Senior Secured Term Loan (LIBOR + 3.0%, 5.5% Cash, Due 12/24) |
7,571,614 |
7,570,011 |
7,158,961 |
|||||||||||
7,571,614 |
7,570,011 |
7,158,961 |
||||||||||||||
WME Entertainment Parent, LLC (f/k/a IMG Worldwide, Inc.) (2.3%)*(4)
|
Business Equipment & Services |
First Lien Senior Secured Term Loan (LIBOR + 2.75%, 5.3% Cash, Due 05/25) |
13,841,944 |
13,829,823 |
12,682,681 |
|||||||||||
13,841,944 |
13,829,823 |
12,682,681 |
||||||||||||||
F-16
|
Barings BDC, Inc.
Consolidated Schedule of Investments — (Continued)
December 31, 2018
| ||||||||||||||||
Portfolio Company |
Industry |
Type of Investment(1) (2)
|
Principal
Amount
|
Cost |
Fair
Value
|
|||||||||||
Xperi Corp (0.5%)*(3) (4) (5)
|
Semiconductor Equipment |
First Lien Senior Secured Term Loan (LIBOR + 2.5%, 5.0% Cash, Due 12/23) |
$ |
2,942,982 |
$ |
2,929,408 |
$ |
2,729,616 |
||||||||
2,942,982 |
2,929,408 |
2,729,616 |
||||||||||||||
Subtotal Non–Control / Non–Affiliate Investments |
1,132,612,430 |
1,128,694,715 |
1,076,631,804 |
|||||||||||||
Short-Term Investments |
||||||||||||||||
The Dreyfus Corporation (8.0%)*(4)
|
Money Market Fund |
Dreyfus Government Cash Management Fund (2.5% yield) |
45,223,941 |
45,223,941 |
45,223,941 |
|||||||||||
45,223,941 |
45,223,941 |
45,223,941 |
||||||||||||||
Subtotal Short-Term Investments |
45,223,941 |
45,223,941 |
45,223,941 |
|||||||||||||
Total Investments, December 31, 2018 (199.3%)* |
$ |
1,177,836,371 |
$ |
1,173,918,656 |
$ |
1,121,855,745 |
||||||||||
* Fair value as a percentage of net assets.
(1) |
All debt investments are income producing, unless otherwise noted. Equity and any equity-linked investments are non-income producing, unless otherwise noted. All investments were valued at fair value as determined in good faith by the Board of Directors. |
(2) |
All debt investments are variable rate investments unless otherwise noted. Index-based floating interest rates are generally subject to a contractual minimum interest rate. A majority of the variable rate loans in the Company's investment portfolio bear interest at a rate that may be determined by reference to either LIBOR or an alternate Base Rate (commonly based on the Federal Funds Rate or the Prime Rate), which typically reset semi-annually, quarterly, or monthly at the borrower's option. The borrower may also elect to have multiple interest reset periods for each loan. |
(3) |
Investment is not a qualifying investment as defined under Section 55(a) of the Investment Company Act of 1940, as amended. Non-qualifying assets represent 15.1% of total investments at fair value as of December 31, 2018. Qualifying assets must represent at least 70% of total assets at the time of acquisition of any additional non-qualifying assets. If at any time qualifying assets do not represent at least 70% of the Company's total assets, the Company will be precluded from acquiring any additional non-qualifying asset until such time as it complies with the requirements of Section 55(a).
|
(4) |
Some or all of the investment is or will be encumbered as security for Barings BDC Senior Funding I, LLC's credit facility entered into in August 2018 with Bank of America, N.A. (as amended and restated in December 2018, the "August 2018 Credit Facility"). |
(5) |
The fair value of the investment was determined using significant unobservable inputs. |
See accompanying notes.
F-17
|
Barings BDC, Inc.
Consolidated Schedule of Investments
December 31, 2017
| ||||||||||||||||
Portfolio Company |
Industry |
Type of Investment(1) (2) (7)
|
Principal
Amount
|
Cost |
Fair
Value(3)
|
|||||||||||
Non–Control / Non–Affiliate Investments: |
||||||||||||||||
Access Medical Acquisition, Inc. (3%)* |
Operator of Primary Care Clinics |
Subordinated Notes (10% Cash, 2% PIK, Due 01/22) |
$ |
13,819,514 |
$ |
13,630,067 |
$ |
13,630,067 |
||||||||
Class A Units (1,500,000 units) |
901,026 |
3,610,000 |
||||||||||||||
13,819,514 |
14,531,093 |
17,240,067 |
||||||||||||||
Aden & Anais Holdings, Inc. (0%)* |
Baby Products |
Common Stock (20,000 shares) |
2,000,000 |
601,000 |
||||||||||||
2,000,000 |
601,000 |
|||||||||||||||
AKKR-MVSC Member, LLC (F/K/A Motor Vehicle Software Corporation) (0%)* |
Provider of EVR Services |
Class A Units (1,000,000 units) |
1,092,964 |
1,413,000 |
||||||||||||
1,092,964 |
1,413,000 |
|||||||||||||||
AM General, LLC (4%)* |
Defense Manufacturing |
Senior Note (LIBOR + 7.25%, 8.6% Cash,
Due 12/21)(8)
|
9,000,000 |
8,875,311 |
8,886,000 |
|||||||||||
Second Lien Term Note (LIBOR +11.75%, 13.1% Cash, Due 06/22)(8)
|
20,000,000 |
19,480,694 |
19,593,000 |
|||||||||||||
29,000,000 |
28,356,005 |
28,479,000 |
||||||||||||||
Avantor, Inc. (0%)* |
Life Sciences and Advanced Technologies |
Subordinated Note (9.0% Cash, Due 10/25) |
500,000 |
500,000 |
500,000 |
|||||||||||
500,000 |
500,000 |
500,000 |
||||||||||||||
AVL Holdings, Inc. (0%)* |
Manufacturer and Distributor for Independent Artists and Authors |
Common Stock (138 shares) |
1,300,000 |
2,824,000 |
||||||||||||
1,300,000 |
2,824,000 |
|||||||||||||||
Baker Hill Acquisition, LLC (2%)* |
Loan Origination Software Solutions Provider |
Second Lien Term Notes (LIBOR + 11.0%, 12.3% Cash, Due 03/21)(8)
|
13,500,000 |
13,367,659 |
11,130,000 |
|||||||||||
Delayed Draw Term Note (LIBOR + 11.0%, 12.3% Cash, Due 03/21)(8)
|
2,000,000 |
1,982,177 |
1,982,177 |
|||||||||||||
Limited Partnership Interest |
1,498,500 |
105,000 |
||||||||||||||
15,500,000 |
16,848,336 |
13,217,177 |
||||||||||||||
Cafe Enterprises, Inc. (0%)* |
Restaurant |
Second Lien Term Note (Prime + 5.75%, 10.3% Cash, Due 03/19)(6)(8)
|
2,019,425 |
1,956,096 |
— |
|||||||||||
Subordinated Note (7% Cash, 7% PIK, Due 09/19)(6)
|
15,190,538 |
13,745,570 |
— |
|||||||||||||
Series C Preferred Stock (10,000 shares) |
1,000,000 |
— |
||||||||||||||
17,209,963 |
16,701,666 |
— |
||||||||||||||
|
Captek Softgel International, Inc.
(5%)*
|
Nutraceuticals Manufacturer |
Subordinated Note (10% Cash, 1.5% PIK, Due 01/23) |
30,813,099 |
30,534,147 |
30,534,147 |
|||||||||||
Common Stock (38,023 shares) |
3,957,697 |
4,137,000 |
||||||||||||||
30,813,099 |
34,491,844 |
34,671,147 |
||||||||||||||
Carolina Beverage Group, LLC (0%)* |
Beverage Manufacturing and Packaging |
Class B Units (11,974 units) |
119,735 |
1,873,000 |
||||||||||||
119,735 |
1,873,000 |
|||||||||||||||
Centerfield Media Holding Company (0%)* |
Digital Marketing |
Common Shares (500 shares) |
500,000 |
1,129,000 |
||||||||||||
500,000 |
1,129,000 |
|||||||||||||||
CIBT Global, Inc. (2%)* |
Provider of Mobility Services |
Second Lien Term Note (LIBOR + 7.75%, 9.1% Cash, Due 06/25)(8)
|
10,000,000 |
9,904,429 |
9,815,000 |
|||||||||||
10,000,000 |
9,904,429 |
9,815,000 |
||||||||||||||
CIS Acquisition, LLC (0%)* |
Secure Communications and Computing Solutions Provider |
Units (1.09 units) |
277,538 |
277,538 |
||||||||||||
277,538 |
277,538 |
|||||||||||||||
Community Intervention Services, Inc. (0%)* |
Provider of Behavioral Health Services |
Subordinated Note (7% Cash, 6% PIK, Due 01/21) (6)
|
20,969,036 |
17,732,558 |
— |
|||||||||||
20,969,036 |
17,732,558 |
— |
||||||||||||||
Constellis Holdings, LLC (1%)* |
Provider of Security and Risk Management Services |
Second Lien Term Note (LIBOR + 9.0%, 10.3% Cash, Due 04/25)(8)
|
5,000,000 |
4,929,791 |
4,894,000 |
|||||||||||
5,000,000 |
4,929,791 |
4,894,000 |
||||||||||||||
CPower Ultimate HoldCo, LLC (0%)* |
Demand Response Business |
Units (345,542 units) |
345,542 |
1,988,000 |
||||||||||||
345,542 |
1,988,000 |
|||||||||||||||
F-18
|
Barings BDC, Inc.
Consolidated Schedule of Investments — (Continued)
December 31, 2017
| ||||||||||||||||
Portfolio Company |
Industry |
Type of Investment(1) (2) (7)
|
Principal
Amount
|
Cost |
Fair
Value(3)
|
|||||||||||
CWS Holding Company, LLC (0%)* |
Manufacturer of Custom Windows and Sliding Doors |
Class A Units (1,500,000 units) |
$ |
1,500,000 |
$ |
1,546,000 |
||||||||||
1,500,000 |
1,546,000 |
|||||||||||||||
Data Source Holdings, LLC (0%)* |
Print Supply Chain Management Services |
Common Units (47,503 units) |
1,000,000 |
813,000 |
||||||||||||
1,000,000 |
813,000 |
|||||||||||||||
Del Real, LLC (3%)* |
Hispanic Refrigerated Foods Company |
Subordinated Note (11% Cash, Due 04/23) |
$ |
14,000,000 |
13,759,702 |
13,759,702 |
||||||||||
Class A Units (3,000,000 units) |
3,000,000 |
3,368,000 |
||||||||||||||
14,000,000 |
16,759,702 |
17,127,702 |
||||||||||||||
Deva Holdings, Inc. (5%)* |
Hair Products |
Senior Note (LIBOR + 6.75%, 8.1% Cash, Due 10/23)(8)
|
32,500,000 |
31,823,379 |
31,823,379 |
|||||||||||
32,500,000 |
31,823,379 |
31,823,379 |
||||||||||||||
Dimora Brands, Inc. (3%)* |
Hardware Designer and Distributor |
Second Lien Term Note (LIBOR + 8.5%, 9.9% Cash, Due 08/25)(8)
|
20,000,000 |
19,608,400 |
19,615,000 |
|||||||||||
20,000,000 |
19,608,400 |
19,615,000 |
||||||||||||||
DLC Acquisition, LLC (6%)* |
Staffing Firm |
Senior Notes (LIBOR + 8.0%, 10% Cash, Due 12/20)(8)
|
21,706,250 |
21,539,521 |
21,539,521 |
|||||||||||
Senior Note (10% Cash, 2% PIK, Due 12/20) |
17,275,680 |
17,123,271 |
17,123,271 |
|||||||||||||
38,981,930 |
38,662,792 |
38,662,792 |
||||||||||||||
Dyno Acquiror, Inc. (1%)* |
Sewing Products and Seasonal Decorative Products Supplier |
Subordinated Note (10.5% Cash, 1.5% PIK, Due 08/20) |
4,663,527 |
4,646,697 |
4,646,697 |
|||||||||||
Series A Units (600,000 units) |
600,000 |
504,000 |
||||||||||||||
4,663,527 |
5,246,697 |
5,150,697 |
||||||||||||||
Eckler's Holdings, Inc. (0%)* |
Restoration Parts and Accessories for Classic Cars and Trucks |
Subordinated Note (17.5% Cash, Due 06/19)(6)
|
14,385,439 |
13,242,814 |
— |
|||||||||||
Common Stock (18,029 shares) |
183,562 |
— |
||||||||||||||
Series A Preferred Stock (1,596 shares) |
1,596,126 |
— |
||||||||||||||
Series B Preferred Stock (702 shares) |
435,127 |
— |
||||||||||||||
14,385,439 |
15,457,629 |
— |
||||||||||||||
Frozen Specialties, Inc. (2%)* |
Frozen Foods Manufacturer |
Subordinated Note (10% Cash, 4% PIK, Due 05/18) |
14,238,457 |
14,238,457 |
14,238,457 |
|||||||||||
14,238,457 |
14,238,457 |
14,238,457 |
||||||||||||||
GST AutoLeather, Inc. (0%)* |
Supplier of Automotive Interior Leather |
Subordinated Note (0% Cash, Due 01/21)(6)
|
24,166,324 |
23,073,507 |
200,000 |
|||||||||||
24,166,324 |
23,073,507 |
200,000 |
||||||||||||||
Halo Branded Solutions, Inc. (3%)* |
Promotional Product Supply Chain Services |
Subordinated Notes (11% Cash, 1% PIK, Due 10/22) |
13,766,530 |
13,543,628 |
13,543,628 |
|||||||||||
Class A1 Units (2,600 units) |
2,600,000 |
5,857,000 |
||||||||||||||
13,766,530 |
16,143,628 |
19,400,628 |
||||||||||||||
HemaSource, Inc. (2%)* |
Medical Products Distributor |
Subordinated Note (9.5% Cash, 1.5% PIK, Due 01/24) |
10,069,284 |
9,880,715 |
9,880,715 |
|||||||||||
Class A Units (1,000,000 units) |
1,000,000 |
1,023,000 |
||||||||||||||
10,069,284 |
10,880,715 |
10,903,715 |
||||||||||||||
|
HKW Capital Partners IV, L.P.
(0%)*(4)
|
Multi-Sector Holdings |
0.6% Limited Partnership Interest |
894,476 |
1,671,000 |
||||||||||||
894,476 |
1,671,000 |
|||||||||||||||
HTC Borrower, LLC (4%)* |
Hunting and Outdoor Products |
Subordinated Notes (10% Cash, 3% PIK, Due 09/20) |
26,935,658 |
26,722,850 |
25,759,000 |
|||||||||||
26,935,658 |
26,722,850 |
25,759,000 |
||||||||||||||
ICP Industrial, Inc. (3%)* |
Coatings Formulator and Manufacturer |
Second Lien Term Notes (LIBOR + 8.25%, 9.6% Cash, Due 05/24)(8)
|
20,000,000 |
19,392,800 |
19,392,800 |
|||||||||||
Class A Units (1,289 units) |
1,751,483 |
1,650,000 |
||||||||||||||
20,000,000 |
21,144,283 |
21,042,800 |
||||||||||||||
IDERA, Inc. (2%)* |
Software Provider |
Second Lien Term Note (LIBOR + 9.0%, 10.4% Cash, Due 06/25)(8)
|
10,000,000 |
9,856,308 |
9,866,000 |
|||||||||||
10,000,000 |
9,856,308 |
9,866,000 |
||||||||||||||
Inland Pipe Rehabilitation Holding Company LLC (0%)* |
Cleaning and Repair Services |
Membership Interest Purchase Warrant (3%) |
853,500 |
1,101,000 |
||||||||||||
853,500 |
1,101,000 |
|||||||||||||||
F-19
|
Barings BDC, Inc.
Consolidated Schedule of Investments — (Continued)
December 31, 2017
| ||||||||||||||||
Portfolio Company |
Industry |
Type of Investment(1) (2) (7)
|
Principal
Amount
|
Cost |
Fair
Value(3)
|
|||||||||||
Integrated Efficiency Solutions, Inc. (3%)* |
Energy Services Contracting Firm |
Senior Secured Term Note (LIBOR + 9.25%, 10.6% Cash, Due 06/22)(8)
|
$ |
18,268,750 |
$ |
17,970,511 |
$ |
17,970,511 |
||||||||
Series B Preferred Units (238,095 units) |
300,000 |
243,000 |
||||||||||||||
18,268,750 |
18,270,511 |
18,213,511 |
||||||||||||||
Keystone Peer Review Organization, Inc. (0%)* |
Healthcare - Managed Care |
Second Lien Term Note (LIBOR + 9.25%, 10.6% Cash, Due 05/25)(8)
|
3,000,000 |
2,943,794 |
2,922,000 |
|||||||||||
3,000,000 |
2,943,794 |
2,922,000 |
||||||||||||||
KidKraft, Inc. (4%)* |
Children's Toy Manufacturer and Distributor |
Second Lien Term Note (11% Cash, 1% PIK, Due 03/22) |
27,945,580 |
27,491,811 |
27,491,811 |
|||||||||||
27,945,580 |
27,491,811 |
27,491,811 |
||||||||||||||
K-Square Restaurant Partners, LP (0%)* |
Restaurant |
Class A Units of Limited Partnership (2,000 units) |
638,260 |
1,588,000 |
||||||||||||
638,260 |
1,588,000 |
|||||||||||||||
Lakeview Health Holdings, Inc. (3%)* |
Substance Abuse Treatment Service Provider |
Senior Note (LIBOR + 7.0%, 8.5% Cash, Due 12/21)(8)
|
18,426,505 |
18,260,612 |
17,916,000 |
|||||||||||
Common Stock (2,000 shares) |
2,000,000 |
853,000 |
||||||||||||||
18,426,505 |
20,260,612 |
18,769,000 |
||||||||||||||
Media Storm, LLC (0%)* |
Marketing Services |
Subordinated Note (10% Cash, Due 08/19)(6)
|
6,876,818 |
6,541,519 |
1,617,000 |
|||||||||||
Membership Units (1,216,204 units) |
1,176,957 |
— |
||||||||||||||
6,876,818 |
7,718,476 |
1,617,000 |
||||||||||||||
MIC Holding LLC (1%)* |
Firearm Accessories Manufacturer and Distributor |
Preferred Units (1,470 units) |
1,470,000 |
3,449,000 |
||||||||||||
Common Units (30,000 units) |
30,000 |
4,918,000 |
||||||||||||||
1,500,000 |
8,367,000 |
|||||||||||||||
Micross Solutions LLC (3%)* |
Provider of Semiconductor Products and Services |
Senior Note (LIBOR + 5.5%, 6.8% Cash,
Due 08/23)(8)
|
14,962,500 |
14,788,973 |
14,788,973 |
|||||||||||
Class A-2 Common Units (1,979,524 units) |
2,019,693 |
1,571,000 |
||||||||||||||
14,962,500 |
16,808,666 |
16,359,973 |
||||||||||||||
Nautic Partners VII, LP (0%)*(4)
|
Multi-Sector Holdings |
0.4% Limited Partnership Interest |
907,332 |
1,175,000 |
||||||||||||
907,332 |
1,175,000 |
|||||||||||||||
Navicure, Inc. (1%)* |
Healthcare Revenue Cycle Management Software |
Second Lien Term Note (LIBOR + 7.5%, 8.9% Cash, Due 11/25)(8)
|
6,000,000 |
5,941,328 |
5,941,328 |
|||||||||||
6,000,000 |
5,941,328 |
5,941,328 |
||||||||||||||
Nomacorc, LLC (4%)* |
Synthetic Wine Cork Producer |
Subordinated Note (10% Cash, 2.3% PIK, Due 07/21) |
21,356,210 |
21,109,445 |
21,109,445 |
|||||||||||
Limited Partnership Interest |
2,161,185 |
1,438,000 |
||||||||||||||
21,356,210 |
23,270,630 |
22,547,445 |
||||||||||||||
OEConnection, LLC (0%)* |
Automotive Parts Supply Chain Software |
Second Lien Term Note (LIBOR + 8.0%, 9.3% Cash, Due 11/25)(8)
|
3,000,000 |
2,970,000 |
2,970,000 |
|||||||||||
3,000,000 |
2,970,000 |
2,970,000 |
||||||||||||||
Orchid Underwriters Agency, LLC (1%)* |
Insurance Underwriter |
Subordinated Note (10% Cash, 1.5% PIK, Due 03/23) |
2,135,226 |
2,095,654 |
2,095,654 |
|||||||||||
Subordinated Note (13.5% PIK, Due 03/24) |
812,457 |
797,991 |
797,991 |
|||||||||||||
Class A Preferred Units (15,000 units) |
338,158 |
957,000 |
||||||||||||||
Class A Common Units (15,000 units) |
— |
1,132,000 |
||||||||||||||
2,947,683 |
3,231,803 |
4,982,645 |
||||||||||||||
ProAmpac PG Borrower LLC (2%)* |
Manufacturer of Flexible Packaging Products |
Second Lien Term Note (LIBOR + 8.5%, 9.9% Cash, Due 11/24)(8)
|
15,000,000 |
14,794,786 |
14,988,000 |
|||||||||||
15,000,000 |
14,794,786 |
14,988,000 |
||||||||||||||
Q International Courier, LLC (2%)* |
Third-Party Logistics Provider |
Second Lien Term Note (LIBOR + 8.25%, 9.7% Cash, Due 09/25)(8)
|
14,000,000 |
13,725,941 |
13,725,941 |
|||||||||||
14,000,000 |
13,725,941 |
13,725,941 |
||||||||||||||
REP WWEX Acquisition Parent, LLC (2%)* |
Third-Party Logistics Provider |
Second Lien Term Note (LIBOR + 8.75%, 10.2% Cash, Due 02/25)(8)
|
15,000,000 |
14,794,594 |
14,861,000 |
|||||||||||
15,000,000 |
14,794,594 |
14,861,000 |
||||||||||||||
F-20
|
Barings BDC, Inc.
Consolidated Schedule of Investments — (Continued)
December 31, 2017
| ||||||||||||||||
Portfolio Company |
Industry |
Type of Investment(1) (2) (7)
|
Principal
Amount
|
Cost |
Fair
Value(3)
|
|||||||||||
RMP Group, Inc. (2%)* |
Healthcare Revenue Cycle Management Services |
Subordinated Note (10.5% Cash, 1% PIK, Due 09/22) |
$ |
10,083,813 |
$ |
9,904,854 |
$ |
9,904,854 |
||||||||
Units (1,000 units) |
1,000,000 |
723,000 |
||||||||||||||
10,083,813 |
10,904,854 |
10,627,854 |
||||||||||||||
RockYou, Inc. (0%)* |
Mobile Game Advertising Network |
Common Stock (67,585 shares) |
111,000 |
111,000 |
||||||||||||
111,000 |
111,000 |
|||||||||||||||
Rotolo Consultants, Inc. (3%)* |
Landscape Services |
Subordinated Note (11% Cash, 3% PIK, Due 08/21) |
7,632,930 |
7,531,194 |
7,531,194 |
|||||||||||
Series A Preferred Units (39 units) |
3,654,253 |
8,504,000 |
||||||||||||||
7,632,930 |
11,185,447 |
16,035,194 |
||||||||||||||
SCA Pharmaceuticals, LLC (2%)* |
Provider of Pharmaceutical Products |
Subordinated Note (LIBOR + 9.0%, 10.5% Cash, Due 12/20)(8)
|
10,000,000 |
9,832,455 |
9,832,455 |
|||||||||||
10,000,000 |
9,832,455 |
9,832,455 |
||||||||||||||
Schweiger Dermatology Group, LLC (4%)* |
Provider of Dermatology Services |
Senior Notes (LIBOR + 8.5%, 10.0% Cash,
Due 06/22)(8)
|
25,500,000 |
25,113,677 |
25,113,677 |
|||||||||||
Class A-5 Units (1,976,284 units) |
1,000,000 |
1,000,000 |
||||||||||||||
25,500,000 |
26,113,677 |
26,113,677 |
||||||||||||||
SCUF Gaming, Inc. (4%)* |
Gaming Controller Manufacturer |
Senior Notes (LIBOR + 8.5%, 9.9% Cash,
Due 12/21)(8)
|
24,757,920 |
24,339,939 |
24,339,939 |
|||||||||||
|
Revolver Loan (LIBOR + 8.5%, 9.9% Cash,
Due 06/18)(8)
|
1,500,000 |
1,487,760 |
1,487,760 |
|||||||||||||
Common Stock (27,112 shares) |
742,000 |
378,000 |
||||||||||||||
26,257,920 |
26,569,699 |
26,205,699 |
||||||||||||||
Smile Brands, Inc. (4%)* |
Dental Service Organization |
Subordinated Notes (10% Cash, 2% PIK, Due 02/23) |
22,796,512 |
22,417,773 |
22,417,773 |
|||||||||||
Class A Units (3,000 units) |
3,000,000 |
3,353,000 |
||||||||||||||
22,796,512 |
25,417,773 |
25,770,773 |
||||||||||||||
SPC Partners V, LP (0%)*(4)
|
Multi-Sector Holdings |
0.7% Limited Partnership Interest |
2,260,450 |
2,412,000 |
||||||||||||
2,260,450 |
2,412,000 |
|||||||||||||||
SPC Partners VI, LP (0%)*(4)
|
Multi-Sector Holdings |
0.6% Limited Partnership Interest |
207,828 |
207,828 |
||||||||||||
207,828 |
207,828 |
|||||||||||||||
Specialized Desanders, Inc. (2%)*(4)
|
Sand and Particulate Removal Equipment Provider for Oil and Gas Companies |
Subordinated Note (11% Cash, 2% PIK, Due 10/20) |
10,117,769 |
8,692,122 |
7,451,070 |
|||||||||||
Class C Partnership Units (2,000,000 units) |
1,937,421 |
3,993,000 |
||||||||||||||
10,117,769 |
10,629,543 |
11,444,070 |
||||||||||||||
St. Croix Hospice Acquisition Corp. (1%)* |
Hospice Services Provider |
Second Lien Term Note (LIBOR + 8.75%, 10.1% Cash, Due 03/24)(8)
|
9,200,000 |
9,065,834 |
9,065,834 |
|||||||||||
Series A Preferred Units (500 units) |
500,000 |
359,000 |
||||||||||||||
Class B Common Units (500 units) |
— |
— |
||||||||||||||
9,200,000 |
9,565,834 |
9,424,834 |
||||||||||||||
Tate's Bake Shop (2%)* |
Producer of Baked Goods |
Senior Note (LIBOR + 6.25%, 7.6% Cash, Due 08/19)(8)
|
9,975,000 |
9,951,709 |
9,951,709 |
|||||||||||
Limited Partnership Interest |
534,280 |
1,845,000 |
||||||||||||||
9,975,000 |
10,485,989 |
11,796,709 |
||||||||||||||
Tax Advisors Group, LLC (2%)* |
Tax Advisory Services |
Subordinated Note (10% Cash, 2% PIK, Due 12/22) |
12,400,000 |
12,169,399 |
12,169,399 |
|||||||||||
Class A Units (386 units) |
1,458,824 |
2,295,000 |
||||||||||||||
12,400,000 |
13,628,223 |
14,464,399 |
||||||||||||||
TCFI Merlin LLC ("Merlin") and TCFI CSG LLC ("CSG") (2%)* |
Specialty Staffing Service Provider |
Subordinated Notes (11.6% Cash, Due 09/19)(8)
|
14,184,192 |
13,970,730 |
13,970,730 |
|||||||||||
Limited Partnership Units - Merlin (500,500 units) |
285,485 |
1,595,000 |
||||||||||||||
Class A Units - CSG (100,000 units) |
100,000 |
230,000 |
||||||||||||||
14,184,192 |
14,356,215 |
15,795,730 |
||||||||||||||
The Cook & Boardman Group, LLC (1%)* |
Distributor of Doors and Related Products |
Class A Units (1,400,000 units) |
1,400,000 |
3,490,000 |
||||||||||||
1,400,000 |
3,490,000 |
|||||||||||||||
F-21
|
Barings BDC, Inc.
Consolidated Schedule of Investments — (Continued)
December 31, 2017
| ||||||||||||||||
Portfolio Company |
Industry |
Type of Investment(1) (2) (7)
|
Principal
Amount
|
Cost |
Fair
Value(3)
|
|||||||||||
Trademark Global LLC (3%)* |
Supplier to Mass Market Internet Retail |
Subordinated Note (10% Cash, 1.3% PIK, Due 04/23) |
$ |
14,800,000 |
$ |
14,610,405 |
$ |
14,610,405 |
||||||||
Class A Units (1,500,000 units) |
1,500,000 |
1,500,000 |
||||||||||||||
Class B Units (1,500,000 units) |
— |
894,000 |
||||||||||||||
14,800,000 |
16,110,405 |
17,004,405 |
||||||||||||||
Travelpro Products, Inc. ("Travelpro") and TP - Holiday Group Limited ("TP") (3%)* |
Luggage and Travel Bag Supplier |
Second Lien Term Note - Travelpro (11% Cash, 2% PIK, Due 11/22) |
10,332,955 |
10,153,881 |
10,153,881 |
|||||||||||
Second Lien Term Note - TP (11% Cash, 2% PIK, Due 11/22)(4)
|
9,152,950 |
8,991,783 |
9,403,477 |
|||||||||||||
Common Units - Travelpro (2,000,000 units) |
2,000,000 |
2,270,000 |
||||||||||||||
19,485,905 |
21,145,664 |
21,827,358 |
||||||||||||||
United Biologics, LLC (2%)* |
Allergy Immunotherapy |
Senior Note (12% Cash, 2% PIK, Due 04/18) |
13,022,543 |
13,022,542 |
13,022,542 |
|||||||||||
Class A-1 Common Units (18,818 units) |
137,324 |
137,325 |
||||||||||||||
Class A Common Units (177,935 units) |
1,999,989 |
1,351,000 |
||||||||||||||
Class A-2 Common Kicker Units (444,003 units) |
— |
— |
||||||||||||||
Class A-1 Common Kicker Units (14,114 units) |
— |
— |
||||||||||||||
Class A, Class A-1, Class A-1 Kicker & Class B Unit Purchase Warrants |
838,117 |
288,000 |
||||||||||||||
13,022,543 |
15,997,972 |
14,798,867 |
||||||||||||||
Vantage Mobility International, LLC (5%)* |
Wheelchair Accessible Vehicle Manufacturer |
Subordinated Notes (10.6% Cash, Due 09/21)(8)
|
30,708,796 |
30,216,432 |
30,216,432 |
|||||||||||
Class A Units (1,750,000 units) |
1,750,000 |
719,000 |
||||||||||||||
30,708,796 |
31,966,432 |
30,935,432 |
||||||||||||||
Wheel Pros Holdings, Inc. (3%)* |
Wheel/Rim and Performance Tire Distributor |
Subordinated Note (LIBOR + 7.0%, 11% Cash, Due 06/20)(8)
|
16,435,000 |
16,217,360 |
16,217,360 |
|||||||||||
Class A Units (2,000 units) |
1,954,144 |
3,508,000 |
||||||||||||||
16,435,000 |
18,171,504 |
19,725,360 |
||||||||||||||
Women's Marketing, Inc. (0%)* |
Full-Service Media Organization |
Subordinated Note (11% Cash, 1.5% PIK, Due 06/21)(6)
|
19,136,331 |
16,141,439 |
— |
|||||||||||
Class A Common Units (16,300 units) |
1,630,000 |
— |
||||||||||||||
19,136,331 |
17,771,439 |
— |
||||||||||||||
WSO Holdings, LP (0%)* |
Organic/Fair Trade Sugar, Syrup, Nectar and Honey Producer |
Common Points (3,121 points) |
3,089,581 |
2,612,000 |
||||||||||||
3,089,581 |
2,612,000 |
|||||||||||||||
YummyEarth Inc. (4%)* |
Organic Candy Manufacturer |
Senior Notes (LIBOR + 8.5%, 10.0% Cash,
Due 08/20)(8)
|
31,250,000 |
30,965,913 |
26,196,000 |
|||||||||||
Limited Partnership Interest |
3,496,500 |
— |
||||||||||||||
31,250,000 |
34,462,413 |
26,196,000 |
||||||||||||||
Subtotal Non–Control / Non–Affiliate Investments |
856,289,518 |
910,150,765 |
831,194,397 |
|||||||||||||
Affiliate Investments: |
||||||||||||||||
All Metals Holding, LLC (1%)* |
Steel Processor and Distributor |
Subordinated Note (12% Cash, 1% PIK, Due 12/21) |
6,434,351 |
6,278,902 |
6,434,000 |
|||||||||||
Units (318,977 units) |
793,331 |
266,000 |
||||||||||||||
6,434,351 |
7,072,233 |
6,700,000 |
||||||||||||||
Consolidated Lumber Holdings, LLC (1%)* |
Lumber Yard Operator |
Class A Units (15,000 units) |
1,500,000 |
4,500,000 |
||||||||||||
1,500,000 |
4,500,000 |
|||||||||||||||
FCL Holding SPV, LLC (0%)* |
Commercial Printing Services |
Class A Interest (24,873 units) |
292,000 |
570,000 |
||||||||||||
Class B Interest (48,427 units) |
— |
— |
||||||||||||||
Class C Interest (3,746 units) |
— |
— |
||||||||||||||
292,000 |
570,000 |
|||||||||||||||
Mac Land Holdings, Inc. (0%)* |
Environmental and Facilities Services |
Common Stock (139 shares) |
369,000 |
— |
||||||||||||
369,000 |
— |
|||||||||||||||
F-22
|
Barings BDC, Inc.
Consolidated Schedule of Investments — (Continued)
December 31, 2017
| ||||||||||||||||
Portfolio Company |
Industry |
Type of Investment(1) (2) (7)
|
Principal
Amount
|
Cost |
Fair
Value(3)
|
|||||||||||
NB Products, Inc. (9%)* |
Distributor of Work Apparel and Accessories |
Subordinated Note (12% Cash, 2% PIK, Due 02/20) |
$ |
23,570,899 |
$ |
23,308,085 |
$ |
23,308,085 |
||||||||
Jr. Subordinated Note (10% PIK, Due 02/20) |
5,194,357 |
5,114,592 |
5,114,592 |
|||||||||||||
Jr. Subordinated Bridge Note (20% PIK, Due 05/21) |
2,434,156 |
2,412,295 |
2,412,295 |
|||||||||||||
Series A Redeemable Senior Preferred Stock (7,839 shares) |
7,621,648 |
10,390,000 |
||||||||||||||
Common Stock (1,668,691 shares) |
333,738 |
16,044,000 |
||||||||||||||
31,199,412 |
38,790,358 |
57,268,972 |
||||||||||||||
Passport Food Group, LLC (3%)* |
Manufacturer of Ethnic Food Products |
Senior Notes (LIBOR + 9.0%, 10.3% Cash,
Due 03/22)(8)
|
20,000,000 |
19,648,160 |
16,672,000 |
|||||||||||
Common Stock (20,000 shares) |
2,000,000 |
357,000 |
||||||||||||||
20,000,000 |
21,648,160 |
17,029,000 |
||||||||||||||
PCX Aerostructures, LLC (4%)* |
Aerospace Components Manufacturer |
Subordinated Note (10.5% Cash, Due 10/19)(9)
|
31,647,359 |
31,244,000 |
22,574,000 |
|||||||||||
Subordinated Note (6% PIK, Due 10/20)(9)
|
759,286 |
759,286 |
548,000 |
|||||||||||||
Series A Preferred Stock (6,066 shares) |
6,065,621 |
— |
||||||||||||||
Series B Preferred Stock (411 shares) |
410,514 |
— |
||||||||||||||
Class A Common Stock (121,922 shares) |
30,480 |
— |
||||||||||||||
32,406,645 |
38,509,901 |
23,122,000 |
||||||||||||||
Team Waste, LLC (2%)* |
Environmental and Facilities Services |
Subordinated Note (10% Cash, 2% PIK, Due 08/23) |
5,028,180 |
4,930,962 |
4,930,962 |
|||||||||||
Preferred Units (500,000 units) |
10,000,000 |
10,000,000 |
||||||||||||||
5,028,180 |
14,930,962 |
14,930,962 |
||||||||||||||
Technology Crops, LLC (1%)* |
Supply Chain Management Services |
Subordinated Notes (12% Cash, Due 02/18) |
12,294,102 |
12,294,102 |
8,617,000 |
|||||||||||
Common Units (50 units) |
500,000 |
— |
||||||||||||||
12,294,102 |
12,794,102 |
8,617,000 |
||||||||||||||
TGaS Advisors, LLC (2%)* |
Advisory Solutions to Pharmaceutical Companies |
Senior Note (10% Cash, 1% PIK, Due 11/19) |
9,522,893 |
9,431,015 |
9,431,015 |
|||||||||||
Preferred Units (1,685,357 units) |
1,556,069 |
1,524,000 |
||||||||||||||
9,522,893 |
10,987,084 |
10,955,015 |
||||||||||||||
Tulcan Fund IV, L.P. (0%)* |
Custom Forging and Fastener Supplies |
Common Units (1,000,000 units) |
1,000,000 |
— |
||||||||||||
1,000,000 |
— |
|||||||||||||||
United Retirement Plan Consultants, Inc. (0%)* |
Retirement Plan Administrator |
Series A Preferred Shares (9,400 shares) |
205,748 |
302,000 |
||||||||||||
Common Shares (100,000 shares) |
1,000,000 |
419,000 |
||||||||||||||
1,205,748 |
721,000 |
|||||||||||||||
Wythe Will Tzetzo, LLC (0%)* |
Confectionery Goods Distributor |
Series A Preferred Units (99,829 units) |
— |
2,688,000 |
||||||||||||
— |
2,688,000 |
|||||||||||||||
Subtotal Affiliate Investments |
116,885,583 |
149,099,548 |
147,101,949 |
|||||||||||||
Control Investments: |
||||||||||||||||
CRS-SPV, Inc. (3%)* |
Fluid Reprocessing Services |
Common Stock (1,100 shares) |
18,428,000 |
20,283,000 |
||||||||||||
18,428,000 |
20,283,000 |
|||||||||||||||
Frank Entertainment Group, LLC (1%)* |
Movie Theatre and Family Entertainment Operator |
Senior Note (6% Cash, Due 06/19)(6)
|
11,330,010 |
10,746,494 |
6,541,000 |
|||||||||||
Second Lien Term Note (2.5% Cash, Due 09/19)(6)
|
2,923,484 |
2,879,479 |
— |
|||||||||||||
Redeemable Preferred Units (2,800,000 units) |
2,800,000 |
— |
||||||||||||||
Class B Redeemable Preferred Units (2,800,000 units) |
2,800,000 |
— |
||||||||||||||
Class A Common Units (606,552 units) |
1,000,000 |
— |
||||||||||||||
14,253,494 |
20,225,973 |
6,541,000 |
||||||||||||||
FrontStream Holdings, LLC (1%)* |
Payment and Donation Management Product Service Provider |
Subordinated Note (LIBOR + 6.0%, 7.3% Cash, Due 12/20)(6)(8)
|
14,644,622 |
14,023,389 |
7,414,000 |
|||||||||||
Common Stock (1,000 shares) |
500,000 |
— |
||||||||||||||
14,644,622 |
14,523,389 |
7,414,000 |
||||||||||||||
F-23
|
Barings BDC, Inc.
Consolidated Schedule of Investments — (Continued)
December 31, 2017
| ||||||||||||||||
Portfolio Company |
Industry |
Type of Investment(1) (2) (7)
|
Principal
Amount
|
Cost |
Fair
Value(3)
|
|||||||||||
Frontstreet Facility Solutions, Inc. (1%)* |
Retail, Restaurant and Commercial Facilities Maintenance |
Subordinated Note (13% Cash, Due 03/21) |
$ |
8,462,629 |
$ |
8,447,172 |
$ |
3,750,000 |
||||||||
Series A Convertible Preferred Stock (60,000 shares) |
250,575 |
— |
||||||||||||||
Series B Convertible Preferred Stock (20,000 shares) |
500,144 |
— |
||||||||||||||
Common Stock (27,890 shares) |
279 |
— |
||||||||||||||
8,462,629 |
9,198,170 |
3,750,000 |
||||||||||||||
Subtotal Control Investments |
37,360,745 |
62,375,532 |
37,988,000 |
|||||||||||||
Total Investments, December 31, 2017 (158%)* |
$ |
1,010,535,846 |
$ |
1,121,625,845 |
$ |
1,016,284,346 |
||||||||||
* Fair value as a percentage of net assets.
(1) |
All debt investments are income producing, unless otherwise noted. Equity and equity-linked investments are non-income producing, unless otherwise noted. The fair values of all investments were determined using significant unobservable inputs. |
(2) |
Disclosures of interest rates on notes include cash interest rates and payment-in-kind ("PIK") interest rates. |
(3) |
All investments are restricted as to resale and were valued at fair value as determined in good faith by the Board of Directors. |
(4) |
Investment is not a qualifying investment as defined under Section 55(a) of the Investment Company Act of 1940, as amended. Non-qualifying assets represent 2.6% of total investments at fair value as of December 31, 2017. Qualifying assets must represent at least 70% of total assets at the time of acquisition of any additional non-qualifying assets. If at any time qualifying assets do not represent at least 70% of the Company's total assets, the Company will be precluded from acquiring any additional non-qualifying asset until such time as it complies with the requirements of Section 55(a). |
(5) |
PIK non-accrual investment. |
(6) |
Non-accrual investment. |
(7) |
All of the Company's investments, unless otherwise noted, are encumbered either as security for the Company's senior secured credit facility entered into in May 2015 and subsequently amended in May 2017 (the "May 2017 Credit Facility") or in support of the SBA-guaranteed debentures issued by Triangle Mezzanine Fund LLLP and Triangle Mezzanine Fund II LP. |
(8) |
Index-based floating interest rate is subject to a contractual minimum interest rate. A majority of the variable rate loans in the Company's investment portfolio bear interest at a rate that may be determined by reference to either LIBOR or an alternate Base Rate (commonly based on the Federal Funds Rate or the Prime Rate), which typically reset semi-annually, quarterly, or monthly at the borrower's option. The borrower may also elect to have multiple interest reset periods for each loan. |
(9) |
Effective February 9, 2018, the Company's debt investments in PCX Aerostructures, LLC were amended to provide for cash interest at an all-in rate of 6% per annum. |
See accompanying notes.
F-24
Barings BDC, Inc.
Notes to Consolidated Financial Statements
1. Organization, Business, Basis of Presentation and Summary of Significant Accounting Policies
Organization and Business
Barings BDC, Inc. (formerly Triangle Capital Corporation) and its wholly-owned subsidiaries (collectively, the "Company"), are specialty finance companies. The Company currently operates as a closed-end, non-diversified investment company and has elected to be treated as a business development company ("BDC") under the Investment Company Act of 1940, as amended (the "1940 Act"). The Company's wholly-owned subsidiary, Triangle Mezzanine Fund LLLP ("Triangle SBIC") has also elected to be treated as a BDC under the 1940 Act. The Company has elected for federal income tax purposes to be treated as a regulated investment company ("RIC") under the Internal Revenue Code of 1986, as amended (the "Code"), for tax purposes.
The Asset Sale and Externalization Transactions
On April 3, 2018, the Company entered into an asset purchase agreement (the "Asset Purchase Agreement") with an affiliate of Benefit Street Partners L.L.C. ("BSP"), BSP Asset Acquisition I, LLC (the "Asset Buyer"), pursuant to which the Company agreed to sell its December 31, 2017 investment portfolio to the Asset Buyer for gross proceeds of $981.2 million in cash, subject to certain adjustments to take into account portfolio activity and other matters occurring since December 31, 2017 (such transaction referred to herein as the "Asset Sale Transaction").
Also on April 3, 2018, the Company entered into a stock purchase and transaction agreement (the "Externalization Agreement") with Barings LLC ("Barings" or the "Adviser"), through which Barings agreed to become the investment adviser to the Company in exchange for (1) a payment by Barings of $85.0 million directly to the Company’s stockholders, (2) an investment by Barings of $100.0 million in newly issued shares of the Company's common stock at net asset value and (3) a commitment from Barings to purchase up to $50.0 million of shares of the Company's common stock in the open market at prices up to and including the Company's then-current net asset value per share for a two-year period (the "Trading Plan"), after which Barings agreed to use any remaining funds from the $50.0 million to purchase additional newly issued shares of the Company's common stock at the greater of the Company's then-current net asset value per share and market price (collectively, the "Externalization Transaction"). The Asset Sale Transaction and the Externalization Transaction are collectively referred to herein as the "Transactions." The Transactions were approved by the Company's stockholders at the Company's July 24, 2018 special meeting of stockholders (the "Special Meeting").
The Asset Sale Transaction closed on July 31, 2018. The gross cash proceeds received from the Asset Buyer and certain affiliates of the Asset Buyer in connection with the Asset Sale Transaction were approximately $793.3 million, after adjustments to take into account portfolio activity and other matters occurring since December 31, 2017, as described in greater detail in the Asset Purchase Agreement. Adjustments to the purchase price included, among other things, approximately $208.8 million of principal payments and prepayments, sales proceeds and distributions related to the investment portfolio that were received and retained by the Company between December 31, 2017 and the closing of the Asset Sale Transaction, offset by approximately $29.5 million of loans and equity investments originated between December 31, 2017 and the closing of the Asset Sale Transaction.
In connection with the closing of the Asset Sale Transaction, the Company caused notices to be issued to the holders of its December 2022 Notes and March 2022 Notes (each as defined herein) regarding the redemption of all $80.5 million in aggregate principal amount of the December 2022 Notes and all $86.3 million in aggregate principal amount of the March 2022 Notes, in each case, on August 30, 2018. The December 2022 Notes and the March 2022 Notes were redeemed at 100% of their principal amount ($25.00 per Note), plus the accrued and unpaid interest thereon from June 15, 2018 to, but excluding, August 30, 2018. In furtherance of the redemption, on July 31, 2018, the Company irrevocably deposited with The Bank of New York Mellon Trust Company, N.A., as trustee under the indenture and supplements thereto relating to the December 2022 Notes and the March 2022 Notes, funds in trust for the purposes of redeeming all of the issued and outstanding December 2022 Notes and March 2022 Notes
F-25
Barings BDC, Inc.
Notes to Consolidated Financial Statements — (Continued)
and paying all sums due and payable under the indenture and supplements thereto. As a result, the Company’s obligations under the indenture and supplements thereto relating to the December 2022 Notes and the March 2022 Notes were satisfied and discharged as of July 31, 2018, except with respect to those obligations that the indenture expressly provides shall survive the satisfaction and discharge of the indenture. In addition, in connection with the closing of the Asset Sale Transaction, the Company terminated the May 2017 Credit Facility.
The Company's wholly-owned subsidiaries, Triangle SBIC, Triangle Mezzanine Fund II LP ("Triangle SBIC II") and Triangle Mezzanine Fund III LP ("Triangle SBIC III") are specialty finance limited partnerships that were formed to make investments primarily in lower middle-market companies located throughout the United States. Each of Triangle SBIC, Triangle SBIC II and Triangle SBIC III held licenses to operate as Small Business Investment Companies ("SBICs") under the authority of the United States Small Business Administration ("SBA"). In connection with the closing of the Asset Sale Transaction, the Company repaid all of its outstanding SBA-guaranteed debentures and delivered necessary materials to the SBA to surrender the SBIC licenses held by Triangle SBIC, Triangle SBIC II, and Triangle SBIC III.
The Externalization Transaction closed on August 2, 2018 (the "Externalization Closing"). Effective as of the Externalization Closing, the Company changed its name from Triangle Capital Corporation to Barings BDC, Inc. and on August 3, 2018 began trading on the New York Stock Exchange ("NYSE") under the symbol "BBDC."
In connection with the Externalization Closing, the following events occurred:
• |
On August 2, 2018, the Company entered into an investment advisory agreement (the "Advisory Agreement") and an administration agreement (the "Administration Agreement") with the Adviser pursuant to which the Adviser serves as the Company’s investment adviser and administrator and manages its investment portfolio which initially consisted primarily of the cash proceeds received in connection with the Asset Sale Transaction. |
• |
On August 2, 2018, the Company issued 8,529,917 shares of the Company's common stock to the Adviser at a price of $11.723443 per share, or an aggregate of $100.0 million in cash, in a private transaction exempt from registration under Section 4(a)(2) of the Securities Act of 1933, as amended, and/or Rule 506 of Regulation D thereunder (the "Stock Issuance"). |
• |
On August 2, 2018, the Company entered into a registration rights agreement with the Adviser with respect to the shares of the Company's common stock acquired in the Stock Issuance. |
• |
On August 7, 2018, the Company launched a $50.0 million issuer tender offer (the "Tender Offer"). Pursuant to the Tender Offer, on September 11, 2018, the Company purchased 4,901,961 shares of the Company's common stock at a purchase price of $10.20 per share, for an aggregate cost of approximately $50.0 million, excluding fees and expenses relating to the Tender Offer. The shares of common stock purchased in the Tender Offer represented approximately 8.7% of the Company’s issued and outstanding shares as of September 6, 2018. |
Expenses Related to the Transactions
In connection with the Externalization Transaction, and the subsequent change of control and related termination of employees, the Company recognized one-time compensation expenses of approximately $27.6 million in the year ended December 31, 2018. These one-time compensation expenses included severance expenses, pro-rata incentive compensation, transaction-related bonuses, expenses related to the acceleration of vesting of restricted stock grants and deferred compensation grants, and other expenses associated with the obligations under the Company's existing severance agreements and severance policy. In addition, the Company recognized transaction advisory fees, legal expenses and other direct costs associated with the Transactions of approximately $11.8 million in the year ended December 31, 2018.
F-26
Barings BDC, Inc.
Notes to Consolidated Financial Statements — (Continued)
Organization
The Company is a Maryland corporation incorporated on October 10, 2006. From 2007 through the date of the Externalization Transaction, the Company was internally managed by its executive officers under the supervision of its Board of Directors (the "Board"). During this period, the Company did not pay management or advisory fees, but instead incurred the operating costs associated with employing executive management and investment and portfolio management professionals. On August 2, 2018, the Company entered into the Advisory Agreement and became an externally-managed BDC managed by the Adviser. An externally-managed BDC generally does not have any employees, and its investment and management functions are provided by an outside investment adviser and administrator under an advisory agreement and administration agreement. Instead of the Company directly compensating employees, the Company pays the Adviser for investment and management services pursuant to the terms of the Advisory Agreement and the Administration Agreement. See Note 2 - Agreements and Related Party Transactions for additional information regarding the Advisory Agreement and the Administration Agreement.
Basis of Presentation
The financial statements of the Company include the accounts of Barings BDC, Inc. and its wholly-owned subsidiaries. The effects of all intercompany transactions between Barings BDC, Inc. and its subsidiaries have been eliminated in consolidation. Under Financial Accounting Standards Board ("FASB") Accounting Standards Codification ("ASC") Topic 946, Financial Services - Investment Companies, the Company is precluded from consolidating portfolio company investments, including those in which it has a controlling interest, unless the portfolio company is another investment company. An exception to this general principle occurs if the Company holds a controlling interest in an operating company that provides all or substantially all of its services directly to the Company or to its portfolio companies. None of the portfolio investments made by the Company qualify for this exception. Therefore, the Company's investment portfolio is carried on the Consolidated Balance Sheets at fair value, as discussed further in Note 3, with any adjustments to fair value recognized as "Net unrealized appreciation (depreciation)" on the Consolidated Statements of Operations.
The accompanying financial statements have been prepared in accordance with accounting principles generally accepted in the United States (“U.S. GAAP”). All financial data and information included in these financial statements have been presented on the basis described above.
Recently Issued Accounting Standards
In August 2018, the FASB issued Accounting Standards Update, 2018-13, Disclosure Framework - Changes to the Disclosure Requirements for Fair Value Measurement ("ASU 2018-13"), which includes new, eliminated and modified fair value disclosure requirements. The new guidance requires disclosure of the range and weighted average of the significant unobservable inputs for Level 3 fair value measurements and the way it is calculated. The guidance also eliminates the following disclosures: (i) amount and reason for transfers between Level 1 and Level 2, (ii) policy for timing of transfers between levels of the fair value hierarchy and (iii) valuation processes for Level 3 fair value measurement. In addition, the disclosure is modified such that the narrative description for the recurring Level 3 fair value measures should communicate information about the measurement uncertainty in fair value measurements as of the reporting date rather than a point in the future. The guidance is effective for all entities for interim and annual periods beginning after December 15, 2019. An entity is permitted to early adopt the entire standard or only the provisions that eliminate or modify disclosures. The Company’s management does not expect the adoption of ASU 2018-13 to have a significant impact on its consolidated financial statements.
Reclassifications
Certain reclassifications were made to prior year financial statements to conform to the current year presentation.
F-27
Barings BDC, Inc.
Notes to Consolidated Financial Statements — (Continued)
Significant Accounting Policies
Use of Estimates
The preparation of financial statements in conformity with U.S. GAAP requires management to make estimates and assumptions that affect the amounts reported in the financial statements and accompanying notes. Actual results could differ from those estimates.
Valuation of Investments
The Company has a valuation policy, as well as established and documented processes and methodologies for determining the fair values of portfolio company investments on a recurring (at least quarterly) basis in accordance with the 1940 Act and FASB ASC Topic 820, Fair Value Measurements and Disclosures ("ASC Topic 820"). The Company's current valuation policy and processes were established by the Adviser and were approved by the Board.
Under ASC Topic 820, fair value is the price that would be received to sell an asset or paid to transfer a liability in an orderly transaction between a willing buyer and a willing seller at the measurement date. For the Company’s portfolio securities, fair value is generally the amount that the Company might reasonably expect to receive upon the current sale of the security. Under ASC Topic 820, the fair value measurement assumes that the sale occurs in the principal market for the security, or in the absence of a principal market, in the most advantageous market for the security. Under ASC Topic 820, if no market for the security exists or if the Company does not have access to the principal market, the security should be valued based on the sale occurring in a hypothetical market.
Under ASC Topic 820, there are three levels of valuation inputs, as follows:
Level 1 Inputs – include quoted prices (unadjusted) in active markets for identical assets or liabilities.
Level 2 Inputs – include quoted prices for similar assets and liabilities in active markets, and inputs that are observable for the asset or liability, either directly or indirectly, for substantially the full term of the financial instrument.
Level 3 Inputs – include inputs that are unobservable and significant to the fair value measurement.
A financial instrument is categorized within the ASC Topic 820 valuation hierarchy based upon the lowest level of input to the valuation process that is significant to the fair value measurement. For example, a Level 3 fair value measurement may include inputs that are observable (Levels 1 and 2) and unobservable (Level 3). Therefore, unrealized appreciation and depreciation related to such investments categorized as Level 3 investments within the tables below may include changes in fair value that are attributable to both observable inputs (Levels 1 and 2) and unobservable inputs (Level 3).
The Company’s investment portfolio includes certain debt and equity instruments of privately held companies for which quoted prices or other inputs falling within the categories of Level 1 and Level 2 are generally not available. In such cases, the Company determines the fair value of its investments in good faith primarily using Level 3 inputs. In certain cases, quoted prices or other observable inputs exist, and the Company assesses the appropriateness of the use of these third-party quotes in determining fair value based on (i) its understanding of the level of actual transactions used by the broker to develop the quote and whether the quote was an indicative price or binding offer and (ii) the depth and consistency of broker quotes and the correlation of changes in broker quotes with the underlying performance of the portfolio company.
There is no single standard for determining fair value in good faith, as fair value depends upon the specific circumstances of each individual investment. The recorded fair values of the Company’s Level 3 investments may differ significantly from fair values that would have been used had an active market for the securities existed. In addition, changes in the market environment and other events that may occur over the life of the investments may cause the gains or losses ultimately realized on these investments to be different than the valuations currently assigned.
F-28
Barings BDC, Inc.
Notes to Consolidated Financial Statements — (Continued)
Investment Valuation Process Prior to the Transactions
Prior to the Transactions, the securities in which the Company invested were generally only purchased and sold in merger and acquisition transactions, in which case the entire portfolio company was sold to a third-party purchaser. As a result, unless the Company had the ability to control such a transaction, the assumed principal market for the Company’s securities was a hypothetical secondary market. The Level 3 inputs to the Company’s valuation process reflected the Company’s best estimate of the assumptions that would be used by market participants in pricing the investment in a transaction in a hypothetical secondary market.
Prior to the Transactions, the Company’s valuation process was led by the Company’s executive officers. The Company’s valuation process began with a quarterly review of each investment in the Company’s investment portfolio by the Company’s executive officers and investment committee. Valuations of each portfolio security were then prepared by the Company’s investment professionals, who had direct responsibility for the origination, management and monitoring of each investment. Each investment valuation was subject to (i) a review by the lead investment officer responsible for the portfolio company investment and (ii) a peer review by a second investment officer or executive officer of the Company. Generally, any investment that was valued below cost was subjected to review by one of the Company’s executive officers. After the peer review was complete, the Company engaged two independent valuation firms (collectively, the "Valuation Firms"), to provide third-party reviews of certain investments, as described further below. Finally, the Board had the responsibility for reviewing and approving, in good faith, the fair value of the Company’s investments in accordance with the 1940 Act.
The Valuation Firms provided third-party valuation consulting services to the Company which consisted of certain limited procedures that the Company identified and requested the Valuation Firms to perform (hereinafter referred to as the "Procedures"). The Procedures were performed with respect to each portfolio company at least once in every calendar year and for new portfolio companies, at least once in the twelve-month period subsequent to the initial investment. In addition, the Procedures were generally performed with respect to a portfolio company when there was a significant change in the fair value of the investment. In certain instances, the Company determined that it was not cost-effective, and as a result was not in the Company’s stockholders’ best interest, to request the Valuation Firms to perform the Procedures on one or more portfolio companies. Such instances included, but were not limited to, situations where the fair value of the investment in the portfolio company was determined to be insignificant relative to the total investment portfolio. Upon completion of the Procedures, the Valuation Firms would reach a conclusion as to whether, with respect to each investment reviewed by each Valuation Firm, the fair value of those investments subjected to the Procedures appeared reasonable.
The total number of investments and the percentage of the investment portfolio on which the Procedures were performed, prior to the Transactions, are summarized below by period:
For the quarter ended: |
Total
companies
|
Percent of total
investments at
fair value(1)
|
||
March 31, 2016 |
18 |
27% |
||
June 30, 2016 |
19 |
30% |
||
September 30, 2016 |
19 |
33% |
||
December 31, 2016 |
20 |
33% |
||
March 31, 2017 |
18 |
30% |
||
June 30, 2017 |
20 |
29% |
||
September 30, 2017 |
22 |
25% |
||
December 31, 2017 |
21 |
35% |
||
March 31, 2018 |
14 |
24% |
||
June 30, 2018 |
23 |
47% |
||
(1) |
Exclusive of the fair value of new investments made during the quarter. |
F-29
Barings BDC, Inc.
Notes to Consolidated Financial Statements — (Continued)
Investment Valuation Process Subsequent to the Transactions
The Adviser has established a Pricing Committee that is responsible for the approval, implementation and oversight of the processes and methodologies that relate to the pricing and valuation of assets held by the Company. The Adviser uses internal pricing models, in accordance with internal pricing procedures established by the Adviser's Pricing Committee, to price an asset in the event an acceptable price cannot be obtained from an approved external source.
The Adviser reviews its valuation methodologies on an ongoing basis and updates are made accordingly to meet changes in the marketplace. The Adviser has established internal controls to ensure its validation process is operating in an effective manner. The Adviser (1) maintains valuation and pricing procedures that describe the specific methodology used for valuation and (2) approves and documents exceptions and overrides of valuations. In addition, the Pricing Committee performs an annual review of valuation methodologies.
The Company's money market fund investments are generally valued using Level 1 inputs and its syndicated senior secured loans are generally valued using Level 2 inputs. The Company's senior secured private middle-market debt investments will generally be valued using Level 3 inputs.
An independent valuation firm is engaged to perform the Procedures with respect to portfolio investments. The Procedures are generally performed with respect to each portfolio investment each quarter beginning in the quarter after the investment is made. In certain instances, the Company determines that it is not cost-effective, and as a result is not in the stockholders' best interest, to request independent valuation firms to perform the Procedures on certain portfolio investments. Such instances include, but are not limited to, situations where the fair value of the investment in the portfolio company is determined to be insignificant relative to the total investment portfolio.
The Company did not engage any independent valuation firms to perform the Procedures for the third quarter of 2018 as the Company's investment portfolio consisted primarily of newly-originated investments. Beginning in the fourth quarter of 2018, the Company engaged an independent valuation firm to perform the Procedures noted above with respect to certain of the Company's portfolio investments. For the quarter ended December 31, 2018, the independent valuation firm performed the Procedures on all five middle-market private debt investments that originated and settled during the third quarter of 2018. Finally, the Board has the responsibility for reviewing and approving, in good faith, the fair value of the Company’s investments in accordance with the 1940 Act.
Investment Valuation Inputs and Techniques
Currently, the Company's valuation techniques are based upon both observable and unobservable pricing inputs. Observable inputs reflect market data obtained from independent sources, while unobservable inputs reflect the Company's market assumptions. The Company's assessment of the significance of a particular input to the fair value measurement in its entirety requires judgment and considers factors specific to the financial instrument. The Company determines the estimated fair value of its loans and investments using primarily an income approach. Generally, a vendor is the preferred source of pricing a loan, however, to the extent the vendor price is unavailable or not relevant and reliable, the Company may use broker quotes. The Company attempts to maximize the use of observable inputs and minimize the use of unobservable inputs. The availability of observable inputs can vary from investment to investment and is affected by a wide variety of factors, including, the type of security, whether the security is new and not yet established in the marketplace, the liquidity of markets and other characteristics particular to the security.
Enterprise Value Waterfall Approach
In valuing equity securities, the Company estimates fair value using an "Enterprise Value Waterfall" valuation model. The Company estimates the enterprise value of a portfolio company and then allocates the enterprise value to the portfolio company’s securities in order of their relative liquidation preference. In addition, the model assumes that any outstanding debt or other securities that are senior to the Company’s equity securities are required to be
F-30
Barings BDC, Inc.
Notes to Consolidated Financial Statements — (Continued)
repaid at par. Generally, the waterfall proceeds flow from senior debt tranches of the capital structure to junior and subordinated debt, followed by each class or preferred stock and finally the common stock. Additionally, the Company may estimate the fair value of a debt security using the Enterprise Value Waterfall approach when the Company does not expect to receive full repayment.
To estimate the enterprise value of the portfolio company, the Company primarily uses a valuation model based on a transaction multiple, which generally is the original transaction multiple, and measures of the portfolio company’s financial performance. In addition, the Company considers other factors, including but not limited to (i) offers from third parties to purchase the portfolio company, (ii) the implied value of recent investments in the equity securities of the portfolio company, (iii) publicly available information regarding recent sales of private companies in comparable transactions and (iv) when the Company believes there are comparable companies that are publicly traded, the Company performs a review of these publicly traded companies and the market multiple of their equity securities. For certain non-performing assets, the Company may utilize the liquidation or collateral value of the portfolio company's assets in its estimation of enterprise value.
The significant Level 3 inputs to the Enterprise Value Waterfall model are (i) an appropriate transaction multiple and (ii) a measure of the portfolio company’s financial performance, which generally is either earnings before interest, taxes, depreciation and amortization, as adjusted ("Adjusted EBITDA") or revenues. Such inputs can be based on historical operating results, projections of future operating results or a combination thereof. The operating results of a portfolio company may be unaudited, projected or pro forma financial information and may require adjustments for certain non-recurring items. In determining the operating results input, the Company utilizes the most recent portfolio company financial statements and forecasts available as of the valuation date. The Company also consults with the portfolio company’s senior management to obtain updates on the portfolio company’s performance, including information such as industry trends, new product development, loss of customers and other operational issues.
Fair value measurements using the Enterprise Value Waterfall model can be sensitive to changes in one or more of the inputs. Assuming all other inputs to the Enterprise Value Waterfall model remain constant, any increase (decrease) in either the transaction multiple, Adjusted EBITDA or revenues for a particular equity security would result in a higher (lower) fair value for that security.
Income Approach
Prior to the Externalization Transaction, in valuing debt securities, the Company utilized an "Income Approach" model that considered factors including, but not limited to, (i) the stated yield on the debt security, (ii) the portfolio company’s current Adjusted EBITDA as compared to the portfolio company’s historical or projected Adjusted EBITDA as of the date the investment was made and the portfolio company’s anticipated Adjusted EBITDA for the next twelve months of operations, (iii) the portfolio company’s current Leverage Ratio (defined as the portfolio company’s total indebtedness divided by Adjusted EBITDA) as compared to its Leverage Ratio as of the date the investment was made, (iv) publicly available information regarding current pricing and credit metrics for similar proposed and executed investment transactions of private companies and (v) when the Company believes a relevant comparison exists, current pricing and credit metrics for similar proposed and executed investment transactions of publicly traded debt. In addition, the Company used a risk rating system to estimate the probability of default on the debt securities and the probability of loss if there is a default. This risk rating system covered both qualitative and quantitative aspects of the business and the securities held.
The Company considered the factors above, particularly any significant changes in the portfolio company’s results of operations and leverage, and developed an expectation of the yield that a hypothetical market participant would require when purchasing the debt investment (the "Required Rate of Return"). The Required Rate of Return, along with the Leverage Ratio and Adjusted EBITDA, were the significant Level 3 inputs to the Income Approach model. For investments where the Leverage Ratio and Adjusted EBITDA had not fluctuated significantly from the date the investment was made or had not fluctuated significantly from the Company’s expectations as of the date the
F-31
Barings BDC, Inc.
Notes to Consolidated Financial Statements — (Continued)
investment was made, and where there had been no significant fluctuations in the market pricing for such investments, the Company may have concluded that the Required Rate of Return was equal to the stated rate on the investment and therefore, the debt security was appropriately priced. In instances where the Company determined that the Required Rate of Return was different from the stated rate on the investment, the Company discounted the contractual cash flows on the debt instrument using the Required Rate of Return in order to estimate the fair value of the debt security.
Fair value measurements using the Income Approach model can be sensitive to changes in one or more of the inputs. Assuming all other inputs to the Income Approach model remain constant, any increase (decrease) in the Required Rate of Return or Leverage Ratio inputs for a particular debt security would result in a lower (higher) fair value for that security. Assuming all other inputs to the Income Approach model remain constant, any increase (decrease) in the Adjusted EBITDA input for a particular debt security would result in a higher (lower) fair value for that security.
Subsequent to the Transactions, the Company utilizes a similar Income Approach model in valuing its private debt investment portfolio, which consists of middle-market senior secured loans with floating reference rates. As vendor and broker quotes have not historically been consistently relevant and reliable, the fair value is determined using an internal index-based pricing model that takes into account both the movement in the spread of a performing credit index as well as changes in the credit profile of the borrower. The implicit yield for each debt investment is calculated at the date the investment is made. This calculation takes into account the acquisition price (par less any upfront fee) and the relative maturity assumptions of the underlying asset. As of each balance sheet date, the implied yield for each investment is reassessed, taking into account changes in the discount margin of the baseline index, probabilities of default and any changes in the credit profile of the issuer of the security, such as fluctuations in operating levels and leverage. If there is an observable price available on a comparable security/issuer, it is used to calibrate the internal model. The implied yield used within the model is considered a significant unobservable input. As such, these assets are generally classified within Level 3. If the valuation process for a particular debt investment results in a value above par, the value is typically capped at the greater of the principal amount plus any prepayment penalty in effect or 100% of par on the basis that a market participant is likely unwilling to pay a greater amount than that at which the borrower could refinance.
Market Approach
The Company values its syndicated senior secured loans using values provided by independent pricing services that have been approved by the Adviser's Pricing Committee. The prices received from these pricing service providers are based on yields or prices of securities of comparable quality, type, coupon and maturity and/or indications as to value from dealers and exchanges. The Company will seek to obtain two prices from the pricing services with one price representing the primary source and the other representing an independent control valuation. The Company evaluates the prices obtained from brokers or pricing vendors based on available market information, including trading activity of the subject or similar securities, or by performing a comparable security analysis to ensure that fair values are reasonably estimated. The Company also performs back-testing of valuation information obtained from pricing vendors and brokers against actual prices received in transactions. In addition to ongoing monitoring and back-testing, the Company performs due diligence procedures surrounding pricing vendors to understand their methodology and controls to support their use in the valuation process.
F-32
Barings BDC, Inc.
Notes to Consolidated Financial Statements — (Continued)
The ranges and weighted average values of the significant Level 3 inputs used in the valuation of the Company’s debt and equity securities at December 31, 2018 and 2017 are summarized as follows:
December 31, 2018: |
Fair Value(1)
|
Valuation Model |
Level 3 Input |
Range of Inputs |
Weighted Average |
||||||
Senior debt and 1st lien notes |
$ |
178,647,302 |
Income Approach |
Implied Spread |
4.9% – 7.0% |
5.8% |
|||||
66,964,957 |
Market Approach |
Pricing Service Quotes |
91.5% – 97.5% |
95.4% |
|||||||
Subordinated debt and 2nd lien notes |
7,679,132 |
Income Approach |
Implied Spread |
9.0% – 9.4% |
9.3% |
||||||
Equity shares |
515,825 |
Enterprise Value Waterfall Approach |
Adjusted EBITDA Multiple |
9.1x – 10.3x |
9.5x |
||||||
(1) |
One senior debt investment with a total fair value of $12,375,000 was valued using an unobservable market transaction.
|
December 31, 2017: |
Fair Value(1)
|
Valuation
Model
|
Level 3
Input
|
Range of
Inputs
|
Weighted
Average
|
||||||
Senior debt and 1st lien notes |
$ |
249,780,755 |
Income
Approach
|
Required Rate of Return |
6.8% – 25.0% |
10.8% |
|||||
Leverage Ratio |
0.6x – 8.5x |
4.4x |
|||||||||
Adjusted EBITDA |
$2.9 million – $142.4 million |
$16.2 million |
|||||||||
Subordinated debt and 2nd lien notes |
570,133,358 |
Income
Approach
|
Required Rate of Return |
8.9% – 15.1% |
11.7% |
||||||
Leverage Ratio |
0.0x – 7.1x |
4.6x |
|||||||||
Adjusted EBITDA |
$1.0 million – $1.0 billion |
$44.1 million |
|||||||||
Subordinated debt and 2nd lien notes |
12,981,000 |
Enterprise
Value Waterfall
Approach |
Adjusted EBITDA Multiple |
5.5x – 7.6x |
6.6x |
||||||
Adjusted EBITDA |
$1.7 million – $6.6 million |
$4.3 million |
|||||||||
Revenue Multiple |
0.8x – 0.8x |
0.8x |
|||||||||
Revenues |
$76.6 million – $76.6 million |
$76.6 million |
|||||||||
Equity shares and warrants |
163,666,691 |
Enterprise
Value Waterfall
Approach |
Adjusted EBITDA Multiple |
3.3x – 14.9x |
7.8x |
||||||
Adjusted EBITDA |
$1.0 million – $60.0 million |
$15.6 million |
|||||||||
Revenue Multiple |
0.8x – 3.0x |
1.3x |
|||||||||
Revenues |
$17.0 million – 76.6 million |
$53.7 million |
|||||||||
(1) |
One subordinated debt investment with a fair value of $6,434,000, one senior debt investment with a fair value of $13,022,542 and one equity security with a fair value of $266,000 were repaid or redeemed subsequent to the end of the reporting period and were valued at their transaction price.
|
Unsettled Purchases and Sales of Investments
Investment transactions are recorded based on the trade date of the transaction. As a result, unsettled purchases and sales are recorded as payables and receivables from unsettled transactions, respectively. While purchase and sales of the Company's syndicated senior secured loans generally settle on a T+7 basis, the settlement period will sometimes extend past the scheduled settlement. In such cases, the Company is contractually owed and recognizes
F-33
Barings BDC, Inc.
Notes to Consolidated Financial Statements — (Continued)
interest income equal to the applicable margin ("spread") beginning on the T+7 date. Such income is accrued as interest receivable and is collected upon settlement of the investment transaction.
Realized Gain or Loss and Unrealized Appreciation or Depreciation of Portfolio Investments
Realized gains or losses are recorded upon the sale or liquidation of investments and are calculated as the difference between the net proceeds from the sale or liquidation, if any, and the cost basis of the investment using the specific identification method. Unrealized appreciation or depreciation reflects the difference between the fair value of the investments and the cost basis of the investments.
Investment Classification
In accordance with the provisions of the 1940 Act, the Company classifies investments by level of control. As defined in the 1940 Act, "Control Investments" are investments in those companies that the Company is deemed to "Control." "Affiliate Investments" are investments in those companies that are "Affiliated Companies" of the Company, as defined in the 1940 Act, other than Control Investments. "Non-Control / Non-Affiliate Investments" are those that are neither Control Investments nor Affiliate Investments. Generally, under the 1940 Act, the Company is deemed to control a company in which it has invested if the Company owns more than 25.0% of the voting securities of such company, has greater than 50.0% representation on its board or has the power to exercise control over management or policies of such portfolio company. The Company is deemed to be an affiliate of a company in which the Company has invested if it owns at least 5.0%, but no more than 25.0%, of the voting securities of such company.
Short-Term Investments
Short-term investments represent investments in money market funds.
Deferred Financing Fees
Costs incurred to issue debt are capitalized and are amortized over the term of the debt agreements using the effective interest method.
Investment Income
Interest income, including amortization of premium and accretion of discount, is recorded on the accrual basis to the extent that such amounts are expected to be collected. Generally, when interest and/or principal payments on a loan become past due, or if the Company otherwise does not expect the borrower to be able to service its debt and other obligations, the Company will place the loan on non-accrual status and will generally cease recognizing interest income on that loan for financial reporting purposes, until all principal and interest have been brought current through payment or due to a restructuring such that the interest income is deemed to be collectible. The Company writes off any previously accrued and uncollected interest when it is determined that interest is no longer considered collectible. Dividend income is recorded on the ex-dividend date.
Payment-in-Kind Interest
As of December 31, 2018, the Company did not hold any investments that contain PIK interest provisions, however, the Company may hold such investments in the future. PIK interest, computed at the contractual rate specified in each loan agreement, is added to the principal balance of the loan, rather than being paid to the Company in cash, and is recorded as interest income. Thus, the actual collection of PIK interest may be deferred until the time of debt principal repayment.
PIK interest, which is a non-cash source of income at the time of recognition, is included in the Company’s taxable income and therefore affects the amount the Company is required to distribute to its stockholders to maintain its tax treatment as a RIC for federal income tax purposes, even though the Company has not yet collected the cash.
F-34
Barings BDC, Inc.
Notes to Consolidated Financial Statements — (Continued)
Generally, when current cash interest and/or principal payments on a loan become past due, or if the Company otherwise does not expect the borrower to be able to service its debt and other obligations, the Company will place the loan on non-accrual status and will generally cease recognizing PIK interest income on that loan for financial reporting purposes until all principal and interest have been brought current through payment or due to a restructuring such that the interest income is deemed to be collectible. The Company writes off any accrued and uncollected PIK interest when it is determined that the PIK interest is no longer collectible.
Fee Income
Origination, facility, commitment, consent and other advance fees received in connection with loan agreements ("Loan Origination Fees") are recorded as deferred income and recognized as investment income over the term of the loan. Upon prepayment of a loan, any unamortized Loan Origination Fees are recorded as investment income. In the general course of its business, the Company receives certain fees from portfolio companies, which are non-recurring in nature. Such fees include loan prepayment penalties, advisory, loan amendment and other fees, and are recorded as investment income when earned.
Fee income for the years ended December 31, 2018, 2017 and 2016 was as follows:
Years Ended December 31 |
|||||||||||
2018 |
2017 |
2016 |
|||||||||
Recurring Fee Income: |
|||||||||||
Amortization of loan origination fees |
$ |
1,374,049 |
$ |
2,445,485 |
$ |
2,161,711 |
|||||
Management, valuation and other fees |
427,628 |
940,361 |
1,024,213 |
||||||||
Total Recurring Fee Income |
1,801,677 |
3,385,846 |
3,185,924 |
||||||||
Non-Recurring Fee Income: |
|||||||||||
Prepayment fees |
1,191,943 |
2,688,814 |
1,903,251 |
||||||||
Acceleration of unamortized loan origination fees |
1,932,367 |
4,202,078 |
2,406,688 |
||||||||
Advisory, loan amendment and other fees |
242,914 |
371,278 |
890,002 |
||||||||
Total Non-Recurring Fee Income |
3,367,224 |
7,262,170 |
5,199,941 |
||||||||
Total Fee Income |
$ |
5,168,901 |
$ |
10,648,016 |
$ |
8,385,865 |
|||||
Compensation Expenses
Compensation expenses generally include salaries, discretionary compensation, equity-based compensation and benefits.
General and Administrative Expenses
General and administrative expenses include administrative costs, facilities costs, insurance, legal and accounting expenses, expenses reimbursable to the Adviser under the terms of the Administration Agreement and other costs related to operating as a publicly-traded company.
Income Taxes
The Company elected for federal income tax purposes to be treated as a RIC under the Internal Revenue Code of 1986, as amended (the “Code”) commencing with its taxable year ended December 31, 2007. In order to maintain its tax treatment as a RIC, the Company must meet certain minimum distribution, source-of-income and asset diversification requirements. If such requirements are met, then the Company is generally required to pay income taxes only on the portion of its taxable income and gains it does not distribute (actually or constructively) and certain built-in gains.
F-35
Barings BDC, Inc.
Notes to Consolidated Financial Statements — (Continued)
The Company has a wholly-owned taxable subsidiary (the “Taxable Subsidiary”), which holds certain of its portfolio investments that are listed on the Consolidated Schedule of Investments. The Taxable Subsidiary is consolidated for financial reporting purposes, such that the Company’s consolidated financial statements reflect the Company’s investments in the portfolio companies owned by the Taxable Subsidiary. The purpose of the Taxable Subsidiary is to permit the Company to hold certain portfolio companies that are organized as limited liability companies (“LLCs”) (or other forms of pass-through entities) and still satisfy the RIC tax requirement that at least 90% of the RIC’s gross income for income tax purposes must consist of qualifying investment income. Absent the Taxable Subsidiary, a proportionate amount of any gross income of an LLC (or other pass-through entity) portfolio investment would flow through directly to the RIC. To the extent that such income did not consist of qualifying investment income, it could jeopardize the Company’s ability to qualify as a RIC and therefore cause the Company to incur significant amounts of federal income taxes. When LLCs (or other pass-through entities) are owned by the Taxable Subsidiary, their income is taxed to the Taxable Subsidiary and does not flow through to the RIC, thereby helping the Company preserve its RIC tax treatment and resultant tax advantages. The Taxable Subsidiary is not consolidated for income tax purposes and may generate income tax expense or benefit as a result of their ownership of the portfolio companies. This income tax expense or benefit is reflected in the Company’s Consolidated Statements of Operations.
Segments
The Company lends to and invests in customers in various industries. The Company separately evaluates the performance of each of its lending and investment relationships. However, because each of these loan and investment relationships has similar business and economic characteristics, they have been aggregated into a single lending and investment segment. All applicable segment disclosures are included in or can be derived from the Company’s financial statements.
Concentration of Credit Risk
As of both December 31, 2018 and 2017, there were no individual investments representing greater than 10% of the fair value of the Company’s portfolio. As of December 31, 2018 and December 31, 2017, the Company’s largest single portfolio company investment represented approximately 2.2% and 5.6%, respectively, of the fair value of the Company’s portfolio. Income, consisting of interest, dividends, fees, other investment income and realization of gains or losses on equity interests, can fluctuate dramatically upon repayment of an investment or sale of an equity interest and in any given year can be highly concentrated among several portfolio companies.
As of December 31, 2018, $811.8 million of the Company's assets were (or will be pledged when the related investment purchase settles) as collateral for the August 2018 Credit Facility.
Public Offerings of Common Stock
On July 26, 2016, the Company filed a prospectus supplement pursuant to which 6,250,000 shares of common stock were offered for sale at a price to the public of $19.90 per share. In addition, the underwriters involved were granted an overallotment option to purchase an additional 937,500 shares of our common stock at the same public offering price. Pursuant to this offering, 6,742,362 shares (including 492,362 shares of the overallotment option shares) were sold and delivered resulting in net proceeds to the Company, after underwriting discounts and offering expenses, of approximately $129.1 million.
On February 28, 2017, the Company filed a prospectus supplement pursuant to which 7,000,000 shares of common stock were offered for sale at a price to the public of $19.50 per share. Pursuant to this offering, 7,000,000 shares were sold and delivered resulting in net proceeds to the Company, after underwriting discounts and offering expenses, of approximately $132.0 million.
F-36
Barings BDC, Inc.
Notes to Consolidated Financial Statements — (Continued)
Investments Denominated in Foreign Currency
As of December 31, 2018, the Company did not hold any investments that were denominated in foreign currencies. As of December 31, 2017, the Company held investments in two portfolio companies that were denominated in Canadian dollars.
At each balance sheet date, portfolio company investments denominated in foreign currencies are translated into United States dollars using the spot exchange rate on the last business day of the period. Purchases and sales of foreign portfolio company investments, and any income from such investments, are translated into United States dollars using the rates of exchange prevailing on the respective dates of such transactions.
Although the fair values of foreign portfolio company investments and the fluctuation in such fair values are translated into United States dollars using the applicable foreign exchange rates described above, the Company does not isolate that portion of the change in fair values resulting from foreign currency exchange rates fluctuations from the change in fair values of the underlying investment. All fluctuations in fair value are included in net unrealized appreciation (depreciation) of investments in the Company's Consolidated Statements of Operations.
Investments denominated in foreign currencies and foreign currency transactions may involve certain considerations and risks not typically associated with those of domestic origin, including unanticipated movements in the value of the foreign currency relative to the United States Dollar.
Dividends and Distributions
Dividends and distributions to common stockholders are approved by the Board and dividends payable are recorded on the ex-dividend date.
The Company has adopted a dividend reinvestment plan (“DRIP”) that provides for reinvestment of dividends on behalf of its stockholders, unless a stockholder elects to receive cash. As a result, when the Company declares a dividend, stockholders who have not opted out of the DRIP will have their dividends automatically reinvested in shares of the Company’s common stock, rather than receiving cash dividends.
The table below summarizes the Company’s dividends and distributions in the three years ended December 31, 2018:
Declared |
Record |
Payable |
Per Share
Amount
|
Amount
Paid in
Cash
|
Amount Settled via Newly Issued Shares |
Total |
||||||||||||||
February 24, 2016 |
March 9, 2016 |
March 23, 2016 |
$ |
0.54 |
$ |
17,264,000 |
$ |
844,000 |
$ |
18,108,000 |
||||||||||
May 4, 2016 |
June 8, 2016 |
June 22, 2016 |
0.45 |
14,369,000 |
746,000 |
15,115,000 |
||||||||||||||
August 24, 2016 |
September 7, 2016 |
September 21, 2016 |
0.45 |
17,430,000 |
736,000 |
18,166,000 |
||||||||||||||
November 23, 2016 |
December 7, 2016 |
December 21, 2016 |
0.45 |
17,413,000 |
750,000 |
18,163,000 |
||||||||||||||
Total 2016 dividends and distributions |
$ |
1.89 |
$ |
66,476,000 |
$ |
3,076,000 |
$ |
69,552,000 |
||||||||||||
February 22, 2017 |
March 8, 2017 |
March 22, 2017 |
$ |
0.45 |
$ |
20,688,000 |
$ |
750,000 |
$ |
21,438,000 |
||||||||||
May 3, 2017 |
June 7, 2017 |
June 21, 2017 |
0.45 |
20,575,000 |
888,000 |
21,463,000 |
||||||||||||||
August 2, 2017 |
September 6, 2017 |
September 20, 2017 |
0.45 |
21,484,000 |
— |
21,484,000 |
||||||||||||||
November 1, 2017 |
December 6, 2017 |
December 20, 2017 |
0.30 |
14,322,000 |
— |
14,322,000 |
||||||||||||||
Total 2017 dividends and distributions |
$ |
1.65 |
$ |
77,069,000 |
$ |
1,638,000 |
$ |
78,707,000 |
||||||||||||
February 28, 2018 |
March 14, 2018 |
March 28, 2018 |
$ |
0.30 |
$ |
14,407,000 |
$ |
— |
$ |
14,407,000 |
||||||||||
August 29, 2018 |
September 20, 2018 |
September 27, 2018 |
0.03 |
1,539,000 |
— |
1,539,000 |
||||||||||||||
October 11, 2018 |
December 14, 2018 |
December 21, 2018 |
0.10 |
5,128,000 |
— |
5,128,000 |
||||||||||||||
Total 2018 dividends and distributions |
$ |
0.43 |
$ |
21,074,000 |
$ |
— |
$ |
21,074,000 |
||||||||||||
F-37
Barings BDC, Inc.
Notes to Consolidated Financial Statements — (Continued)
Per Share Amounts
Per share amounts included in the Consolidated Statements of Operations are computed by dividing net investment income and net increase in net assets resulting from operations by the weighted average number of shares of common stock outstanding for the period. As the Company has no common stock equivalents outstanding, diluted per share amounts are the same as basic per share amounts. Net asset value per share is computed by dividing total net assets by the number of common shares outstanding as of the end of the period.
2. Agreements and Related Party Transactions
On August 2, 2018, the Company entered into the Advisory Agreement and the Administration Agreement with the Adviser, an investment adviser registered under the Investment Advisers Act of 1940, as amended. The Company’s then-current board of directors unanimously approved the Advisory Agreement at an in-person meeting on March 22, 2018. The Company’s stockholders approved the Advisory Agreement at the Special Meeting.
Advisory Agreement
Pursuant to the Advisory Agreement, the Adviser manages the Company's day-to-day operations and provides the Company with investment advisory services. Among other things, the Adviser (i) determines the composition of the portfolio of the Company, the nature and timing of the changes therein and the manner of implementing such changes; (ii) identifies, evaluates and negotiates the structure of the investments made by the Company; (iii) executes, closes, services and monitors the investments that the Company makes; (iv) determines the securities and other assets that the Company will purchase, retain or sell; (v) performs due diligence on prospective portfolio companies and (vi) provides the Company with such other investment advisory, research and related services as the Company may, from time to time, reasonably require for the investment of its funds.
The Advisory Agreement provides that, absent fraud, willful misfeasance, bad faith or gross negligence in the performance of its duties or by reason of the reckless disregard of its duties and obligations, the Adviser, and its officers, managers, partners, agents, employees, controlling persons, members and any other person or entity affiliated with the Adviser (collectively, the "IA Indemnified Parties"), are entitled to indemnification from the Company for any damages, liabilities, costs, demands, charges, claims and expenses (including reasonable attorneys’ fees and amounts reasonably paid in settlement) incurred by the IA Indemnified Parties in or by reason of any pending, threatened or completed action, suit, investigation or other proceeding (including an action or suit by or in the right of the Company or its security holders) arising out of any actions or omissions or otherwise based upon the performance of any of the Adviser’s duties or obligations under the Advisory Agreement or otherwise as an investment adviser of the Company. The Adviser’s services under the Advisory Agreement are not exclusive, and the Adviser is generally free to furnish similar services to other entities so long as its performance under the Advisory Agreement is not adversely affected.
Under the Advisory Agreement, the Company pays the Adviser (i) a base management fee (the "Base Management Fee") and (ii) an incentive fee (the "Incentive Fee") as compensation for the investment advisory and management services it provides the Company thereunder.
Base Management Fee
The Base Management Fee is calculated based on the Company’s gross assets, including assets purchased with borrowed funds or other forms of leverage and excluding cash and cash equivalents, at an annual rate of:
• |
1.0% for the period from August 2, 2018 through December 31, 2018; |
• |
1.125% for the period commencing on January 1, 2019 through December 31, 2019; and |
• |
1.375% for all periods thereafter. |
F-38
Barings BDC, Inc.
Notes to Consolidated Financial Statements — (Continued)
The Base Management Fee is payable quarterly in arrears on a calendar quarter basis. The Base Management Fee is calculated based on the average value of the Company’s gross assets, excluding cash and cash equivalents, at the end of the two most recently completed calendar quarters prior to the quarter for which such fees are being calculated. Base Management Fees for any partial month or quarter are appropriately pro-rated.
For the year ended December 31, 2018, the Base Management Fee determined in accordance with the terms of the Advisory Agreement was approximately $4.2 million. For the quarter ended September 30, 2018, the calculation of the Base Management Fee under the terms of the Advisory Agreement was based on the average of the Company's gross assets, excluding cash and cash equivalents, as of March 31, 2018 and June 30, 2018, both of which were dates prior to the consummation of the Transactions. For the quarter ended December 31, 2018, the calculation of the Base Management Fee under the terms of the Advisory Agreement was based on the average of the Company's gross assets, excluding cash and cash equivalents, as of June 30, 2018, which was prior to the Transactions, and September 30, 2018. In light of this fact, and in order to ensure that the Adviser did not earn a Management Fee on assets that it did not manage prior to the Transactions, the Adviser calculated the Base Management Fee for the quarter ended September 30, 2018 based on the Company's average gross assets as of August 2, 2018 and September 30, 2018, excluding (i) cash and cash equivalents, (ii) short-term investments, (iii) unsettled purchased investments and (iv) assets subject to participation agreements (the “Q3 2018 Adjusted Management Fee”). For the quarter ended December 31, 2018, the Adviser calculated the Base Management Fee based on the Company's average gross assets as of September 30, 2018 and December 31, 2018, excluding (i) cash and cash equivalents, (ii) short-term investments, (iii) unsettled purchased investments and (iv) assets subject to participation agreements (the “Q4 2018 Adjusted Management Fee,” and together with the Q3 2018 Adjusted Management Fee,” the “FY 2018 Adjusted Management Fee”). The Adviser voluntary agreed to waive the difference between the $4.2 million Base Management Fee calculated under the terms of the Advisory Agreement and the FY 2018 Adjusted Management Fee, which resulted in a net Base Management Fee of approximately $2.7 million for the year ended December 31, 2018 after taking into account a waiver of approximately $1.5 million based on the calculations noted above. The Company expects Barings to begin calculating the Management Fee in accordance with the terms of the Advisory Agreement, and without any additional waiver, starting with the quarter ending March 31, 2019.
Incentive Fee
The Incentive Fee is comprised of two parts: (1) a portion based on the Company’s pre-incentive fee net investment income (the "Income-Based Fee") and (2) a portion based on the net capital gains received on the Company’s portfolio of securities on a cumulative basis for each calendar year, net of all realized capital losses and all unrealized capital depreciation for that same calendar year (the "Capital Gains Fee"). The Company did not pay any Incentive Fee for the year ended December 31, 2018.
The Income-Based Fee is calculated as follows:
(i) |
For each quarter from and after August 2, 2018 through December 31, 2019 (the "Pre-2020 Period"), the Income-Based Fee is calculated and payable quarterly in arrears based on the Pre-Incentive Fee Net Investment Income for the immediately preceding calendar quarter for which such fees are being calculated. In respect of the Pre-2020 Period, "Pre-Incentive Fee Net Investment Income" means interest income, dividend income and any other income (including any other fees, such as commitment, origination, structuring, diligence, managerial assistance and consulting fees or other fees that the Company receives from portfolio companies) accrued during the relevant calendar quarter, minus the Company’s operating expenses for such quarter (including the Base Management Fee, expenses payable under the Administration Agreement, any interest expense and any dividends paid on any issued and outstanding preferred stock, but excluding the Incentive Fee). Pre-Incentive Fee Net Investment Income includes, in the case of investments with a deferred interest feature (such as original issue discount, debt instruments with payment-in-kind interest and zero coupon securities), accrued income not yet received in |
F-39
Barings BDC, Inc.
Notes to Consolidated Financial Statements — (Continued)
cash. Pre-Incentive Fee Net Investment Income does not include any realized capital gains, realized capital losses or unrealized capital appreciation or depreciation.
(ii) |
For each quarter beginning on and after January 1, 2020 (the "Post-2019 Period"), the Income-Based Fee will be calculated and payable quarterly in arrears based on the Pre-Incentive Fee Net Investment Income for the immediately preceding calendar quarter and the eleven preceding calendar quarters (or such fewer number of preceding calendar quarters counting each calendar quarter beginning on or after January 1, 2020) (each such period will be referred to as the "Trailing Twelve Quarters") for which such fees are being calculated and will be payable promptly following the filing of the Company’s financial statements for such quarter. In respect of the Post-2019 Period, "Pre-Incentive Fee Net Investment Income" means interest income, dividend income and any other income (including any other fees, such as commitment, origination, structuring, diligence, managerial assistance and consulting fees or other fees that the Company receives from portfolio companies) accrued during the relevant Trailing Twelve Quarters, minus the Company’s operating expenses for such Trailing Twelve Quarters (including the Base Management Fee, expenses payable under the Administration Agreement, any interest expense and any dividends paid on any issued and outstanding preferred stock, but excluding the Incentive Fee) divided by the number of quarters that comprise the relevant Trailing Twelve Quarters. Pre-Incentive Fee Net Investment Income includes, in the case of investments with a deferred interest feature (such as original issue discount, debt instruments with payment-in-kind interest and zero coupon securities), accrued income not yet received in cash. Pre-Incentive Fee Net Investment Income does not include any realized capital gains, realized capital losses or unrealized capital appreciation or depreciation. |
(iii) |
Pre-Incentive Fee Net Investment Income, expressed as a rate of return on the value of the Company’s net assets (defined as total assets less senior securities constituting indebtedness and preferred stock) at the end of the calendar quarter for which such fees are being calculated, is compared to a "hurdle rate", expressed as a rate of return on the value of the Company’s net assets at the end of the most recently completed calendar quarter, of 2% per quarter (8% annualized). The Company pays the Adviser the Income-Based Fee with respect to the Company’s Pre-Incentive Fee Net Investment Income in each calendar quarter as follows: |
(1) |
(a) With respect to the Pre-2020 Period, no Income-Based Fee for any calendar quarter in which the Company’s Pre-Incentive Fee Net Investment Income (as defined in paragraph (i) above) does not exceed the hurdle rate; |
(b) With respect to the Post-2019 Period, no Income-Based Fee for any calendar quarter in which the Company’s Pre-Incentive Fee Net Investment Income (as defined in paragraph (ii) above) does not exceed the hurdle rate;
(2) |
(a) With respect to the Pre-2020 Period, 100% of the Company’s Pre-Incentive Fee Net Investment Income (as defined in paragraph (i) above) for any calendar quarter with respect to that portion of the Pre-Incentive Fee Net Investment Income for such quarter, if any, that exceeds the hurdle rate but is less than 2.5% (10% annualized) (the "Pre-2020 Catch-Up Amount"). The Pre-2020 Catch-Up Amount is intended to provide the Adviser with an incentive fee of 20% on all of the Company’s Pre-Incentive Fee Net Investment Income (as defined in paragraph (i) above) when the Company’s Pre-Incentive Fee Net Investment Income (as defined in paragraph (i) above) reaches 2% per quarter (8% annualized); |
(b) With respect to the Post-2019 Period, 100% of the Company’s Pre-Incentive Fee Net Investment Income (as defined in paragraph (ii) above) with respect to that portion of the Pre-Incentive Fee Net Investment Income (as defined in paragraph (ii) above), if any, that exceeds the hurdle rate but is less than 2.5% (10% annualized) (the "Post-2019 Catch-Up Amount"). The Post-2019 Catch-Up Amount is intended to provide the Adviser with an incentive fee of 20% on all of the Company’s Pre-
F-40
Barings BDC, Inc.
Notes to Consolidated Financial Statements — (Continued)
Incentive Fee Net Investment Income (as defined in paragraph (ii) above) when the Company’s Pre-Incentive Fee Net Investment Income (as defined in paragraph (ii) above) reaches 2% per quarter (8% annualized);
(3) |
(a) With respect to the Pre-2020 Period, 20% of the amount of the Company’s Pre-Incentive Fee Net Investment Income (as defined in paragraph (i) above) for any calendar quarter with respect to that portion of the Pre-Incentive Fee Net Investment Income (as defined in paragraph (i) above) for such quarter, if any, that exceeds the Pre-2020 Catch-Up Amount; and |
(b) With respect to the Post-2019 Period, 20% of the amount of the Company’s Pre-Incentive Fee Net Investment Income (as defined in paragraph (ii) above) for any calendar quarter with respect to that portion of the Pre-Incentive Fee Net Investment Income (as defined in paragraph (ii) above), if any, that exceeds the Post-2019 Catch-Up Amount.
However, with respect to the Post-2019 Period, the Income-Based Fee paid to the Adviser will not be in excess of the Incentive Fee Cap. With respect to the Post-2019 Period, the "Incentive Fee Cap" for any quarter is an amount equal to (a) 20% of the Cumulative Net Return (as defined below) during the relevant Trailing Twelve Quarters minus (b) the aggregate Income-Based Fee that was paid in respect of the first eleven calendar quarters (or the portion thereof) included in the relevant Trailing Twelve Quarters.
Cumulative Net Return means (x) the aggregate net investment income in respect of the relevant Trailing Twelve Quarters minus (y) any Net Capital Loss (as defined below), if any, in respect of the relevant Trailing Twelve Quarters. If, in any quarter, the Incentive Fee Cap is zero or a negative value, the Company pays no Income-Based Fee to the Adviser for such quarter. If, in any quarter, the Incentive Fee Cap for such quarter is a positive value but is less than the Income-Based Fee that is payable to the Adviser for such quarter (before giving effect to the Incentive Fee Cap) calculated as described above, the Company pays an Income-Based Fee to the Adviser equal to the Incentive Fee Cap for such quarter. If, in any quarter, the Incentive Fee Cap for such quarter is equal to or greater than the Income-Based Fee that is payable to the Adviser for such quarter (before giving effect to the Incentive Fee Cap) calculated as described above, the Company pays an Income-Based Fee to the Adviser equal to the Income-Based Fee calculated as described above for such quarter without regard to the Incentive Fee Cap.
Net Capital Loss in respect of a particular period means the difference, if positive, between (i) aggregate capital losses, whether realized or unrealized, in such period and (ii) aggregate capital gains, whether realized or unrealized, in such period.
The Capital Gains Fee will be determined and payable in arrears as of the end of each calendar year (or upon termination of the Advisory Agreement), commencing with the calendar year ending on December 31, 2018, and is calculated at the end of each applicable year by subtracting (1) the sum of the Company’s cumulative aggregate realized capital losses and aggregate unrealized capital depreciation from (2) the Company’s cumulative aggregate realized capital gains, in each case calculated from August 2, 2018. If such amount is positive at the end of such year, then the Capital Gains Fee payable for such year is equal to 20% of such amount, less the cumulative aggregate amount of Capital Gains Fees paid in all prior years. If such amount is negative, then there is no Capital Gains Fee payable for such year. If the Advisory Agreement is terminated as of a date that is not a calendar year end, the termination date will be treated as though it were a calendar year end for purposes of calculating and paying a Capital Gains Fee.
Payment of Company Expenses
Under the Advisory Agreement, all investment professionals of the Adviser and its staff, when and to the extent engaged in providing services required to be provided by the Adviser under the Advisory Agreement, and the compensation and routine overhead expenses of such personnel allocable to such services, are provided and paid for by the Adviser and not by the Company, except that all costs and expenses of its operations and transactions, including, without limitation, those items listed in the Advisory Agreement, will be borne by the Company.
F-41
Barings BDC, Inc.
Notes to Consolidated Financial Statements — (Continued)
Duration and Termination of Advisory Agreement
The Advisory Agreement has an initial term of two years. Thereafter, it will continue to renew automatically for successive annual periods so long as such continuance is specifically approved at least annually by: (i) the vote of the Board, or by the vote of stockholders holding a majority of the outstanding voting securities of the Company; and (ii) the vote of a majority of the Company’s independent directors, in either case, in accordance with the requirements of the 1940 Act. The Advisory Agreement may be terminated at any time, without the payment of any penalty, upon 60 days’ written notice, by: (a) by vote of a majority of the Board or by vote of a majority of the outstanding voting securities of the Company (as defined in the 1940 Act); or (b) the Adviser. Furthermore, the Advisory Agreement will automatically terminate in the event of its "assignment" (as such term is defined for purposes of Section 15(a)(4) of the 1940 Act).
Administration Agreement
Under the terms of the Administration Agreement, the Adviser performs (or oversees, or arranges for, the performance of) the administrative services necessary for the operation of the Company, including, but not limited to, office facilities, equipment, clerical, bookkeeping and record-keeping services at such office facilities and such other services as the Adviser, subject to review by the Board, from time to time, determines to be necessary or useful to perform its obligations under the Administration Agreement. The Adviser also, on behalf of the Company and subject to the Board’s approval, arranges for the services of, and oversees, custodians, depositories, transfer agents, dividend disbursing agents, other stockholder servicing agents, accountants, attorneys, underwriters, brokers and dealers, corporate fiduciaries, insurers, banks and such other persons in any such other capacity deemed to be necessary or desirable.
The Company is required to reimburse the Adviser for the costs and expenses incurred by the Adviser in performing its obligations and providing personnel and facilities under the Administration Agreement, or such lesser amount as may be agreed to in writing by the Company and the Adviser from time to time. If the Company and the Adviser agree to a reimbursement amount for any period which is less than the full amount otherwise permitted under the Administration Agreement, then the Adviser will not be entitled to recoup any difference thereof in any subsequent period or otherwise. The costs and expenses incurred by the Adviser on behalf of the Company under the Administration Agreement include, but are not limited to:
• |
the allocable portion of the Adviser’s rent for the Company’s Chief Financial Officer and the Chief Compliance Officer and their respective staffs, which is based upon the allocable portion of the usage thereof by such personnel in connection with their performance of administrative services under the Administration Agreement; |
• |
the allocable portion of the salaries, bonuses, benefits and expenses of the Company’s Chief Financial Officer and Chief Compliance Officer and their respective staffs, which is based upon the allocable portion of the time spent by such personnel in connection with performing administrative services for the Company under the Administration Agreement; |
• |
the actual cost of goods and services used for the Company and obtained by the Adviser from entities not affiliated with the Company, which is reasonably allocated to the Company on the basis of assets, revenues, time records or other method conforming with generally accepted accounting principles; |
• |
all fees, costs and expenses associated with the engagement of a sub-administrator, if any; and |
• |
costs associated with (a) the monitoring and preparation of regulatory reporting, including registration statements and amendments thereto, prospectus supplements, and tax reporting, (b) the coordination and oversight of service provider activities and the direct cost of such contractual matters related thereto and (c) the preparation of all financial statements and the coordination and oversight of audits, regulatory inquiries, certifications and sub-certifications. |
F-42
Barings BDC, Inc.
Notes to Consolidated Financial Statements — (Continued)
During the year ended December 31, 2018, the Company incurred and was invoiced by the Adviser for expenses of approximately $0.5 million under the terms of the Administration Agreement. As of December 31, 2018, these administrative expenses were unpaid and included in "Accounts Payable and Accrued Liabilities" in the accompanying consolidated balance sheet.
The Administration Agreement has an initial term of two years, and thereafter will continue automatically for successive annual periods so long as such continuance is specifically approved at least annually by the Board, including a majority of the independent directors. The Administration Agreement may be terminated at any time, without the payment of any penalty, by vote of the directors of the Company, or by the Adviser, upon 60 days’ written notice to the other party. The Administration Agreement may not be assigned by a party without the consent of the other party.
3. Investments
Portfolio Composition
Prior to the Transactions, the Company historically invested primarily in senior and subordinated debt securities of privately-held, lower middle-market companies, generally secured by security interests in portfolio company assets. In addition, the Company could also invest in one or more equity instruments of the borrower, such as direct preferred or common equity interests. The Company's investments generally ranged from $5.0 million to $50.0 million per portfolio company.
Beginning August 2, 2018, the Adviser shifted the Company's investment focus to invest in syndicated senior secured loans, bonds and other fixed income securities. Over time, the Adviser expects to transition the Company's portfolio to senior secured private debt investments in performing, well-established middle-market businesses that operate across a wide range of industries. As of December 31, 2018, approximately $845.6 million, or 78.5% of the Company's investment portfolio (excluding the Company's investment in short-term money market funds), was invested in syndicated senior secured loans, and approximately $231.0 million, or 21.5% of the Company's investment portfolio (excluding the Company's investment in short-term money market funds) was invested in senior secured, middle-market, private debt investments. The Adviser's existing SEC exemptive relief under Sections 17(d) and 57(i) of the 1940 Act and Rule 17d-1 thereunder, granted on October 19, 2017, permits the Company and the Adviser's affiliated private funds and SEC-registered funds to co-invest in loans originated by the Adviser, which allows the Adviser to implement its senior secured private debt investment strategy for the Company on an accelerated timeline.
The Adviser employs fundamental credit analysis, and targets investments in businesses with relatively low levels of cyclicality and operating risk. The holding size of each position will generally be dependent upon a number of factors including total facility size, pricing and structure, and the number of other lenders in the facility. The Adviser has experience managing levered vehicles, both public and private, and will seek to enhance the Company’s returns through the use of leverage with a prudent approach that prioritizes capital preservation. The Adviser believes this strategy and approach offers attractive risk/return with lower volatility given the potential for fewer defaults and greater resilience through market cycles.
F-43
Barings BDC, Inc.
Notes to Consolidated Financial Statements — (Continued)
The cost basis of the Company's debt investments includes any unamortized purchased premium or discount, unamortized loan origination fees and payment-in-kind ("PIK") interest, if any. Summaries of the composition of the Company’s investment portfolio at cost and fair value, and as a percentage of total investments, are shown in the following tables:
Cost |
Percent of
Total
Portfolio
|
Fair Value |
Percent of
Total
Portfolio
|
Percent of
Total
Net Assets
|
|||||||||||||
December 31, 2018: |
|||||||||||||||||
Senior debt and 1st lien notes
|
$ |
1,120,401,043 |
95 |
% |
$ |
1,068,436,847 |
95 |
% |
190 |
% |
|||||||
Subordinated debt and 2nd lien notes
|
7,777,847 |
1 |
7,679,132 |
1 |
1 |
||||||||||||
Equity shares |
515,825 |
— |
515,825 |
— |
— |
||||||||||||
Short-term investments |
45,223,941 |
4 |
45,223,941 |
4 |
8 |
||||||||||||
$ |
1,173,918,656 |
100 |
% |
$ |
1,121,855,745 |
100 |
% |
199 |
% |
||||||||
December 31, 2017: |
|||||||||||||||||
Senior debt and 1st lien notes
|
$ |
275,088,787 |
25 |
% |
$ |
262,803,297 |
26 |
% |
41 |
% |
|||||||
Subordinated debt and 2nd lien notes
|
710,543,854 |
63 |
589,548,358 |
58 |
92 |
||||||||||||
Equity shares |
134,301,587 |
12 |
162,543,691 |
16 |
25 |
||||||||||||
Equity warrants |
1,691,617 |
— |
1,389,000 |
— |
— |
||||||||||||
$ |
1,121,625,845 |
100 |
% |
$ |
1,016,284,346 |
100 |
% |
158 |
% |
||||||||
During the year ended December 31, 2018, subsequent to the Transactions, the Company purchased $1,314.6 million in syndicated senior secured loans and made new investments in nineteen middle-market portfolio companies totaling $237.2 million, consisting of 17 senior secured private debt investments, two second lien private debt investments and two minority equity instruments. In addition, the Company invested $45.2 million, net, in money market fund investments during the year ended December 31, 2018, subsequent to the Transactions. Prior to the Transactions, in the year ended December 31, 2018, the Company made investments in 12 existing portfolio companies totaling approximately $30.7 million. During the year ended December 31, 2017, the Company made twenty-nine new investments, including recapitalizations of existing portfolio companies, totaling approximately $408.9 million, additional debt investments in eighteen existing portfolio companies of approximately $70.4 million and additional equity investments in eleven existing portfolio companies totaling approximately $4.4 million. During the year ended December 31, 2016, the Company made sixteen new investments, including recapitalizations of existing portfolio companies, totaling approximately $274.1 million, additional debt investments in eleven existing portfolio companies of approximately $37.8 million and additional equity investments in ten existing portfolio companies totaling approximately $7.5 million.
F-44
Barings BDC, Inc.
Notes to Consolidated Financial Statements — (Continued)
The industry composition of investments at fair value at December 31, 2018, excluding short-term investments, was as follows:
December 31, 2018 |
Percent of Portfolio |
||||
Aerospace and Defense |
$ |
28,944,709 |
2.7 |
% |
|
Automotive |
36,052,950 |
3.3 |
% |
||
Banking, Finance, Insurance and Real Estate |
97,220,907 |
9.0 |
% |
||
Beverage, Food and Tobacco |
30,978,576 |
2.9 |
% |
||
Capital Equipment |
46,630,026 |
4.3 |
% |
||
Chemicals, Plastics, and Rubber |
23,983,552 |
2.2 |
% |
||
Construction and Building |
29,157,682 |
2.7 |
% |
||
Consumer goods: Durable |
21,118,531 |
2.0 |
% |
||
Consumer goods: Non-durable |
25,025,317 |
2.3 |
% |
||
Containers, Packaging and Glass |
53,729,065 |
5.0 |
% |
||
Energy: Electricity |
17,682,349 |
1.6 |
% |
||
Energy: Oil and Gas |
17,872,908 |
1.7 |
% |
||
Healthcare and Pharmaceuticals |
143,160,276 |
13.3 |
% |
||
High Tech Industries |
93,740,806 |
8.7 |
% |
||
Hotel, Gaming and Leisure |
23,742,260 |
2.2 |
% |
||
Media: Advertising, Printing and Publishing |
30,315,332 |
2.8 |
% |
||
Media: Broadcasting and Subscription |
22,510,963 |
2.1 |
% |
||
Media: Diversified and Production |
15,325,025 |
1.4 |
% |
||
Metals and Mining |
5,944,424 |
0.6 |
% |
||
Retail |
53,507,322 |
5.0 |
% |
||
Services: Business |
107,136,887 |
10.0 |
% |
||
Services: Consumer |
31,122,421 |
2.9 |
% |
||
Telecommunications |
26,019,130 |
2.4 |
% |
||
Transportation: Cargo |
54,394,774 |
5.1 |
% |
||
Transportation: Consumer |
18,755,533 |
1.7 |
% |
||
Utilities: Electric |
10,656,505 |
1.0 |
% |
||
Utilities: Oil and Gas |
11,903,574 |
1.1 |
% |
||
Total |
$ |
1,076,631,804 |
100.0 |
% |
|
F-45
Barings BDC, Inc.
Notes to Consolidated Financial Statements — (Continued)
The following table presents the Company’s investment portfolio at fair value as of December 31, 2018 and 2017, categorized by the ASC Topic 820 valuation hierarchy, as previously described:
Fair Value at December 31, 2018 |
|||||||||||||||
Level 1 |
Level 2 |
Level 3 |
Total |
||||||||||||
Senior debt and 1st lien notes
|
$ |
— |
$ |
810,449,588 |
$ |
257,987,259 |
$ |
1,068,436,847 |
|||||||
Subordinated debt and 2nd lien notes
|
— |
— |
7,679,132 |
7,679,132 |
|||||||||||
Equity shares |
— |
— |
515,825 |
515,825 |
|||||||||||
Short-term investments |
45,223,941 |
— |
— |
45,223,941 |
|||||||||||
$ |
45,223,941 |
$ |
810,449,588 |
$ |
266,182,216 |
$ |
1,121,855,745 |
||||||||
Fair Value at December 31, 2017 |
|||||||||||||||
Level 1 |
Level 2 |
Level 3 |
Total |
||||||||||||
Senior debt and 1st lien notes
|
$ |
— |
$ |
— |
$ |
262,803,297 |
$ |
262,803,297 |
|||||||
Subordinated debt and 2nd lien notes
|
— |
— |
589,548,358 |
589,548,358 |
|||||||||||
Equity shares |
— |
— |
162,543,691 |
162,543,691 |
|||||||||||
Equity warrants |
— |
— |
1,389,000 |
1,389,000 |
|||||||||||
$ |
— |
$ |
— |
$ |
1,016,284,346 |
$ |
1,016,284,346 |
||||||||
The following tables reconcile the beginning and ending balances of the Company’s investment portfolio measured at fair value on a recurring basis using significant unobservable inputs (Level 3) for the years ended December 31, 2018 and 2017:
|
Year Ended
December 31, 2018:
|
Senior Debt
and 1st Lien
Notes
|
Subordinated
Debt and 2nd
Lien Notes
|
Equity
Shares
|
Equity
Warrants
|
Total |
||||||||||||||
Fair value, beginning of period |
$ |
262,803,297 |
$ |
589,548,358 |
$ |
162,543,691 |
$ |
1,389,000 |
$ |
1,016,284,346 |
|||||||||
New investments |
301,886,586 |
15,793,789 |
3,086,424 |
— |
320,766,799 |
||||||||||||||
Investment reclass |
8,617,000 |
(8,617,000 |
) |
— |
— |
— |
|||||||||||||
Proceeds from sales of investments |
(14,776,133 |
) |
— |
(36,265,416 |
) |
(708 |
) |
(51,042,257 |
) |
||||||||||
Proceeds from sales of investments to BSP |
(234,603,624 |
) |
(418,521,991 |
) |
(132,723,128 |
) |
(1,202,274 |
) |
(787,051,017 |
) |
|||||||||
Loan origination fees received |
(3,912,105 |
) |
(168,690 |
) |
— |
— |
(4,080,795 |
) |
|||||||||||
Principal repayments received |
(29,738,476 |
) |
(143,419,588 |
) |
— |
— |
(173,158,064 |
) |
|||||||||||
PIK interest earned |
259,414 |
3,517,139 |
— |
— |
3,776,553 |
||||||||||||||
PIK interest payments received |
(1,403,097 |
) |
(2,494,389 |
) |
— |
— |
(3,897,486 |
) |
|||||||||||
Accretion of loan discounts |
3,060 |
14,188 |
— |
— |
17,248 |
||||||||||||||
Accretion of deferred loan origination revenue |
608,807 |
2,697,059 |
— |
— |
3,305,866 |
||||||||||||||
Realized gain (loss) |
(42,949,422 |
) |
(147,889,422 |
) |
32,116,354 |
(488,635 |
) |
(159,211,125 |
) |
||||||||||
Unrealized appreciation (depreciation) |
11,191,952 |
117,219,679 |
(28,242,100 |
) |
302,617 |
100,472,148 |
|||||||||||||
Fair value, end of period |
$ |
257,987,259 |
$ |
7,679,132 |
$ |
515,825 |
$ |
— |
$ |
266,182,216 |
|||||||||
F-46
Barings BDC, Inc.
Notes to Consolidated Financial Statements — (Continued)
|
Year Ended
December 31, 2017:
|
Senior Debt
and 1st Lien
Notes
|
Subordinated
Debt and 2nd
Lien Notes
|
Equity
Shares
|
Equity
Warrants
|
Total |
||||||||||||||
Fair value, beginning of period |
$ |
191,643,157 |
$ |
690,159,367 |
$ |
154,216,657 |
$ |
1,888,000 |
$ |
1,037,907,181 |
|||||||||
New investments |
205,493,670 |
262,333,868 |
15,915,860 |
— |
483,743,398 |
||||||||||||||
Investment reclass |
(42,014,656 |
) |
33,614,656 |
8,400,000 |
— |
— |
|||||||||||||
Proceeds from sales of investments |
— |
— |
(29,065,946 |
) |
(550,863 |
) |
(29,616,809 |
) |
|||||||||||
Loan origination fees received |
(2,938,834 |
) |
(4,355,181 |
) |
— |
— |
(7,294,015 |
) |
|||||||||||
Principal repayments received |
(71,949,131 |
) |
(302,112,732 |
) |
— |
— |
(374,061,863 |
) |
|||||||||||
PIK interest earned |
1,001,142 |
9,916,389 |
— |
— |
10,917,531 |
||||||||||||||
PIK interest payments received |
(507,979 |
) |
(12,431,539 |
) |
— |
— |
(12,939,518 |
) |
|||||||||||
Accretion of loan discounts |
57,778 |
419,114 |
— |
— |
476,892 |
||||||||||||||
Accretion of deferred loan origination revenue |
1,490,694 |
4,846,747 |
— |
— |
6,337,441 |
||||||||||||||
Realized loss |
(14,160,007 |
) |
(35,323,325 |
) |
(1,473,134 |
) |
(1,912,237 |
) |
(52,868,703 |
) |
|||||||||
Unrealized appreciation (depreciation) |
(5,312,537 |
) |
(57,519,006 |
) |
14,550,254 |
1,964,100 |
(46,317,189 |
) |
|||||||||||
Fair value, end of period |
$ |
262,803,297 |
$ |
589,548,358 |
$ |
162,543,691 |
$ |
1,389,000 |
$ |
1,016,284,346 |
|||||||||
All realized and unrealized gains and losses are included in earnings (changes in net assets) and are reported on separate line items within the Company’s Consolidated Statements of Operations. Pre-tax net unrealized depreciation on investments of $52.1 million during the year ended December 31, 2018 was related to portfolio company investments that were still held by the Company as of December 31, 2018. Pre-tax net unrealized depreciation on investments of $93.0 million during the year ended December 31, 2017 were related to portfolio company investments that were still held by the Company as of December 31, 2017.
The Company’s primary investment objective is to generate current income by investing directly in privately-held middle-market companies to help these companies fund acquisitions, growth or refinancing. Exclusive of short-term investments, during the year ended December 31, 2018, the Company made investments of approximately $1.6 billion in portfolio companies to which it was not previously contractually committed to provide such financing. During the year ended December 31, 2018, the Company made investments of $11.4 million in companies to which it was previously committed to provide such financing.
During the year ended December 31, 2017, the Company made investments of approximately $471.1 million in portfolio companies to which it was not previously contractually committed to provide the financial support. During the year ended December 31, 2017, the Company made investments of $12.7 million in companies to which it was previously committed to provide the financial support. The details of the Company’s investments have been disclosed on the Consolidated Schedules of Investments.
F-47
Barings BDC, Inc.
Notes to Consolidated Financial Statements — (Continued)
4. Schedule of Investments in and Advances to Affiliates
The following schedules present information about investments in and advances to affiliates for the year ended December 31, 2018 and year ended December 31, 2017:
Year Ended December 31, 2018: |
Amount of Realized Gain (Loss) |
Amount of Unrealized Gain (Loss) |
Amount of Interest or Dividends Credited to Income(2) |
December 31, 2017
Value
|
Gross Additions
(3)
|
Gross Reductions (4) |
December 31, 2018
Value
|
|||||||||||||||
Portfolio Company |
Type of Investment(1) |
|||||||||||||||||||||
Control Investments: |
||||||||||||||||||||||
CRS-SPV, Inc. |
Common Stock (1,100 shares) |
$ |
(8,775,003 |
) |
$ |
(1,855,000 |
) |
$ |
100,000 |
$ |
20,283,000 |
$ |
— |
$ |
20,283,000 |
$ |
— |
|||||
(8,775,003 |
) |
(1,855,000 |
) |
100,000 |
20,283,000 |
— |
20,283,000 |
— |
||||||||||||||
Frank Entertainment Group, LLC |
Senior Note (6% Cash)(5)
|
(4,472,966 |
) |
4,205,494 |
— |
6,541,000 |
5,214,278 |
11,755,278 |
— |
|||||||||||||
Second Lien Term Note (2.5% Cash)(5)
|
(3,150,520 |
) |
2,879,479 |
— |
— |
3,183,307 |
3,183,307 |
— |
||||||||||||||
Redeemable Preferred Units (2,800,000 units) |
(2,800,000 |
) |
2,800,000 |
— |
— |
2,800,000 |
2,800,000 |
— |
||||||||||||||
Redeemable Class B Preferred Units (2,800,000 units) |
(2,800,000 |
) |
2,800,000 |
— |
— |
2,800,000 |
2,800,000 |
— |
||||||||||||||
Class A Common Units (606,552 units) |
(1,000,000 |
) |
1,000,000 |
— |
1,000,000 |
1,000,000 |
— |
|||||||||||||||
(14,223,486 |
) |
13,684,973 |
— |
6,541,000 |
14,997,585 |
21,538,585 |
— |
|||||||||||||||
FrontStream Holdings, LLC |
Subordinate Note (LIBOR + 6.0% Cash)(5)(6)
|
(6,650,730 |
) |
6,609,389 |
— |
7,414,000 |
9,709,389 |
17,123,389 |
— |
|||||||||||||
Common Stock (1,000 shares) |
(500,000 |
) |
500,000 |
— |
— |
500,000 |
500,000 |
— |
||||||||||||||
(7,150,730 |
) |
7,109,389 |
— |
7,414,000 |
10,209,389 |
17,623,389 |
— |
|||||||||||||||
Frontstreet Facility Solutions, Inc. |
Subordinated Note (13% Cash) |
(7,566,670 |
) |
4,697,172 |
652,624 |
3,750,000 |
4,712,628 |
8,462,628 |
— |
|||||||||||||
Series A Convertible Preferred Stock (60,000 shares) |
(250,575 |
) |
250,575 |
— |
— |
250,575 |
250,575 |
— |
||||||||||||||
Series B Convertible Preferred Stock (20,000 shares) |
(500,144 |
) |
500,144 |
— |
— |
500,144 |
500,144 |
— |
||||||||||||||
Common Stock (27,890 shares) |
(279 |
) |
279 |
— |
— |
279 |
279 |
— |
||||||||||||||
(8,317,668 |
) |
5,448,170 |
652,624 |
3,750,000 |
5,463,626 |
9,213,626 |
— |
|||||||||||||||
F-48
Barings BDC, Inc.
Notes to Consolidated Financial Statements — (Continued)
Year Ended December 31, 2018: |
Amount of Realized Gain (Loss) |
Amount of Unrealized Gain (Loss) |
Amount of Interest or Dividends Credited to Income(2) |
December 31, 2017
Value
|
Gross Additions
(3)
|
Gross Reductions (4) |
December 31, 2018
Value
|
|||||||||||||||
Portfolio Company |
Type of Investment(1) |
|||||||||||||||||||||
Investments not held at the end of the period |
$ |
(75,817 |
) |
$ |
— |
$ |
— |
$ |
— |
$ |
75,817 |
$ |
75,817 |
$ |
— |
|||||||
Total Control Investments |
(38,542,704 |
) |
24,387,532 |
752,624 |
37,988,000 |
30,746,417 |
68,734,417 |
— |
||||||||||||||
Affiliate Investments: |
||||||||||||||||||||||
All Metals Holding, LLC |
Subordinated Note (12% Cash, 1% PIK) |
101,129 |
(155,098 |
) |
149,598 |
6,434,000 |
162,778 |
6,596,778 |
— |
|||||||||||||
Units (318,977 units) |
(535,011 |
) |
527,331 |
— |
266,000 |
527,331 |
793,331 |
— |
||||||||||||||
(433,882 |
) |
372,233 |
149,598 |
6,700,000 |
690,109 |
7,390,109 |
— |
|||||||||||||||
Consolidated Lumber Holdings, LLC |
Class A Units (15,000 units) |
1,000,000 |
(3,000,000 |
) |
339,893 |
4,500,000 |
1,000,000 |
5,500,000 |
— |
|||||||||||||
1,000,000 |
(3,000,000 |
) |
339,893 |
4,500,000 |
1,000,000 |
5,500,000 |
— |
|||||||||||||||
FCL Holding SPV, LLC |
Class A Interest (24,873 units) |
413,760 |
(278,000 |
) |
302,294 |
570,000 |
413,760 |
983,760 |
— |
|||||||||||||
Class B Interest (48,427 units) |
— |
— |
— |
— |
— |
— |
— |
|||||||||||||||
Class B Interest (3,746 units) |
— |
— |
— |
— |
— |
— |
— |
|||||||||||||||
413,760 |
(278,000 |
) |
302,294 |
570,000 |
413,760 |
983,760 |
— |
|||||||||||||||
Mac Land Holdings, Inc. |
Common Stock (139 shares) |
(369,000 |
) |
369,000 |
— |
— |
369,000 |
369,000 |
— |
|||||||||||||
(369,000 |
) |
369,000 |
— |
— |
369,000 |
369,000 |
— |
|||||||||||||||
NB Products, Inc. |
Subordinated Note (12% Cash, 2% PIK) |
1,040,327 |
— |
2,125,986 |
23,308,085 |
1,374,840 |
24,682,925 |
— |
||||||||||||||
Jr. Subordinated Note (10% PIK) |
282,473 |
— |
325,662 |
5,114,592 |
609,514 |
5,724,106 |
— |
|||||||||||||||
Jr. Subordinated Bridge Note (20% PIK) |
72,836 |
— |
297,881 |
2,412,295 |
371,461 |
2,783,756 |
— |
|||||||||||||||
Series A Redeemable Senior Preferred Stock (7,839 shares) |
3,478,355 |
(2,768,352 |
) |
— |
10,390,000 |
3,478,355 |
13,868,355 |
— |
||||||||||||||
Common Stock (1,668,691 shares) |
34,666,262 |
(15,710,262 |
) |
— |
16,044,000 |
34,666,262 |
50,710,262 |
— |
||||||||||||||
39,540,253 |
(18,478,614 |
) |
2,749,529 |
57,268,972 |
40,500,432 |
97,769,404 |
— |
|||||||||||||||
Passport Food Group, LLC |
Senior Notes (LIBOR + 9.0% Cash)(6)
|
(7,234,021 |
) |
2,976,160 |
1,346,145 |
16,672,000 |
3,016,086 |
19,688,086 |
— |
|||||||||||||
Common Stock (20,000 shares) |
(2,000,000 |
) |
1,643,000 |
— |
357,000 |
1,643,000 |
2,000,000 |
— |
||||||||||||||
(9,234,021 |
) |
4,619,160 |
1,346,145 |
17,029,000 |
4,659,086 |
21,688,086 |
— |
|||||||||||||||
F-49
Barings BDC, Inc.
Notes to Consolidated Financial Statements — (Continued)
Year Ended December 31, 2018: |
Amount of Realized Gain (Loss) |
Amount of Unrealized Gain (Loss) |
Amount of Interest or Dividends Credited to Income(2) |
December 31, 2017
Value
|
Gross Additions
(3)
|
Gross Reductions (4) |
December 31, 2018
Value
|
|||||||||||||||
Portfolio Company |
Type of Investment(1) |
|||||||||||||||||||||
PCX Aerostructures, LLC |
Subordinated Note (6% Cash) |
$ |
(8,589,777 |
) |
$ |
8,670,000 |
$ |
1,353,746 |
$ |
22,574,000 |
$ |
9,495,146 |
$ |
32,069,146 |
$ |
— |
||||||
Subordinated Note (6% PIK) |
— |
211,286 |
5,068 |
548,000 |
216,354 |
764,354 |
— |
|||||||||||||||
Series A Preferred Stock (6,066 shares) |
(6,065,621 |
) |
6,065,621 |
— |
— |
6,065,621 |
6,065,621 |
— |
||||||||||||||
Series B Preferred Stock (1,411 shares) |
(1,410,514 |
) |
410,514 |
— |
— |
1,410,514 |
1,410,514 |
— |
||||||||||||||
Class A Common Stock (121,922 shares) |
(30,480 |
) |
30,480 |
— |
— |
30,480 |
30,480 |
— |
||||||||||||||
(16,096,392 |
) |
15,387,901 |
1,358,814 |
23,122,000 |
17,218,115 |
40,340,115 |
— |
|||||||||||||||
Team Waste, LLC |
Subordinated Note (10% Cash, 2% PIK) |
— |
— |
297,923 |
4,930,962 |
113,713 |
5,044,675 |
— |
||||||||||||||
Preferred Units (500,000 units) |
3,475,467 |
— |
— |
10,000,000 |
3,475,467 |
13,475,467 |
— |
|||||||||||||||
3,475,467 |
— |
297,923 |
14,930,962 |
3,589,180 |
18,520,142 |
— |
||||||||||||||||
Technology Crops, LLC |
Senior Notes (12% Cash)(5)
|
(8,493,169 |
) |
3,677,102 |
592,861 |
8,617,000 |
3,677,102 |
12,294,102 |
— |
|||||||||||||
Common Units (50 units) |
(500,000 |
) |
500,000 |
— |
— |
500,000 |
500,000 |
— |
||||||||||||||
(8,993,169 |
) |
4,177,102 |
592,861 |
8,617,000 |
4,177,102 |
12,794,102 |
— |
|||||||||||||||
TGaS Advisors, LLC |
Senior Note (10% Cash, 1% PIK) |
(282,587 |
) |
— |
648,832 |
9,431,015 |
91,895 |
9,522,910 |
— |
|||||||||||||
Preferred Units (1,685,357 units) |
206,638 |
32,069 |
— |
1,524,000 |
238,707 |
1,762,707 |
— |
|||||||||||||||
(75,949 |
) |
32,069 |
648,832 |
10,955,015 |
330,602 |
11,285,617 |
— |
|||||||||||||||
Tulcan Fund IV, L.P. |
Common Units (1,000,000 units) |
(950,000 |
) |
1,000,000 |
— |
— |
1,000,000 |
1,000,000 |
— |
|||||||||||||
(950,000 |
) |
1,000,000 |
— |
— |
1,000,000 |
1,000,000 |
— |
|||||||||||||||
United Retirement Plan Consultants, Inc. |
Series A Preferred Shares (9,400 shares) |
169,252 |
(96,252 |
) |
— |
302,000 |
169,252 |
471,252 |
— |
|||||||||||||
Common Shares (100,000 shares) |
(175,000 |
) |
581,000 |
— |
419,000 |
581,000 |
1,000,000 |
— |
||||||||||||||
(5,748 |
) |
484,748 |
— |
721,000 |
750,252 |
1,471,252 |
— |
|||||||||||||||
Wythe Will Tzetzo, LLC |
Series A Preferred Units (99,829 units) |
1,312,617 |
(2,688,000 |
) |
— |
2,688,000 |
1,312,617 |
4,000,617 |
— |
|||||||||||||
1,312,617 |
(2,688,000 |
) |
— |
2,688,000 |
1,312,617 |
4,000,617 |
— |
|||||||||||||||
F-50
Barings BDC, Inc.
Notes to Consolidated Financial Statements — (Continued)
Year Ended December 31, 2018: |
Amount of Realized Gain (Loss) |
Amount of Unrealized Gain (Loss) |
Amount of Interest or Dividends Credited to Income(2) |
December 31, 2017
Value
|
Gross Additions
(3)
|
Gross Reductions (4) |
December 31, 2018
Value
|
|||||||||||||||
Portfolio Company |
Type of Investment(1) |
|||||||||||||||||||||
Investments not held at the end of the period |
$ |
355,394 |
$ |
— |
$ |
— |
$ |
— |
$ |
473,234 |
$ |
473,234 |
$ |
— |
||||||||
Deferred taxes |
— |
1,199,969 |
— |
— |
— |
— |
— |
|||||||||||||||
Total Affiliate Investments |
$ |
9,939,330 |
$ |
3,197,568 |
$ |
7,785,889 |
$ |
147,101,949 |
$ |
76,483,489 |
$ |
223,585,438 |
$ |
— |
||||||||
(1) |
All debt investments are income producing, unless otherwise noted. Equity and equity-linked investments are non-income producing, unless otherwise noted. The fair values of all investments were determined using significant unobservable inputs. |
(2) |
Represents the total amount of interest, fees or dividends credited to income for the portion of the year an investment was included in Control or Affiliate categories, respectively. Amounts include accrued PIK interest if the description of the security includes disclosure of a PIK interest rate. |
(3) |
Gross additions include increases in the cost basis of investments resulting from new portfolio investments, follow-on investments and accrued PIK interest. Gross additions also include net increases in unrealized appreciation or net decreases in unrealized depreciation. |
(4) |
Gross reductions include decreases in the total cost basis of investments resulting from principal or PIK repayments or sales. Gross reductions also include net increases in unrealized depreciation or net decreases in unrealized appreciation. |
(5) |
Non-accrual investment. |
(6) |
Index-based floating interest rate is subject to contractual minimum interest rate. A majority of the variable rate loans in the Company's investment portfolio bear interest at a rate that may be determined by reference to either LIBOR or an alternate Base Rate (commonly based on the Federal Funds Rate or the Prime Rate), which typically resets semi-annually, quarterly, or monthly at the borrower's option. The borrower may also elect to have multiple interest reset periods for each loan. |
F-51
Barings BDC, Inc.
Notes to Consolidated Financial Statements — (Continued)
Year Ended December 31, 2017: |
Amount of Realized Gain (Loss) |
Amount of Unrealized Gain (Loss) |
Amount of Interest or Dividends Credited to Income(2) |
December 31, 2016
Value
|
Gross Additions
(3)
|
Gross Reductions (4) |
December 31, 2017
Value
|
|||||||||||||||
Portfolio Company |
Type of Investment(1) |
|||||||||||||||||||||
Control Investments: |
||||||||||||||||||||||
CRS Reprocessing, LLC |
Debtor in Possession Loan (8% PIK) |
$ |
(2,634,714 |
) |
$ |
— |
$ |
— |
$ |
— |
$ |
4,000,000 |
$ |
4,000,000 |
$ |
— |
||||||
Senior Notes (LIBOR + 3.5%)(6)
|
(1,938,339 |
) |
— |
79,534 |
2,942,769 |
— |
2,942,769 |
— |
||||||||||||||
Split Collateral Term Loans (8% Cash) |
(11,554,845 |
) |
5,010,464 |
513,963 |
6,182,000 |
11,360,464 |
17,542,464 |
— |
||||||||||||||
Subordinated Note (5% Cash) |
(82,335 |
) |
— |
— |
— |
125,000 |
125,000 |
— |
||||||||||||||
Series F Preferred Units (705,321 units) |
(9,134,807 |
) |
9,134,807 |
— |
— |
— |
— |
— |
||||||||||||||
Common Units (15,174 units) |
— |
— |
— |
— |
— |
— |
||||||||||||||||
(25,345,040 |
) |
14,145,271 |
593,497 |
9,124,769 |
15,485,464 |
24,610,233 |
— |
|||||||||||||||
CRS-SPV, Inc. |
Common Stock (1,100 shares) |
— |
1,855,000 |
— |
— |
20,283,000 |
— |
20,283,000 |
||||||||||||||
— |
1,855,000 |
— |
— |
20,283,000 |
— |
20,283,000 |
||||||||||||||||
DCWV Acquisition Corporation |
Senior Subordinated Note (15% PIK) |
(250,000 |
) |
— |
— |
250,000 |
— |
250,000 |
— |
|||||||||||||
Subordinated Note (12% Cash, 3% PIK) |
(4,396,350 |
) |
4,789,633 |
— |
1,389,000 |
4,789,633 |
6,178,633 |
— |
||||||||||||||
Jr. Subordinated Note (15% PIK) |
(2,000,000 |
) |
2,000,000 |
— |
— |
2,000,000 |
2,000,000 |
— |
||||||||||||||
Series A Preferred Equity (1,200 shares) |
(1,200,000 |
) |
1,200,000 |
— |
— |
1,200,000 |
1,200,000 |
— |
||||||||||||||
100% Common Shares |
— |
— |
— |
— |
— |
— |
— |
|||||||||||||||
(7,846,350 |
) |
7,989,633 |
— |
1,639,000 |
7,989,633 |
9,628,633 |
— |
|||||||||||||||
DialogDirect, Inc. |
Subordinated Note (8% PIK) |
(7,523,038 |
) |
6,640,226 |
— |
— |
20,020,227 |
20,020,227 |
— |
|||||||||||||
Class A Common Units (1,176,500 units) |
— |
— |
— |
— |
— |
— |
— |
|||||||||||||||
(7,523,038 |
) |
6,640,226 |
— |
— |
20,020,227 |
20,020,227 |
— |
|||||||||||||||
F-52
Barings BDC, Inc.
Notes to Consolidated Financial Statements — (Continued)
Year Ended December 31, 2017: |
Amount of Realized Gain (Loss) |
Amount of Unrealized Gain (Loss) |
Amount of Interest or Dividends Credited to Income(2) |
December 31, 2016
Value
|
Gross Additions
(3)
|
Gross Reductions (4) |
December 31, 2017
Value
|
|||||||||||||||
Portfolio Company |
Type of Investment(1) |
|||||||||||||||||||||
Frank Entertainment Group, LLC(7)
|
Senior Note (6% Cash)(5)
|
$ |
— |
$ |
(3,127,606 |
) |
$ |
— |
$ |
— |
$ |
9,808,054 |
$ |
3,267,054 |
$ |
6,541,000 |
||||||
Second Lien Term Note (2.5% Cash)(5)
|
— |
(2,705,479 |
) |
— |
— |
2,715,723 |
2,715,723 |
— |
||||||||||||||
Redeemable Preferred Units (2,800,000 units) |
— |
(1,074,000 |
) |
— |
— |
1,074,000 |
1,074,000 |
— |
||||||||||||||
Redeemable Class B Preferred Units (2,800,000 units) |
— |
— |
— |
— |
— |
— |
— |
|||||||||||||||
Class A Common Units (606,552 units) |
— |
— |
— |
— |
— |
— |
— |
|||||||||||||||
— |
(6,907,085 |
) |
— |
— |
13,597,777 |
7,056,777 |
6,541,000 |
|||||||||||||||
FrontStream Holdings, LLC |
Subordinate Note (LIBOR + 6%, 7.3% Cash) |
— |
348,542 |
— |
— |
7,663,542 |
249,542 |
7,414,000 |
||||||||||||||
Common Stock (1,000 shares) |
— |
— |
— |
— |
— |
— |
— |
|||||||||||||||
— |
348,542 |
— |
— |
7,663,542 |
249,542 |
7,414,000 |
||||||||||||||||
Frontstreet Facility Solutions, Inc. |
Subordinated Note (13% Cash) |
— |
(1,014,755 |
) |
569,586 |
— |
4,764,755 |
1,014,755 |
3,750,000 |
|||||||||||||
Series A Convertible Preferred Stock (60,000 shares) |
— |
(575 |
) |
— |
— |
575 |
575 |
— |
||||||||||||||
Series B Convertible Preferred Stock (20,000 shares) |
— |
(144 |
) |
— |
— |
144 |
144 |
— |
||||||||||||||
Common Stock (27,890 shares) |
— |
(279 |
) |
— |
— |
279 |
279 |
— |
||||||||||||||
— |
(1,015,753 |
) |
569,586 |
— |
4,765,753 |
1,015,753 |
3,750,000 |
|||||||||||||||
Gerli & Company |
Subordinated Note (13% Cash) |
(375,000 |
) |
375,000 |
— |
— |
375,000 |
375,000 |
— |
|||||||||||||
Subordinated Note (8.5% Cash) |
(3,000,000 |
) |
3,000,000 |
— |
— |
3,000,000 |
3,000,000 |
— |
||||||||||||||
Class A Preferred Shares (1,211 shares) |
(855,000 |
) |
855,000 |
— |
— |
855,000 |
855,000 |
— |
||||||||||||||
Class C Preferred Shares (744 shares) |
— |
— |
— |
— |
— |
— |
— |
|||||||||||||||
Class E Preferred Shares (400 shares) |
(161,440 |
) |
161,440 |
— |
— |
161,440 |
161,440 |
— |
||||||||||||||
Common Stock (300 shares) |
(100,000 |
) |
100,000 |
— |
— |
100,000 |
100,000 |
— |
||||||||||||||
(4,491,440 |
) |
4,491,440 |
— |
— |
4,491,440 |
4,491,440 |
— |
|||||||||||||||
SRC Worldwide, Inc. |
Common Stock (5,000 shares) |
— |
— |
400,000 |
8,028,000 |
— |
8,028,000 |
— |
||||||||||||||
— |
— |
400,000 |
8,028,000 |
— |
8,028,000 |
— |
||||||||||||||||
Total Control Investments |
(45,205,868 |
) |
27,547,274 |
1,563,083 |
18,791,769 |
94,296,836 |
75,100,605 |
37,988,000 |
||||||||||||||
F-53
Barings BDC, Inc.
Notes to Consolidated Financial Statements — (Continued)
Year Ended December 31, 2017: |
Amount of Realized Gain (Loss) |
Amount of Unrealized Gain (Loss) |
Amount of Interest or Dividends Credited to Income(2) |
December 31, 2016
Value
|
Gross Additions
(3)
|
Gross Reductions (4) |
December 31, 2017
Value
|
|||||||||||||||
Portfolio Company |
Type of Investment(1) |
|||||||||||||||||||||
Affiliate Investments: |
||||||||||||||||||||||
All Metals Holding, LLC |
Subordinated Note (12% Cash, 1% PIK) |
$ |
— |
$ |
155,098 |
$ |
878,223 |
$ |
6,249,220 |
$ |
249,113 |
$ |
64,333 |
$ |
6,434,000 |
|||||||
Units (318,977 units) |
— |
(488,000 |
) |
— |
754,000 |
— |
488,000 |
266,000 |
||||||||||||||
— |
(332,902 |
) |
878,223 |
7,003,220 |
249,113 |
552,333 |
6,700,000 |
|||||||||||||||
CIS Secure Computing Inc. |
Subordinated Note (12% Cash, 3% PIK) |
— |
— |
1,154,260 |
11,670,708 |
207,319 |
11,878,027 |
— |
||||||||||||||
Common Stock (84 shares) |
1,679,180 |
(1,652,680 |
) |
— |
2,155,000 |
1,679,181 |
3,834,181 |
— |
||||||||||||||
1,679,180 |
(1,652,680 |
) |
1,154,260 |
13,825,708 |
1,886,500 |
15,712,208 |
— |
|||||||||||||||
Consolidated Lumber Holdings, LLC |
Subordinated Note (10% Cash, 2% PIK) |
— |
(156,611 |
) |
194,082 |
4,278,000 |
78,750 |
4,356,750 |
— |
|||||||||||||
Class A Units (15,000 units) |
— |
2,019,000 |
274,167 |
2,481,000 |
2,019,000 |
— |
4,500,000 |
|||||||||||||||
— |
1,862,389 |
468,249 |
6,759,000 |
2,097,750 |
4,356,750 |
4,500,000 |
||||||||||||||||
DPII Holdings, LLC |
Tranche III Subordinated Note (19% PIK) |
(2,269,044 |
) |
871,000 |
— |
2,356,001 |
871,000 |
3,227,001 |
— |
|||||||||||||
Tranche I & II Subordinated Notes (12% Cash, 4% PIK) |
(462 |
) |
2,148,462 |
— |
— |
2,148,462 |
2,148,462 |
— |
||||||||||||||
Class A Membership Interest (17,308 units) |
(1,107,692 |
) |
1,107,692 |
— |
— |
1,107,692 |
1,107,692 |
— |
||||||||||||||
(3,377,198 |
) |
4,127,154 |
— |
2,356,001 |
4,127,154 |
6,483,155 |
— |
|||||||||||||||
FCL Holding SPV, LLC |
Class A Interest (24,873 units) |
— |
(75,000 |
) |
45,452 |
645,000 |
— |
75,000 |
570,000 |
|||||||||||||
Class B Interest (48,427 units) |
— |
(101,000 |
) |
— |
101,000 |
— |
101,000 |
— |
||||||||||||||
Class B Interest (3,746 units) |
— |
— |
— |
— |
— |
— |
||||||||||||||||
— |
(176,000 |
) |
45,452 |
746,000 |
— |
176,000 |
570,000 |
|||||||||||||||
F-54
Barings BDC, Inc.
Notes to Consolidated Financial Statements — (Continued)
Year Ended December 31, 2017: |
Amount of Realized Gain (Loss) |
Amount of Unrealized Gain (Loss) |
Amount of Interest or Dividends Credited to Income(2) |
December 31, 2016
Value
|
Gross Additions
(3)
|
Gross Reductions (4) |
December 31, 2017
Value
|
|||||||||||||||
Portfolio Company |
Type of Investment(1) |
|||||||||||||||||||||
Frank Entertainment Group, LLC(7)
|
Senior Note (LIBOR + 7%, 10% Cash, 5.8% PIK)(6)
|
$ |
— |
$ |
(1,077,888 |
) |
$ |
823,087 |
$ |
9,940,684 |
$ |
351,600 |
$ |
10,292,284 |
$ |
— |
||||||
Second Lien Term Note (10% Cash) |
— |
(174,000 |
) |
15,000 |
— |
1,200,000 |
1,200,000 |
— |
||||||||||||||
Class A Redeemable Preferred Units (10.5% Cash) (196,718 units) |
— |
(3,492,904 |
) |
— |
4,566,904 |
— |
4,566,904 |
— |
||||||||||||||
Class B Redeemable Preferred Units (18,667 units) |
— |
(1,660,810 |
) |
— |
1,660,810 |
— |
1,660,810 |
— |
||||||||||||||
Class C Redeemable Preferred Units (25,846 units) |
— |
(600,000 |
) |
— |
600,000 |
— |
600,000 |
— |
||||||||||||||
Class A Common Units (43,077 units) |
— |
— |
— |
— |
— |
— |
— |
|||||||||||||||
Class A Common Warrants |
— |
— |
— |
— |
— |
— |
— |
|||||||||||||||
— |
(7,005,602 |
) |
838,087 |
16,768,398 |
1,551,600 |
18,319,998 |
— |
|||||||||||||||
Mac Land Holdings, Inc. |
Common Stock (139 shares) |
— |
(369,000 |
) |
— |
— |
369,000 |
369,000 |
— |
|||||||||||||
— |
(369,000 |
) |
— |
— |
369,000 |
369,000 |
— |
|||||||||||||||
MS Bakery Holdings, Inc. |
Preferred Units (233 units) |
185,133 |
(185,133 |
) |
— |
397,000 |
185,133 |
582,133 |
— |
|||||||||||||
Common B Units (3,000 units) |
2,087,323 |
(2,086,860 |
) |
— |
2,110,000 |
2,087,323 |
4,197,323 |
— |
||||||||||||||
Common A Units (1,652 units) |
1,147,007 |
(1,147,007 |
) |
— |
1,162,000 |
1,147,007 |
2,309,007 |
— |
||||||||||||||
3,419,463 |
(3,419,000 |
) |
— |
3,669,000 |
3,419,463 |
7,088,463 |
— |
|||||||||||||||
Native Maine Operations, Inc. |
Senior Notes (LIBOR + 9%)(6)
|
— |
— |
1,338,898 |
— |
18,000,000 |
18,000,000 |
— |
||||||||||||||
Preferred Units (20,000 units) |
— |
— |
— |
— |
2,000,000 |
2,000,000 |
— |
|||||||||||||||
— |
— |
1,338,898 |
— |
20,000,000 |
20,000,000 |
— |
||||||||||||||||
NB Products, Inc. |
Subordinated Note (12% Cash, 2% PIK) |
— |
— |
3,540,905 |
22,751,190 |
556,895 |
— |
23,308,085 |
||||||||||||||
Jr. Subordinated Note (10% PIK) |
— |
— |
503,674 |
4,595,921 |
518,671 |
— |
5,114,592 |
|||||||||||||||
Jr. Subordinated Bridge Note (20% PIK) |
— |
— |
439,568 |
1,972,727 |
439,568 |
— |
2,412,295 |
|||||||||||||||
Series A Redeemable Senior Preferred Stock (7,839 shares) |
— |
978,000 |
— |
9,412,000 |
978,000 |
— |
10,390,000 |
|||||||||||||||
Common Stock (1,668,691 shares) |
— |
6,265,000 |
— |
9,779,000 |
6,265,000 |
— |
16,044,000 |
|||||||||||||||
— |
7,243,000 |
4,484,147 |
48,510,838 |
8,758,134 |
— |
57,268,972 |
||||||||||||||||
F-55
Barings BDC, Inc.
Notes to Consolidated Financial Statements — (Continued)
Year Ended December 31, 2017: |
Amount of Realized Gain (Loss) |
Amount of Unrealized Gain (Loss) |
Amount of Interest or Dividends Credited to Income(2) |
December 31, 2016
Value
|
Gross Additions
(3)
|
Gross Reductions (4) |
December 31, 2017
Value
|
|||||||||||||||
Portfolio Company |
Type of Investment(1) |
|||||||||||||||||||||
Passport Food Group, LLC |
Senior Notes (LIBOR + 9.0%, 10.3% Cash)(6)
|
$ |
— |
$ |
(2,976,160 |
) |
$ |
1,621,494 |
$ |
— |
$ |
19,648,160 |
$ |
2,976,160 |
$ |
16,672,000 |
||||||
Common Stock (20,000 shares) |
— |
(1,643,000 |
) |
— |
— |
2,000,000 |
1,643,000 |
357,000 |
||||||||||||||
— |
(4,619,160 |
) |
1,621,494 |
— |
21,648,160 |
4,619,160 |
17,029,000 |
|||||||||||||||
PCX Aerostructures, LLC |
Subordinated Note (10.5% Cash)(8)
|
— |
(1,481,848 |
) |
3,354,176 |
21,960,000 |
2,095,848 |
1,481,848 |
22,574,000 |
|||||||||||||
Subordinated Note (6% PIK)(8)
|
— |
(211,286 |
) |
— |
— |
759,286 |
211,286 |
548,000 |
||||||||||||||
Series A Preferred Stock (6,066 shares) |
— |
— |
— |
— |
— |
— |
— |
|||||||||||||||
Series B Preferred Stock (411 shares) |
— |
— |
— |
— |
— |
— |
— |
|||||||||||||||
Class A Common Stock (121,922 shares) |
— |
— |
— |
— |
— |
— |
— |
|||||||||||||||
— |
(1,693,134 |
) |
3,354,176 |
21,960,000 |
2,855,134 |
1,693,134 |
23,122,000 |
|||||||||||||||
Team Waste, LLC |
Subordinated Note (10% Cash, 2% PIK) |
— |
— |
171,863 |
— |
4,930,962 |
— |
4,930,962 |
||||||||||||||
Preferred Units (500,000 units) |
— |
— |
9,000 |
9,100,000 |
900,000 |
— |
10,000,000 |
|||||||||||||||
— |
— |
180,863 |
9,100,000 |
5,830,962 |
— |
14,930,962 |
||||||||||||||||
Technology Crops, LLC |
Subordinated Notes (12% Cash) |
— |
(3,677,102 |
) |
1,930,662 |
11,837,622 |
456,480 |
3,677,102 |
8,617,000 |
|||||||||||||
Common Units (50 units) |
— |
— |
— |
— |
— |
— |
— |
|||||||||||||||
— |
(3,677,102 |
) |
1,930,662 |
11,837,622 |
456,480 |
3,677,102 |
8,617,000 |
|||||||||||||||
TGaS Advisors, LLC |
Senior Note (10% Cash, 1% PIK) |
— |
— |
1,143,884 |
9,521,986 |
158,001 |
248,972 |
9,431,015 |
||||||||||||||
Preferred Units (1,685,357 units) |
— |
254,000 |
— |
1,270,000 |
254,000 |
— |
1,524,000 |
|||||||||||||||
— |
254,000 |
1,143,884 |
10,791,986 |
412,001 |
248,972 |
10,955,015 |
||||||||||||||||
Tulcan Fund IV, L.P. |
Common Units (1,000,000 units) |
— |
— |
— |
— |
— |
— |
— |
||||||||||||||
— |
— |
— |
— |
— |
— |
— |
||||||||||||||||
United Retirement Plan Consultants, Inc. |
Series A Preferred Shares (9,400 shares) |
— |
45,000 |
— |
257,000 |
45,000 |
— |
302,000 |
||||||||||||||
Common Shares (100,000 shares) |
— |
118,000 |
— |
301,000 |
118,000 |
— |
419,000 |
|||||||||||||||
— |
163,000 |
— |
558,000 |
163,000 |
— |
721,000 |
||||||||||||||||
F-56
Barings BDC, Inc.
Notes to Consolidated Financial Statements — (Continued)
Year Ended December 31, 2017: |
Amount of Realized Gain (Loss) |
Amount of Unrealized Gain (Loss) |
Amount of Interest or Dividends Credited to Income(2) |
December 31, 2016
Value
|
Gross Additions
(3)
|
Gross Reductions (4) |
December 31, 2017
Value
|
|||||||||||||||
Portfolio Company |
Type of Investment(1) |
|||||||||||||||||||||
Waste Recyclers Holdings, LLC |
Class A Preferred Units (280 units) |
$ |
(2,251,100 |
) |
$ |
2,251,100 |
$ |
— |
$ |
— |
$ |
2,251,100 |
$ |
2,251,100 |
$ |
— |
||||||
Class B Preferred Units (11,484,867 units) |
(2,935,218 |
) |
2,487,218 |
— |
817,000 |
2,487,218 |
3,304,218 |
— |
||||||||||||||
Common Unit Purchase Warrant (1,170,083 units) |
(748,900 |
) |
748,900 |
— |
— |
748,900 |
748,900 |
— |
||||||||||||||
Common Units (153,219 units) |
(180,783 |
) |
180,783 |
— |
— |
180,783 |
180,783 |
— |
||||||||||||||
(6,116,001 |
) |
5,668,001 |
— |
817,000 |
5,668,001 |
6,485,001 |
— |
|||||||||||||||
Wythe Will Tzetzo, LLC |
Series A Preferred Units (99,829 units) |
— |
(4,120,000 |
) |
— |
6,808,000 |
— |
4,120,000 |
2,688,000 |
|||||||||||||
— |
(4,120,000 |
) |
— |
6,808,000 |
— |
4,120,000 |
2,688,000 |
|||||||||||||||
Investments not held at the end of the period |
414,889 |
— |
— |
— |
414,889 |
414,889 |
— |
|||||||||||||||
Deferred taxes |
— |
390,990 |
— |
— |
— |
— |
— |
|||||||||||||||
Total Affiliate Investments |
$ |
(3,979,667 |
) |
$ |
(7,356,046 |
) |
$ |
17,438,395 |
$ |
161,510,773 |
$ |
79,907,341 |
$ |
94,316,165 |
$ |
147,101,949 |
||||||
(1) |
All debt investments are income producing, unless otherwise noted. Equity and equity-linked investments are non-income producing, unless otherwise noted. The fair values of all investments were determined using significant unobservable inputs. |
(2) |
Represents the total amount of interest, fees or dividends credited to income for the portion of the year an investment was included in Control or Affiliate categories, respectively. Amounts include accrued PIK interest if the description of the security includes disclosure of a PIK interest rate. |
(3) |
Gross additions include increases in the cost basis of investments resulting from new portfolio investments, follow-on investments and accrued PIK interest. Gross additions also include net increases in unrealized appreciation or net decreases in unrealized depreciation. |
(4) |
Gross reductions include decreases in the total cost basis of investments resulting from principal or PIK repayments or sales. Gross reductions also include net increases in unrealized depreciation or net decreases in unrealized appreciation. |
(5) |
Non-accrual investment. |
(6) |
Index-based floating interest rate is subject to contractual minimum interest rate. A majority of the variable rate loans in the Company's investment portfolio bear interest at a rate that may be determined by reference to either LIBOR or an alternate Base Rate (commonly based on the Federal Funds Rate or the Prime Rate), which typically resets semi-annually, quarterly, or monthly at the borrower's option. The borrower may also elect to have multiple interest reset periods for each loan. |
(7) |
During the year ended December 31, 2017, as a result of a balance sheet restructuring, Frank Entertainment Group, LLC moved from an affiliate investment to a control investment. |
(8) |
Effective February 9, 2018, the Company's debt investments in PCX Aerostructures, LLC were amended to provide for cash interest at all-in rate of 6% per annum. |
F-57
Barings BDC, Inc.
Notes to Consolidated Financial Statements — (Continued)
5. Borrowings
The Company had the following borrowings outstanding as of December 31, 2018 and 2017:
Issuance/Pooling Date |
Maturity Date |
Interest Rate as of December 31, 2018 |
December 31,
2018
|
December 31, 2017 |
||||||||
SBA-Guaranteed Debentures: |
||||||||||||
March 25, 2009 |
March 1, 2019 |
N/A |
$ |
— |
$ |
22,000,000 |
||||||
March 24, 2010 |
March 1, 2020 |
N/A |
— |
6,800,000 |
||||||||
September 22, 2010 |
September 1, 2020 |
N/A |
— |
32,590,000 |
||||||||
March 29, 2011 |
March 1, 2021 |
N/A |
— |
75,400,000 |
||||||||
September 21, 2011 |
September 1, 2021 |
N/A |
— |
19,100,000 |
||||||||
March 27, 2013 |
March 1, 2023 |
N/A |
— |
30,000,000 |
||||||||
September 24, 2014 |
September 1, 2024 |
N/A |
— |
31,310,000 |
||||||||
September 21, 2016 |
September 1, 2026 |
N/A |
— |
32,800,000 |
||||||||
Less: Deferred financing fees |
N/A |
— |
(3,678,875 |
) |
||||||||
Total SBA-Guaranteed Debentures |
$ |
— |
$ |
246,321,125 |
||||||||
Credit Facilities: |
||||||||||||
May 1, 2017 |
April 30, 2022 |
N/A |
$ |
— |
$ |
156,070,484 |
||||||
August 3, 2018 - Class A |
August 3, 2019 |
3.654% |
190,000,000 |
— |
||||||||
August 3, 2018 - Class A-1 |
August 3, 2020 |
3.654% |
380,000,000 |
— |
||||||||
Total Credit Facilities |
$ |
570,000,000 |
$ |
156,070,484 |
||||||||
Notes: |
||||||||||||
October 19, 2012 |
December 15, 2022 |
N/A |
— |
80,500,000 |
||||||||
February 6, 2015 |
March 15, 2022 |
N/A |
— |
86,250,000 |
||||||||
Less: Deferred financing fees |
— |
(3,341,699 |
) |
|||||||||
Total Notes |
$ |
— |
$ |
163,408,301 |
||||||||
SBA-Guaranteed Debentures
In connection with the Asset Sale Transaction, the Company repaid all of its outstanding SBA-guaranteed debentures and delivered necessary materials to the SBA to surrender the SBIC licenses held by Triangle SBIC, Triangle SBIC II, and Triangle SBIC III. The weighted average interest rate for all SBA-guaranteed debentures as of December 31, 2017 was 3.90%.
In addition to a one-time 1.0% fee on the total commitment from the SBA, the Company also paid one-time 2.425% fees on the amount of each SBA-guaranteed debenture issued. These fees were capitalized as deferred financing costs and were amortized over the term of the debt agreements using the effective interest method. Upon prepayment of each SBA-guaranteed debenture, the unamortized deferred financing costs related to the SBA-guaranteed debenture were written off and recognized as a loss on extinguishment of debt in the Consolidated Statements of Operations. During the year ended December 31, 2018, the Company recognized a loss on extinguishment of debt of $3.5 million related to the repayment of its outstanding SBA-guaranteed debentures.
The fair values of the SBA-guaranteed debentures were based on a market yield approach and current interest rates, which are Level 3 inputs to the market yield model. As of December 31, 2017, the carrying amounts and the fair values of the SBA-guaranteed debentures were approximately $246.3 million and $262.2 million, respectively.
F-58
Barings BDC, Inc.
Notes to Consolidated Financial Statements — (Continued)
May 2017 Credit Facility
In connection with the closing of the Asset Sale Transaction, the Company terminated its senior secured credit facility entered into in May 2015 and subsequently amended in May 2017 (the "May 2017 Credit Facility"), which resulted in a loss on the extinguishment of debt of $4.1 million. Under the May 2017 Credit Facility, the Company had the ability to borrow in both United States dollars as well as foreign currencies. The May 2017 Credit Facility, which was structured to operate like a revolving credit facility, was secured primarily by the Company's assets, excluding the assets of the Company’s wholly-owned SBIC subsidiaries. The May 2017 Credit Facility had an accordion feature that allowed for an increase in the total borrowing size up to $550.0 million, subject to certain conditions and the satisfaction of specified financial covenants.
Prior to the termination of the May 2017 Credit Facility, borrowings under the May 2017 Credit Facility bore interest, subject to the Company's election, on a per annum basis equal to (i) the applicable base rate plus 1.75% (or 1.50% if the Company received an investment grade credit rating), (ii) the applicable LIBOR rate plus 2.75% (or 2.50% if the Company received an investment grade credit rating) or (iii) for borrowings denominated in Canadian dollars, the applicable Canadian Dealer Offered Rate plus 2.75% (or 2.50% if the Company received an investment grade credit rating). The applicable base rate was equal to the greater of (i) the prime rate, (ii) the federal funds rate plus 0.5% or (iii) the adjusted one-month LIBOR plus 2.0%. The applicable LIBOR rate depended on the term of the draw under the May 2017 Credit Facility. The Company paid a commitment fee of 1.00% per annum on undrawn amounts if the used portion of the May 2017 Credit Facility was less than or equal to 25.0% of total commitments, or 0.375% per annum on undrawn amounts if the used portion of the May 2017 Credit Facility was greater than 25.0% of total commitments. These commitment fees are included in interest and other financing fees on the Company's Consolidated Statements of Operations. Borrowings under the May 2017 Credit Facility were limited to a borrowing base, which included certain cash and a portion of eligible debt investments.
As of December 31, 2017, the Company had United States dollar borrowings of $139.3 million outstanding under the May 2017 Credit Facility with an interest rate of 4.12% and non-United States dollar borrowings denominated in Canadian dollars of $21.0 million ($16.8 million United States dollars) outstanding under the May 2017 Credit Facility with a weighted average interest rate of 4.16%. The borrowings denominated in Canadian dollars were translated into United States dollars based on the spot rate at each balance sheet date. The impact resulting from changes in foreign exchange rates on the May 2017 Credit Facility borrowings is included in unrealized appreciation (depreciation) on foreign currency borrowings in the Company's Consolidated Statements of Operations.
The fair value of the borrowings outstanding under the May 2017 Credit Facility were based on a market yield approach and current interest rates, which were Level 3 inputs to the market yield model. As of December 31, 2017, the fair value of the borrowings outstanding under the May 2017 Credit Facility was $156.1 million.
The May 2017 Credit Facility contained certain affirmative and negative covenants, including but not limited to (i) maintaining a minimum interest coverage ratio, (ii) maintaining a minimum consolidated tangible net worth, (iii) maintaining a minimum asset coverage ratio and (iv) maintaining the Company's status as a RIC and as a BDC. The May 2017 Credit Facility also contained customary events of default with customary cure and notice provisions, including, without limitation, nonpayment, misrepresentation of representations and warranties in a material respect, breach of covenant, cross-default to other indebtedness, bankruptcy, change of control, and material adverse effect. The May 2017 Credit Facility also permitted Branch Banking and Trust Company, the administrative agent, to select an independent third-party valuation firm to determine valuations of certain portfolio investments for purposes of borrowing base provisions. As of December 31, 2017, the Company was in compliance with all covenants of the May 2017 Credit Facility.
F-59
Barings BDC, Inc.
Notes to Consolidated Financial Statements — (Continued)
August 2018 Credit Facility
On July 3, 2018, the Company formed Barings BDC Senior Funding I, LLC, an indirectly wholly-owned Delaware limited liability company (“BSF”), the primary purpose of which is to function as the Company's special purpose, bankruptcy-remote, financing subsidiary in connection with the August 2018 Credit Facility. On August 3, 2018, BSF entered into the August 2018 Credit Facility, as amended and restated from time to time, with Bank of America, N.A., as administrative agent (the "Administrative Agent") and Class A-1 Lender, Société Générale, as Class A Lender, and Bank of America Merrill Lynch, as sole lead arranger and sole book manager. BSF and the Administrative Agent also entered into a security agreement dated as of August 3, 2018 (the "Security Agreement") pursuant to which BSF’s obligations under the August 2018 Credit Facility are secured by a first-priority security interest in substantially all of the assets of BSF, including its portfolio of investments (the "Pledged Property"). In connection with the first-priority security interest established under the Security Agreement, all of the Pledged Property will be held in the custody of State Street Bank and Trust Company, as collateral administrator (the "Collateral Administrator"). The Collateral Administrator will maintain and perform certain collateral administration services with respect to the Pledged Property pursuant to a collateral administration agreement among BSF, the Administrative Agent and the Collateral Administrator. Generally, the Collateral Administrator will only be authorized to make distributions and payments from Pledged Property based on the written instructions of the Administrative Agent.
The August 2018 Credit Facility provides for borrowings in an aggregate amount up to $750,000,000, including up to $250,000,000 borrowed under the Class A Loan Commitments and up to $500,000,000 borrowed under the Class A-1 Loan Commitments. All borrowings under the August 2018 Credit Facility bear interest, subject to BSF’s election, on a per annum basis equal to (i) the applicable base rate plus the applicable spread or (ii) the applicable LIBOR rate plus the applicable spread. The applicable base rate is equal to the greater of (i) the federal funds rate plus 0.5%, (ii) the prime rate or (iii) one-month LIBOR plus 1.0%. The applicable LIBOR rate depends on the term of the borrowing under the August 2018 Credit Facility, which can be either one month or three months. BSF is required to pay commitment fees on the unused portion of the August 2018 Credit Facility beginning the ninetieth day after the closing date. BSF may prepay any borrowing at any time without premium or penalty, except that BSF may be liable for certain funding breakage fees if prepayments occur prior to expiration of the relevant interest period. BSF may also permanently reduce all or a portion of the commitment amount under the August 2018 Credit Facility without penalty after the six month anniversary of the closing date.
Any amounts borrowed under the Class A Loan Commitments will mature, and all accrued and unpaid interest thereunder will be due and payable, on August 3, 2019, or upon earlier termination of the August 2018 Credit Facility. Any amounts borrowed under the Class A-1 Loan Commitments will mature, and all accrued and unpaid interest thereunder will be due and payable, on August 3, 2020, or upon earlier termination of the August 2018 Credit Facility.
Borrowings under the August 2018 Credit Facility are subject to compliance with a borrowing base, pursuant to which the amount of funds advanced by the lenders to BSF will vary depending upon the types of assets in BSF’s portfolio. Assets must meet certain criteria to be included in the borrowing base, and the borrowing base is subject to certain portfolio restrictions including investment size, sector concentrations, investment type and credit ratings.
Under the August 2018 Credit Facility, BSF has made certain representations and warranties and is required to comply with various covenants, reporting requirements and other customary requirements for credit facilities of this nature. In addition to other customary events of default included in financing transactions, the August 2018 Credit Facility contains the following events of default: (a) the failure to make principal payments when due or interest payments within two business days of when due; (b) borrowings under the credit facility exceeding the applicable advance rates; (c) the purchase by BSF of certain ineligible assets; (d) the insolvency or bankruptcy of BSF; and (e) the decline of BSF’s net asset value below a specified threshold. During the continuation of an event of default, BSF must pay interest at a default rate. As of December 31, 2018, BSF was in compliance with all covenants under the August 2018 Credit Facility.
F-60
Barings BDC, Inc.
Notes to Consolidated Financial Statements — (Continued)
Borrowings of BSF will be considered borrowings by Barings BDC, Inc. for purposes of complying with the asset coverage requirements under the 1940 Act applicable to business development companies. The obligations of BSF under the August 2018 Credit Facility are non-recourse to Barings BDC, Inc.
As of December 31, 2018 BSF had borrowings of $570.0 million outstanding under the August 2018 Credit Facility. The fair values of the borrowings outstanding under the August 2018 Credit Facility are based on a market yield approach and current interest rates, which are Level 3 inputs to the market yield model. As of December 31, 2018, the total fair value of the borrowings outstanding under the August 2018 Credit Facility was $570.0 million.
Notes
In October 2012, the Company issued $70.0 million of unsecured notes due 2022 (the "December 2022 Notes") and in November 2012, issued $10.5 million of December 2022 Notes pursuant to the exercise of an over-allotment option. In connection with the closing of the Asset Sale Transaction, the Company caused notices to be issued to the holders of the December 2022 Notes regarding the redemption of the December 2022 Notes. The December 2022 Notes were redeemed in full on August 30, 2018 for a total redemption price of $80.5 million, which resulted in a loss on the extinguishment of debt of $1.4 million. Prior to the redemption, the December 2022 Notes bore interest at a rate of 6.375% per year payable quarterly on March 15, June 15, September 15 and December 15 of each year, beginning December 15, 2012. As of December 31, 2017, the carrying amount and fair value of the December 2022 Notes was $79.0 million and $80.9 million, respectively.
In February 2015, the Company issued $86.3 million of unsecured notes due 2022 (the "March 2022 Notes"). The net proceeds to the Company from the sale of the March 2022 Notes, after underwriting discounts and offering expenses, were approximately $83.4 million. In connection with the closing of the Asset Sale Transaction, the Company also caused notices to be issued to the holders of the March 2022 Notes regarding the redemption of all the March 2022 Notes. The March 2022 Notes were redeemed in full on August 30, 2018 for a total redemption price of $86.3 million, which resulted in a loss on the extinguishment of debt of $1.5 million. Prior to the redemption, the March 2022 Notes bore interest at a rate of 6.375% per year payable quarterly on March 15, June 15, September 15 and December 15 of each year, beginning March 15, 2015. As of December 31, 2017, the carrying amount and fair value of the March 2022 Notes were $84.4 million and $86.9 million. The fair values of the December 2022 Notes and the March 2022 Notes were based on the closing prices of each respective security on the New York Stock Exchange, which were Level 1 inputs under ASC 820.
The indenture and supplements thereto relating to the December 2022 Notes and the March 2022 Notes contained certain covenants, including but not limited to (i) a requirement that the Company comply with the asset coverage requirement of the 1940 Act or any successor provisions, after giving effect to any exemptive relief granted to the Company by the Securities and Exchange Commission ("SEC"), (ii) a requirement that the Company will not declare any cash dividend, or declare any other cash distribution, upon a class of its capital stock, or purchase any such capital stock, unless, in every such case, at the time of the declaration of any such dividend or distribution, or at the time of any such purchase, the Company has an asset coverage (as defined in the 1940 Act) of at least 200% after deducting the amount of such dividend, distribution or purchase price, as the case may be, giving effect to any exemptive relief granted to the Company by the SEC and (iii) a requirement to provide financial information to the holders of the notes and the trustee under the indenture if the Company should no longer be subject to the reporting requirements under the Securities Exchange Act of 1934, as amended (the "Exchange Act"). As of December 31, 2017, the Company was in compliance with all covenants of the December 2022 Notes and the March 2022 Notes.
F-61
Barings BDC, Inc.
Notes to Consolidated Financial Statements — (Continued)
6. Income Taxes
The Company has elected for federal income tax purposes to be treated as a RIC under the Code and intends to make the required distributions to its stockholders as specified therein. In order to maintain its tax treatment as a RIC, the Company must meet certain minimum distribution, source-of-income and asset diversification requirements. If such requirements are met, then the Company is generally required to pay taxes only on the portion of its taxable income and gains it does not distribute (actually or constructively) and certain built-in gains. The Company met its minimum distribution requirements for 2018, 2017 and 2016 and continually monitors its distribution requirements with the goal of ensuring compliance with the Code.
The minimum distribution requirements applicable to RICs require the Company to distribute to its stockholders at least 90% of its investment company taxable income (“ICTI”), as defined by the Code, each year. Depending on the level of ICTI earned in a tax year, the Company may choose to carry forward ICTI in excess of current year distributions into the next tax year and pay a 4% U.S. federal excise tax on such excess. Any such carryover ICTI must be distributed before the end of that next tax year through a dividend declared prior to filing the final tax return related to the year which generated such ICTI.
ICTI generally differs from net investment income for financial reporting purposes due to temporary and permanent differences in the recognition of income and expenses. The Company may be required to recognize ICTI in certain circumstances in which it does not receive cash. For example, if the Company holds debt obligations that are treated under applicable tax rules as having original issue discount (such as debt instruments issued with warrants), the Company must include in ICTI each year a portion of the original issue discount that accrues over the life of the obligation, regardless of whether cash representing such income is received by the Company in the same taxable year. The Company may also have to include in ICTI other amounts that it has not yet received in cash, such as (i) PIK interest income and (ii) interest income from investments that have been classified as non-accrual for financial reporting purposes. Interest income on non-accrual investments is not recognized for financial reporting purposes, but generally is recognized in ICTI. Because any original issue discount or other amounts accrued will be included in the Company’s ICTI for the year of accrual, the Company may be required to make a distribution to its stockholders in order to satisfy the minimum distribution requirements, even though the Company will not have received and may not ever receive any corresponding cash amount. ICTI also excludes net unrealized appreciation or depreciation, as investment gains or losses are not included in taxable income until they are realized.
Permanent differences between ICTI and net investment income for financial reporting purposes are reclassified among capital accounts in the consolidated financial statements to reflect their tax character. Differences in classification may also result from the treatment of short-term gains as ordinary income for tax purposes. During the years ended December 31, 2018, 2017 and 2016, the Company reclassified for book purposes amounts arising from permanent book/tax differences primarily related to differences in the tax basis and book basis of investments sold and non-deductible taxes paid during the year as follows:
December 31, |
||||||||||||
2018 |
2017 |
2016 |
||||||||||
Additional paid in capital |
$ |
5,085,295 |
$ |
(689,101 |
) |
$ |
(484,037 |
) |
||||
Total distributable earnings (loss) |
$ |
(5,085,295 |
) |
$ |
689,101 |
$ |
484,037 |
|||||
Tax positions taken or expected to be taken in the course of preparing the Company's tax returns are evaluated to determine whether the tax positions are “more-likely-than-not” of being sustained by the applicable tax authority. Tax positions not deemed to meet the more-likely-than not threshold would be recorded as a tax benefit or expense in the current year. Management has analyzed the Company's tax positions taken, or to be taken, on federal income tax returns for all open tax years (fiscal years 2015-2018), and has concluded that the provision for uncertain tax positions in the Company's financial statements is appropriate.
F-62
Barings BDC, Inc.
Notes to Consolidated Financial Statements — (Continued)
In addition, the Company has a wholly-owned taxable subsidiary (the “Taxable Subsidiary”), which holds certain portfolio investments that are listed on the Consolidated Schedules of Investments. The Taxable Subsidiary is consolidated for financial reporting purposes, such that the Company’s consolidated financial statements reflect the Company’s investments in the portfolio companies owned by the Taxable Subsidiary. The purpose of the Taxable Subsidiary is to permit the Company to hold certain portfolio companies that are organized as LLCs (or other forms of pass-through entities) and still satisfy the RIC tax requirement that at least 90% of the RIC’s gross revenue for income tax purposes must consist of qualifying investment income. Absent the Taxable Subsidiary, a proportionate amount of any gross income of an LLC (or other pass-through entity) portfolio investment would flow through directly to the RIC. To the extent that such income did not consist of qualifying investment income, it could jeopardize the Company’s ability to qualify as a RIC and therefore cause the Company to incur significant amounts of federal income taxes. When LLCs (or other pass-through entities) are owned by the Taxable Subsidiary, their income is taxed to the Taxable Subsidiary and does not flow through to the RIC, thereby helping the Company preserve its RIC tax treatment and resultant tax advantages. The Taxable Subsidiary is not consolidated for income tax purposes and may generate income tax expense as a result of their ownership of the portfolio companies. This income tax expense is reflected in the Company’s Consolidated Statements of Operations. Additionally, any unrealized appreciation related to portfolio investments held by the Taxable Subsidiary (net of unrealized depreciation related to portfolio investments held by the Taxable Subsidiary) is reflected net of applicable federal and state income taxes in the Company's Consolidated Statements of Operations, with the related deferred tax liabilities included in "Accounts Payable and Accrued Liabilities" in the Company's Consolidated Balance Sheets.
In December 2017, the United States enacted tax reform legislation through the bill commonly known as the Tax Cuts and Jobs Act (the "Tax Act"), which significantly changed the existing U.S. tax laws, including a reduction in the corporate tax rate from 35% to 21%, a move from a worldwide tax system to a territorial system, as well as other changes. The Taxable Subsidiary's provisional tax is based on the new lower blended federal and state corporate tax rate of 26%. The implementation of the Tax Act did not have a material impact on the Company's financial position and results of operations.
For income tax purposes, distributions paid to stockholders are reported as ordinary income, long-term capital gains, return of capital or a combination thereof. The tax character of distributions paid for the years ended December 31, 2018, 2017 and 2016 was as follows:
Year Ended December 31, |
||||||||||||
2018 |
2017 |
2016 |
||||||||||
Ordinary income |
$ |
19,960,181 |
$ |
77,484,420 |
$ |
68,239,124 |
||||||
Tax return of capital |
$ |
850,745 |
$ |
— |
$ |
— |
||||||
Distributions on a tax basis |
$ |
20,810,926 |
$ |
77,484,420 |
$ |
68,239,124 |
||||||
The Company may retain some or all of its realized net long-term capital gains in excess of realized net short-term capital losses and may designate the retained net capital gain as a “deemed distribution.” In that case, among other consequences, the Company will pay tax on the retained amount, each U.S. stockholder will be required to include his, her or its share of the deemed distribution in income as if it had been actually distributed to the U.S. stockholder, and the U.S. stockholder will be entitled to claim a credit equal to his, her or its allocable share of the tax paid thereon by us. For the years ended December 31, 2018, 2017 and 2016 the Company did not elect to designate retained net capital gains as deemed distributions.
At December 31, 2018, 2017 and 2016, the components of distributable earnings on a tax basis detailed below differ from the amounts reflected in the Company’s Consolidated Balance Sheets by temporary and other book/tax differences, primarily relating to depreciation expense, stock-based compensation, accruals of defaulted debt
F-63
Barings BDC, Inc.
Notes to Consolidated Financial Statements — (Continued)
investment interest and the tax treatment of certain partnership investments, as follows:
December 31, |
||||||||||||
2018 |
2017 |
2016 |
||||||||||
Undistributed net investment income |
$ |
— |
$ |
18,384,766 |
$ |
13,510,440 |
||||||
Accumulated capital gains (losses) |
(272,527,795 |
) |
(87,489,121 |
) |
(37,164,237 |
) |
||||||
Other permanent differences relating to the Company's formation |
1,975,543 |
1,975,543 |
1,975,543 |
|||||||||
Other temporary differences |
(12,896 |
) |
(7,410,910 |
) |
(4,816,603 |
) |
||||||
Unrealized depreciation |
(51,413,098 |
) |
(107,847,526 |
) |
(49,224,340 |
) |
||||||
Components of distributable earnings at year end |
$ |
(321,978,246 |
) |
$ |
(182,387,248 |
) |
$ |
(75,719,197 |
) |
|||
Under current law, the Company may carry forward net capital losses indefinitely to use to offset capital gains realized in future years. Capital losses realized under current law will carry forward retaining their classification as long-term or short-term losses. As of December 31, 2018, the Company had $272.4 million of long-term capital losses and $0.1 million of short-term capital losses, none of which will expire.
For federal income tax purposes, the cost of investments owned as of December 31, 2018 and December 31, 2017 was approximately $1,173.3 million and $1,123.7 million, respectively. As of December 31, 2018, net unrealized depreciation on the Company's investments (tax basis) was approximately $51.4 million, consisting of gross unrealized appreciation, where the fair value of the Company's investments exceeds their tax cost, of approximately $1.6 million and gross unrealized depreciation, where the tax cost of the Company's investments exceeds their fair value, of approximately $53.0 million. The cost of investments owned (tax basis) listed above does not include the RIC's basis in the Taxable Subsidiary. As of December 31, 2018, the cost (tax basis) of the RIC's investment in the Taxable Subsidiary was approximately $20.6 million. As of December 31, 2017, net unrealized depreciation on the Company's investments (tax basis) was approximately $107.8 million, consisting of gross unrealized appreciation, where the fair value of the Company's investments exceeds their tax cost, of approximately $89.2 million and gross unrealized depreciation, where the tax cost of the Company's investments exceeds their fair value, of approximately $197.0 million.
7. Equity-Based and Other Compensation Plans
In February 2017, both the compensation committee of the Board and the Board adopted the Triangle Capital Corporation Omnibus Incentive Plan (the "Omnibus Plan"), and in May 2017, the Company’s stockholders approved the Omnibus Plan at the Company’s 2017 Annual Meeting of Stockholders. Prior to the approval of the Omnibus Plan, the Company compensated its professionals through two separate plans: the Amended and Restated 2007 Equity Incentive Plan (the "Equity Incentive Plan"), which provided for grants of restricted stock and options to employees, officers and directors, and the 2012 Executive Cash Incentive Plan (the "Cash Incentive Plan"), which provided for the payment of cash bonuses to employees and officers. The Omnibus Plan was created primarily for the purpose of combining the Equity Incentive Plan and the Cash Incentive Plan in order to reduce the administrative burden of monitoring the terms and conditions of two separate plans. The terms of the Equity Incentive Plan and the Cash Incentive Plan, as combined and reflected in the Omnibus Plan, are substantially similar to the respective terms of each standalone plan.
The Omnibus Plan provided for grants of restricted stock, incentive stock options, non-statutory stock options and cash-based and/or stock-based performance awards, collectively, "Awards," to the Company’s existing and future employees. Equity-based awards granted under the Omnibus Plan to independent directors generally vested over a one-year period and equity-based awards granted under the Omnibus Plan to executive officers and employees generally vested ratably over a four-year period. In addition, the Omnibus Plan increased the maximum number of shares of the Company’s common stock with respect to which Awards could be granted under the
F-64
Barings BDC, Inc.
Notes to Consolidated Financial Statements — (Continued)
Omnibus Plan to 4,000,000 shares of the Company’s common stock from 2,400,000 shares of the Company’s common stock that were approved under the Equity Incentive Plan.
The Company accounted for its equity-based compensation using the fair value method, as prescribed by ASC Topic 718, Stock Compensation. Accordingly, for restricted stock awards, the Company measured the grant date fair value based upon the market price of the Company’s common stock on the date of the grant and amortized this fair value to compensation expense ratably over the requisite service period or vesting term.
On July 31, 2018, in connection with the closing of the Asset Sale Transaction, all 904,060 outstanding shares of restricted stock outstanding under the Omnibus Plan vested and on August 2, 2018, the Board terminated the Omnibus Plan. As a result, in the year ended December 31, 2018, the Company recognized equity based compensation expense of approximately $14.2 million. In the year ended December 31, 2017, the Company recognized equity-based compensation expense of approximately $6.0 million. In the year ended December 31, 2016, the Company recognized equity-based compensation expense of approximately $10.3 million, $2.7 million of which related to the accelerated vesting of outstanding shares of restricted stock of the Company's former Chief Executive Officer, Garland S. Tucker, III, who retired from his officer positions in February 2016 and $1.4 million of which related to the accelerated vesting of outstanding shares of restricted stock of Brent P.W. Burgess, the Company's former Chief Investment Officer, who resigned from his position in October 2016.
The following table presents information with respect to equity-based compensation for the years ended December 31, 2018, 2017 and 2016:
Year Ended December 31, |
|||||||||||||||||||||
2018 |
2017 |
2016 |
|||||||||||||||||||
|
Number
of Shares
|
Weighted Average
Grant Date Fair
Value per Share
|
Number
of Shares
|
Weighted Average
Grant Date Fair
Value per Share
|
Number
of Shares
|
Weighted Average
Grant Date Fair
Value per Share
|
||||||||||||||||
Unvested shares, beginning of period |
748,674 |
$ |
19.79 |
631,622 |
$ |
21.23 |
778,116 |
$ |
24.10 |
||||||||||||
Shares granted during the period |
435,106 |
$ |
10.73 |
360,470 |
$ |
19.22 |
364,605 |
$ |
17.56 |
||||||||||||
Shares vested during the period |
(1,183,780 |
) |
$ |
16.46 |
(243,418 |
) |
$ |
22.69 |
(511,099 |
) |
$ |
22.98 |
|||||||||
Unvested shares, end of period |
— |
N/A |
748,674 |
$ |
19.79 |
631,622 |
$ |
21.23 |
|||||||||||||
Prior to the Asset Sale Transaction, the Board had adopted a nonqualified deferred compensation plan covering the Company’s executive officers and key employees. Any compensation deferred and the Company’s contributions earned a return based on the returns on certain investments designated by the Compensation Committee of the Board. Participants were 100% vested in amounts deferred under the deferred compensation plan and the earnings thereon. Contributions to the plan and earnings thereon generally vested ratably over a four-year period. On July 31, 2018, in connection with the closing of the Asset Sale Transaction, the Company's Amended and Restated Executive Deferred Compensation Plan was terminated and all previously unvested deferred compensation benefits became fully vested. As a result, in the year ended December 31, 2018, the Company accelerated the recognition of the remaining $0.8 million of deferred compensation expense.
Prior to the Asset Sale Transaction, the Company maintained a 401(k) plan in which all full-time employees who were at least 21 years of age were eligible to participate and receive employer contributions. Eligible employees could contribute a portion of their compensation on a pretax basis into the 401(k) plan up to the maximum amount allowed under the Code, and direct the investment of their contributions. On July 31, 2018, the
F-65
Barings BDC, Inc.
Notes to Consolidated Financial Statements — (Continued)
Board took action to terminate the Company's 401(k) plan in connection with the closing of the Asset Sale Transaction.
8. Transactions with Controlled Companies
During the year ended December 31, 2018, the Company received management and other fees from SRC Worldwide, Inc., a wholly-owned subsidiary of CRS-SPV, Inc., of $100,000. During both the years ended December 31, 2017 and 2016, the Company received management and other fees from SRC Worldwide, Inc. totaling $400,000. These fees were recognized as fee income in the Company's Consolidated Statements of Operations. In addition, during each of the years ended December 31, 2018, 2017 and 2016, the Company recognized dividend and interest income from control investments as disclosed in Note 4 - Schedule of Investments in and Advances to Affiliates. As part of the Asset Sale Transaction, all control investments were sold on July 31, 2018.
F-66
Barings BDC, Inc.
Notes to Consolidated Financial Statements — (Continued)
9. Commitments and Contingencies
In the normal course of business, the Company is party to financial instruments with off-balance sheet risk, consisting primarily of unused commitments to extend financing to the Company’s portfolio companies. Since commitments may expire without being drawn upon, the total commitment amount does not necessarily represent future cash requirements. The balances of unused commitments to extend financing as of December 31, 2018 and 2017 were as follows:
Portfolio Company |
Investment Type |
December 31, 2018 |
December 31, 2017 |
|||||
Aveanna Healthcare Holdings, Inc. (F/K/A BCPE Eagle Buyer LLC)(1) |
Delayed Draw Term Loan |
$ |
804,620 |
$ |
— |
|||
Deva Holdings, Inc. |
Revolver |
— |
2,500,000 |
|||||
DLC Acquisition, LLC |
Revolver |
— |
1,800,000 |
|||||
Frank Entertainment Group, LLC(2) |
Delayed Draw Senior |
— |
130,212 |
|||||
Frank Entertainment Group, LLC(2) |
Delayed Draw Second Lien |
— |
303,827 |
|||||
HKW Capital Partners IV, L.P. |
Private Equity |
— |
214,823 |
|||||
ICP Industries Inc. |
Delayed Draw Term Loan |
— |
5,000,000 |
|||||
JS Held, LLC(1) |
Delayed Draw Term Loan |
2,275,039 |
— |
|||||
Lakeview Health Acquisition Company(2) |
Revolver |
— |
1,387,367 |
|||||
Lighthouse Autism Center(1) |
Delayed Draw Term Loan |
6,172,840 |
— |
|||||
Micross Solutions, LLC |
Delayed Draw Term Loan |
— |
3,000,000 |
|||||
Nautic Partners VII, LP |
Private Equity |
— |
509,080 |
|||||
Orchid Underwriters Agency, LLC |
Delayed Draw Term Loan |
— |
649,143 |
|||||
Schweiger Dermatology Group, LLC |
Delayed Draw Term Loan |
— |
4,500,000 |
|||||
SCUF Gaming, Inc. |
Revolver |
— |
2,000,000 |
|||||
Smile Brands, Inc. |
Equity Investment |
— |
1,000,000 |
|||||
Smile Brands, Inc(1). |
Delayed Draw Term Loan |
1,325,699 |
18,826,531 |
|||||
SPC Partners V, LP |
Private Equity |
— |
185,297 |
|||||
SPC Partners VI, LP |
Private Equity |
— |
2,792,172 |
|||||
Tate's Bake Shop |
Revolver |
— |
550,000 |
|||||
TGaS Advisors, LLC |
Revolver |
— |
2,000,000 |
|||||
Transportation Insight, LLC(1) |
Delayed Draw Term Loan |
5,516,932 |
— |
|||||
Vinvention Capital Partners TE LP ...(F/K/A Nomacorc, LLC)(2) |
Equity Investment |
— |
838,813 |
|||||
US Legal Support, Inc.(1) |
Delayed Draw Term Loan |
3,153,265 |
— |
|||||
Total unused commitments |
$ |
19,248,395 |
$ |
48,187,265 |
||||
(1) |
Represents a commitment to extend financing to a portfolio company where one or more of the Company's current investments in the portfolio company are carried at less than cost as of December 31, 2018. The Company's estimate of the fair value of the current investments in this portfolio company includes an analysis of the value of any unfunded commitments. |
(2) |
Represents a commitment to extend financing to a portfolio company where one or more of the Company's current investments in the portfolio company are carried at less than cost as of December 31, 2017. The Company's estimate of the fair value of the current investments in this portfolio company includes an analysis of the value of any unfunded commitments. |
F-67
Barings BDC, Inc.
Notes to Consolidated Financial Statements — (Continued)
The Company and certain former executive officers have been named as defendants in two putative securities class action lawsuits, each filed in the United States District Court for the Southern District of New York (and then transferred to the United States District Court for the Eastern District of North Carolina) on behalf of all persons who purchased or otherwise acquired the Company's common stock between May 7, 2014 and November 1, 2017. The first lawsuit was filed on November 21, 2017, and was captioned Elias Dagher, et al., v. Triangle Capital Corporation, et al., Case No. 5:18-cv-00015-FL (the "Dagher Action"). The second lawsuit was filed on November 28, 2017, and was captioned Gary W. Holden, et al., v. Triangle Capital Corporation, et al., Case No. 5:18-cv-00010-FL (the "Holden Action"). The Dagher Action and the Holden Action were consolidated and are currently captioned In re Triangle Capital Corp. Securities Litigation, Master File No. 5:18-cv-00010-FL.
On April 10, 2018, the plaintiff filed its First Consolidated Amended Complaint. The complaint, as currently amended, alleges certain violations of the securities laws, including, among other things, that the defendants made certain materially false and misleading statements and omissions regarding the Company’s business, operations and prospects between May 7, 2014 and November 1, 2017. The plaintiff seeks compensatory damages and attorneys’ fees and costs, among other relief, but did not specify the amount of damages being sought. On May 25, 2018, the defendants filed a motion to dismiss the complaint. On July 9, 2018, the plaintiff filed its response in opposition to the defendants’ motion to dismiss. The motion to dismiss was fully briefed as of July 31, 2018.
The Company and certain current and former members of the Board of Directors have been named as defendants in three other putative securities class action lawsuits challenging our June 1, 2018 proxy statement seeking shareholder approval of the Asset Purchase Agreement and the Externalization Agreement. The first lawsuit was filed on July 6, 2018 in the United States District Court for the Eastern District of North Carolina, and is captioned Carlson, et al. v. Triangle Capital Corporation, et al., Case No. 5:18-cv-00332-FL (the "Carlson Action"). The second lawsuit was filed on July 9, 2018 in the United States District Court for the District of Maryland, and is captioned Hammer, et al. v. Triangle Capital Corporation, et al., Case No. 1:18-cv-02086-RDB (the "Hammer Action"). The third lawsuit was filed on July 12, 2018 in the United States District Court for the District of Maryland, and is captioned Kent, et al. v. Triangle Capital Corporation, et al., Case No. 1:18-cv-0237-ELH (the "Kent Action"). The complaints in the Carlson Action, the Hammer Action, and the Kent Action each allege certain violations of the securities laws, including, among other things, that the defendants made certain material omissions in the proxy statement, and each sought to enjoin the shareholder meeting scheduled for July 24, 2018, among other relief.
On July 11, 2018, the plaintiff in the Carlson Action filed a motion for preliminary injunction seeking to enjoin the July 24, 2018 shareholder vote and to require that certain supplemental disclosures be made. On July 16, 2018, the court denied the plaintiff’s motion for preliminary injunction. The Kent Action was voluntarily dismissed on September 20, 2018. The Carlson Action was voluntarily dismissed on October 22, 2018. The Hammer Action was voluntarily dismissed on November 21, 2018
In addition, the Company is party to certain lawsuits in the normal course of business. Furthermore, third parties may try to seek to impose liability on the Company in connection with the activities of its portfolio companies.
While the outcome of any open legal proceedings, including those described above, cannot at this time be predicted with certainty, the Company does not expect that any reasonably possible losses arising from these matters will materially affect its financial condition or results of operations. Furthermore, in management's opinion, it is not possible to estimate a range of reasonably possible losses with respect to litigation contingencies.
F-68
Barings BDC, Inc.
Notes to Consolidated Financial Statements — (Continued)
10. Summarized Financial Information of Unconsolidated Subsidiaries
Prior to the Asset Sale Transaction, the Company held a control interest, as defined by the 1940 Act, in CRS-SPV, Inc. ("CRS"), a majority-owned portfolio company that was considered a significant subsidiary under the guidance in Regulation S-X, but was not consolidated in the Company’s consolidated financial statements. As part of the Asset Sale Transaction, the Company's investment in CRS was sold to the Asset Buyer. Below is summarized financial information for CRS as of December 31, 2017 and 2016 (dollars in thousands):
As of December 31, |
|||||||
2017 |
|||||||
Current assets |
$ |
6,296 |
|||||
Noncurrent assets |
$ |
16,162 |
|||||
Total assets |
$ |
22,458 |
|||||
Current liabilities |
$ |
1,843 |
|||||
Total liabilities |
$ |
3,901 |
|||||
Years Ended December 31, |
|||||||
2017 |
2016 |
||||||
Revenues |
$ |
9,344 |
$ |
13,851 |
|||
Cost of revenues |
$ |
5,992 |
$ |
12,976 |
|||
Gross profit (loss) |
$ |
3,352 |
$ |
875 |
|||
Net loss |
$ |
(8,640 |
) |
$ |
(12,845 |
) |
|
In addition, prior to the Asset Sale Transaction, the Company held a control interest, as defined by the 1940 Act, in Frank Entertainment Group, LLC ("Frank") and determined that Frank was a significant subsidiary under the guidance in Regulation S-X, but was not consolidated in the Company's consolidated financial statements. As part of the Asset Sale Transaction, the Company's investment in Frank was sold to the Asset Buyer. Below is summarized financial information for Frank as of December 31, 2017 and 2016 (dollars in thousands):
As of December 31, |
|||||||
2017 |
|||||||
Current assets |
$ |
8,570 |
|||||
Noncurrent assets |
$ |
29,505 |
|||||
Total assets |
$ |
38,075 |
|||||
Current liabilities |
$ |
13,700 |
|||||
Total liabilities |
$ |
54,151 |
|||||
Years Ended December 31, |
|||||||
2017 |
2016 |
||||||
Revenues |
$ |
56,196 |
$ |
66,208 |
|||
Cost of revenues |
$ |
21,082 |
$ |
24,944 |
|||
Gross profit |
$ |
35,114 |
$ |
41,264 |
|||
Pretax loss |
$ |
(11,372 |
) |
$ |
(9,452 |
) |
|
F-69
Barings BDC, Inc.
Notes to Consolidated Financial Statements — (Continued)
11. Financial Highlights
Year Ended December 31, |
||||||||||||||||||||
2018 |
2017 |
2016 |
2015 |
2014 |
||||||||||||||||
Per share data: |
||||||||||||||||||||
Net asset value at beginning of period |
$ |
13.43 |
$ |
15.13 |
$ |
15.23 |
$ |
16.11 |
$ |
16.10 |
||||||||||
Net investment income(1) |
— |
1.55 |
1.62 |
2.16 |
2.08 |
|||||||||||||||
Net realized gain (loss) on investments(1) |
(3.17 |
) |
(1.11 |
) |
0.05 |
(0.83 |
) |
0.46 |
||||||||||||
Net unrealized appreciation (depreciation) on investments / foreign currency(1) |
1.08 |
(1.04 |
) |
(0.72 |
) |
0.17 |
(1.48 |
) |
||||||||||||
Total increase (decrease) from investment operations(1) |
(2.09 |
) |
(0.60 |
) |
0.95 |
1.50 |
1.06 |
|||||||||||||
Dividends paid to stockholders from net investment income |
(0.41 |
) |
(1.65 |
) |
(1.89 |
) |
(2.11 |
) |
(1.88 |
) |
||||||||||
Dividends paid to stockholders from realized gains |
— |
— |
— |
(0.25 |
) |
(0.68 |
) |
|||||||||||||
Tax return of capital to stockholders |
(0.02 |
) |
— |
— |
— |
— |
||||||||||||||
Total dividends and distributions paid |
(0.43 |
) |
(1.65 |
) |
(1.89 |
) |
(2.36 |
) |
(2.56 |
) |
||||||||||
Common stock offerings |
— |
0.61 |
0.72 |
— |
1.49 |
|||||||||||||||
Purchase of shares in tender offer |
0.13 |
— |
— |
— |
— |
|||||||||||||||
Stock-based compensation(1) |
0.17 |
(0.01 |
) |
0.09 |
0.01 |
— |
||||||||||||||
Shares issued pursuant to Dividend Reinvestment Plan |
— |
0.01 |
0.04 |
0.03 |
0.04 |
|||||||||||||||
Loss on extinguishment of debt(1) |
(0.21 |
) |
— |
— |
(0.04 |
) |
— |
|||||||||||||
Benefit from (provision for) taxes(1) |
0.02 |
(0.02 |
) |
(0.01 |
) |
(0.01 |
) |
(0.10 |
) |
|||||||||||
Other(2) |
(0.04 |
) |
(0.04 |
) |
— |
(0.01 |
) |
0.08 |
||||||||||||
Net asset value at end of period |
$ |
10.98 |
$ |
13.43 |
$ |
15.13 |
$ |
15.23 |
$ |
16.11 |
||||||||||
Market value at end of period(3) |
$ |
9.01 |
$ |
9.49 |
$ |
18.34 |
$ |
19.11 |
$ |
20.29 |
||||||||||
Shares outstanding at end of period |
51,284,064 |
47,740,832 |
40,401,292 |
33,375,126 |
32,950,288 |
|||||||||||||||
Net assets at end of period |
$ |
562,967,287 |
$ |
641,275,374 |
$ |
611,156,258 |
$ |
508,367,755 |
$ |
530,826,629 |
||||||||||
Average net assets |
$ |
628,154,942 |
$ |
667,188,287 |
$ |
556,549,060 |
$ |
524,579,829 |
$ |
482,679,489 |
||||||||||
Ratio of total expenses, prior to waiver of base management fee, including loss on extinguishment of debt and benefit from (provision for) taxes, to average net assets |
14.54 |
% |
7.74 |
% |
9.93 |
% |
9.81 |
% |
9.45 |
% |
||||||||||
Ratio of total expenses, net of base management fee waived, including loss on extinguishment of debt and benefit from (provision for) taxes, to average net assets |
14.31 |
% |
7.74 |
% |
9.93 |
% |
9.81 |
% |
9.45 |
% |
||||||||||
Ratio of net investment income to average net assets |
(0.01 |
)% |
10.83 |
% |
10.58 |
% |
13.65 |
% |
12.85 |
% |
||||||||||
Portfolio turnover ratio |
228.49 |
% |
37.02 |
% |
24.61 |
% |
37.62 |
% |
29.21 |
% |
||||||||||
Total return(4) |
18.18 |
% |
(42.15 |
)% |
5.86 |
% |
5.82 |
% |
(17.36 |
)% |
||||||||||
(1) |
Weighted average per share data—basic and diluted. |
(2) |
Represents the impact of the different share amounts used in calculating per share data as a result of calculating certain per share data based upon the weighted average basic shares outstanding during the period and certain per share data based on the shares outstanding as of a period end or transaction date. |
(3) |
Represents the closing price of the Company’s common stock on the last day of the period. |
(4) |
Total return is based on purchase of stock at the current market price on the first day and a sale at the current market price on the last day of each period reported on the table and assumes reinvestment of dividends at prices obtained by the Company's dividend reinvestment plan during the period. Total return is not annualized. |
F-70
Barings BDC, Inc.
Notes to Consolidated Financial Statements — (Continued)
12. Selected Quarterly Financial Data (Unaudited)
The following tables set forth certain quarterly financial information for each of the eight quarters in the two years ended December 31, 2018. Results for any quarter are not necessarily indicative of results for the full year or for any future quarter.
Quarter Ended |
||||||||||||||||
March 31, 2018 |
June 30, 2018 |
September 30, 2018 |
December 31, 2018 |
|||||||||||||
Total investment income |
$ |
26,076,087 |
$ |
25,473,491 |
$ |
12,072,396 |
$ |
16,601,651 |
||||||||
Net investment income (loss) |
12,724,178 |
10,061,869 |
(31,053,306 |
) |
8,206,537 |
|||||||||||
Net increase (decrease) in net assets resulting from operations |
14,471,653 |
15,316,880 |
(101,390,384 |
) |
(42,680,285 |
) |
||||||||||
Net investment income (loss) per share |
$ |
0.27 |
$ |
0.21 |
$ |
(0.59 |
) |
$ |
0.16 |
|||||||
Quarter Ended |
||||||||||||||||
March 31, 2017 |
June 30, 2017 |
September 30, 2017 |
December 31, 2017 |
|||||||||||||
Total investment income |
$ |
30,190,770 |
$ |
31,213,767 |
$ |
29,888,058 |
$ |
31,712,037 |
||||||||
Net investment income |
17,819,433 |
19,350,962 |
17,150,917 |
17,916,505 |
||||||||||||
Net increase in net assets resulting from operations |
7,193,240 |
(2,027,746 |
) |
(57,496,676 |
) |
23,680,721 |
||||||||||
Net investment income per share |
$ |
0.42 |
$ |
0.41 |
$ |
0.36 |
$ |
0.38 |
||||||||
13. Subsequent Events
Subsequent to December 31, 2018, the Company made approximately $43.6 million of new middle-market private debt commitments, of which approximately $15.7 million closed. The $43.6 million of middle-market investments consist of 100% first lien senior secured debt. The weighted average origination yield based on a three-year average life (inclusive of the upfront fees received) was 8.3%.
On February 21, 2019, the Company entered into a senior secured revolving credit agreement (the "2019 Credit Facility") with ING Capital LLC ("ING"), as administrative agent, and the lenders party thereto. The initial commitments under the 2019 Credit Facility total $800.0 million. The 2019 Credit Facility has an accordion feature that allows for an increase in the total commitments of up to $400.0 million, subject to certain conditions and the satisfaction of specified financial covenants. The Company can borrow foreign currencies directly under the 2019 Credit Facility. The 2019 Credit Facility, which is structured as a revolving credit facility, is secured primarily by a material portion of the Company's assets and guaranteed by certain subsidiaries of the Company. The revolving period of the 2019 Credit Facility ends on February 21, 2023, followed by a one-year amortization period with a final maturity date of February 21, 2024.
Borrowings under the 2019 Credit Facility bear interest, subject to the Company's election, on a per annum basis equal to (i) the applicable base rate plus 1.25% (or, after one year, 1.00% if the Company receives an investment grade credit rating), (ii) the applicable LIBOR rate plus 2.25% (or, after one year, 2.00% if the Company receives an investment grade credit rating), (iii) for borrowings denominated in Canadian dollars, the applicable Canadian dollars Screen Rate plus 2.25% (or, after one year, 2.00% if the Company receives an investment grade credit rating), or (iv) for borrowings denominated in Australian dollars, the applicable Australian dollars Screen Rate, plus 2.45% (or, after one year, 2.20% if the Company receives an investment grade credit rating). The applicable base rate is equal to the greatest of (i) the prime rate, (ii) the federal funds rate plus 0.5%, (iii) the Overnight Bank Funding Rate plus 0.5%, (iv) the adjusted three-month LIBOR plus 1.0% and (v) 1%. The applicable LIBOR rate depends on the term of the draw under the 2019 Credit Facility. The Company pays a commitment fee of (i) for the period beginning on the closing date of the 2019 Credit Facility to and including the date that is six months after the closing date of the 2019 Credit Facility, 0.375% per annum on undrawn amounts,
F-71
Barings BDC, Inc.
Notes to Consolidated Financial Statements — (Continued)
and (ii) for the period beginning on the date that is six months after the closing date of the 2019 Credit Facility, (x) 0.5% per annum on undrawn amounts if the unused portion of the 2019 Credit Facility is greater than one third of total commitments or (y) 0.375% per annum on undrawn amounts if the unused portion of the 2019 Credit Facility is equal to or less than one third of total commitments.
The 2019 Credit Facility contains certain affirmative and negative covenants, including but not limited to (i) maintaining minimum shareholders' equity, (ii) maintaining minimum obligors' net worth, (iii) maintaining a minimum asset coverage ratio, (iv) meeting a minimum liquidity test and (v) maintaining the Company's status as a regulated investment company and as a business development company. The 2019 Credit Facility also contains customary events of default with customary cure and notice provisions, including, without limitation, nonpayment, misrepresentation of representations and warranties in a material respect, breach of covenant, cross-default to other indebtedness, bankruptcy, change of control, and material adverse effect. The 2019 Credit Facility also permits the administrative agent to select an independent third party valuation firm to determine valuations of certain portfolio investments for purposes of borrowing base provisions. In connection with the 2019 Credit Facility, the Company also entered into new collateral documents.
Following the closing of the 2019 Credit Facility, the Company provided notice to the lenders under the August 2018 Credit Facility that it would reduce its Class A Loan Commitments under the August 2018 Credit Facility from $250.0 million to $100.0 million, which reduces total commitments under the August 2018 Credit Facility from $750.0 million to $600.0 million effective February 28, 2019.
On February 25, 2019, the Board declared a quarterly distribution of $0.12 per share payable on March 20, 2019 to holders of record as of March 13, 2019.
On February 25, 2019, the Company adopted a share repurchase plan, pursuant to Board approval, for the purpose of repurchasing shares of the Company's common stock in the open market (the "Share Repurchase Plan"). The Board has authorized the Company to repurchase in 2019 up to a maximum of 5.0% of the amount of shares outstanding under the following targets:
• |
a maximum of 2.5% of the amount of shares of the Company's common stock outstanding if shares trade below NAV per share but in excess of 90% of NAV per share; and |
• |
a maximum of 5.0% of the amount of shares of the Company's common stock outstanding if shares trade below 90% of NAV per share. |
The Share Repurchase Plan will be executed in accordance with applicable rules under the Exchange Act including Rules 10b5-1 and 10b-18 thereunder, as well as certain price, market volume and timing constraints specified in the Share Repurchase Plan. The Share Repurchase Plan is designed to allow the Company to repurchase its shares both during its open window periods and at times when it otherwise might be prevented from doing so under applicable insider trading laws or because of self-imposed trading blackout periods. A broker selected by the Company has been delegated the authority to repurchase shares on the Company's behalf in the open market, pursuant to, and under the terms and limitations of, the Share Repurchase Plan. There is no assurance that the Company will purchase shares at any specific discount levels or in any specific amounts. The Company's repurchase activity will be disclosed in its periodic reports for the relevant fiscal periods. There is no assurance that the market price of the Company's shares, either absolutely or relative to net asset value, will increase as a result of any share repurchases, or that the Share Repurchase Plan will enhance stockholder value over the long term.
F-72
EXHIBIT INDEX
Number |
Exhibit |
|
10.5 |
||
21.1 |
||
31.1 |
||
31.2 |
||
32.1 |
||
32.2 |
||
* |
Filed herewith. |
** |
Furnished herewith. |