EXHIBIT 99.1
Published on September 4, 2008
Exhibit 99.1
| NASDAQ Global Market Symbol: TCAP www.tcap.com Investor Presentation September 2008 Triangle Capital Corporation |
| Statement under the Private Securities Litigation Reform Act of 1995: This presentation contains forward-looking statements concerning our goals, beliefs, strategies, future operating results and underlying assumptions. Actual results may differ materially from those indicated by these forward-looking statements as a result of various important factors, including those described under the caption "Special Note Regarding Forward-Looking Statements" which are detailed in our filings with the SEC. We undertake no obligation to update the information contained in this presentation to reflect subsequently occurring events or circumstances. This presentation contains non- GAAP measures. "Safe Harbor" |
| COMPANY & INDUSTRY OVERVIEW |
| Pure-play, lower middle market, internally managed BDC Typical investment size = $5MM to $15MM Invest primarily in subordinated debt and equity securities 2Q 2008 annualized dividend = $1.40 per share Run Rate net investment income = $1.69 per share (1) Current assets under management ^ $220MM Company Overview Our goal is to be the premier provider of capital to lower middle market companies Anticipated NII per share based on 2008 YTD transaction closings which have been previously announced. |
| Key Investment Considerations Attractive business model Recurring revenue stream High operating leverage drives net investment income (NII) Seasoned investment team Eight transaction professionals Over 150 years of advising, investing and operating experience Attractive lower middle market focus Less transaction competition Higher transaction IRRs Weighted average portfolio debt yield is 14.0% vs. industry average of 12.0% Seasoned investment portfolio Strong capital structure Low cost, long term SBA debt (10 years) ^ 5.80% coupon Lower cost of debt reduces WACC and increases NII |
| BDC Industry Overview Business Development Companies ("BDCs") are uniquely positioned financing vehicles Created by congress to promote investments in privately held companies In 1997 there were 3 BDCs Currently there are 27 BDCs BDCs function as tax-advantaged, pass-through entities Limited corporate taxation Greater than 90% of earnings are passed to shareholders in the form of dividends BDCs are a low risk way to participate in private equity Similarities: business scope, equity upside, lean staffing models Differences: perpetual funding, recurring revenue, lower cost of capital, investor liquidity option |
| Why We Target the Lower Middle Market Over 65,000 lower middle market companies in the United States with revenues between $10MM and $100MM More than 90% are privately held Significant financing needs Highly fragmented market underserved by commercial & investment banks Offers superior risk-adjusted returns Attractive niche for a seasoned team with an operational discipline Less competitive pricing environment Relationships matter Certainty of closing is extremely important Our core investing team of 8 professionals includes two former private company presidents, one former public company CFO, two CFAs, & two CPAs |
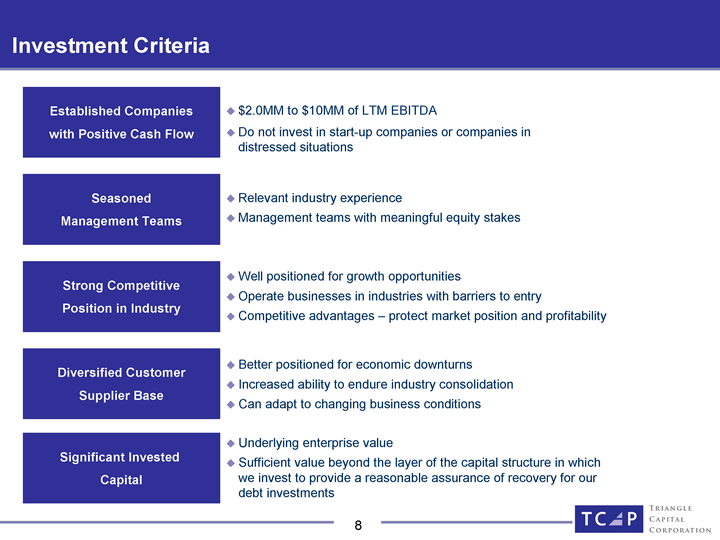
| Investment Criteria Relevant industry experience Management teams with meaningful equity stakes Well positioned for growth opportunities Operate businesses in industries with barriers to entry Competitive advantages - protect market position and profitability $2.0MM to $10MM of LTM EBITDA Do not invest in start-up companies or companies in distressed situations Strong Competitive Position in Industry Seasoned Management Teams Established Companies with Positive Cash Flow Better positioned for economic downturns Increased ability to endure industry consolidation Can adapt to changing business conditions Diversified Customer Supplier Base Underlying enterprise value Sufficient value beyond the layer of the capital structure in which we invest to provide a reasonable assurance of recovery for our debt investments Significant Invested Capital |
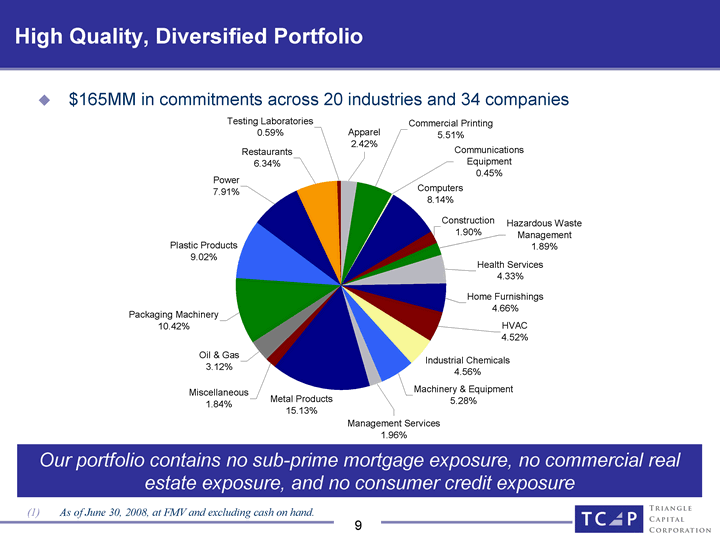
| High Quality, Diversified Portfolio $165MM in commitments across 20 industries and 34 companies As of June 30, 2008, at FMV and excluding cash on hand. Our portfolio contains no sub-prime mortgage exposure, no commercial real estate exposure, and no consumer credit exposure estate exposure, and no consumer credit exposure estate exposure, and no consumer credit exposure |
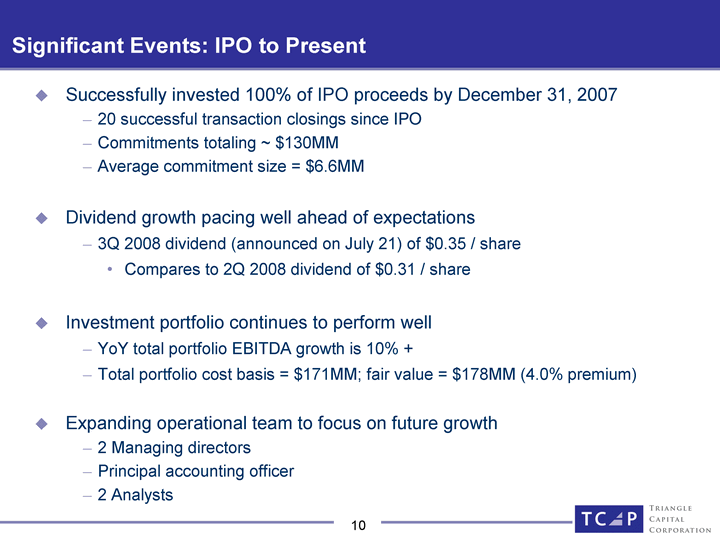
| Significant Events: IPO to Present Successfully invested 100% of IPO proceeds by December 31, 2007 20 successful transaction closings since IPO Commitments totaling ~ $130MM Average commitment size = $6.6MM Dividend growth pacing well ahead of expectations 3Q 2008 dividend (announced on July 21) of $0.35 / share Compares to 2Q 2008 dividend of $0.31 / share Investment portfolio continues to perform well YoY total portfolio EBITDA growth is 10% + Total portfolio cost basis = $171MM; fair value = $178MM (4.0% premium) Expanding operational team to focus on future growth 2 Managing directors Principal accounting officer 2 Analysts |
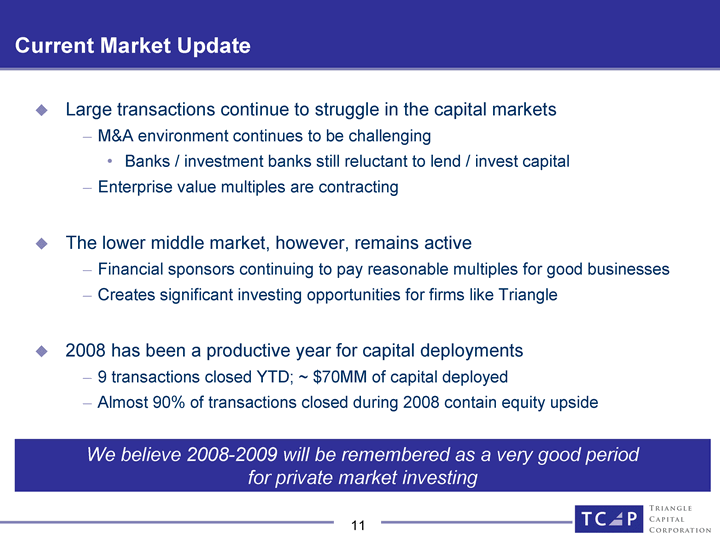
| Current Market Update Large transactions continue to struggle in the capital markets M&A environment continues to be challenging Banks / investment banks still reluctant to lend / invest capital Enterprise value multiples are contracting The lower middle market, however, remains active Financial sponsors continuing to pay reasonable multiples for good businesses Creates significant investing opportunities for firms like Triangle 2008 has been a productive year for capital deployments 9 transactions closed YTD; ~ $70MM of capital deployed Almost 90% of transactions closed during 2008 contain equity upside We believe 2008-2009 will be remembered as a very good period for private market investing |
| FINANCIAL OVERVIEW |
| Long Term Financial Goals Maintain excellent dividend reputation Long term, steadily increasing dividend Harvest capital gains when possible Maintain disciplined cost controls Take advantage of fixed cost operational structure Enable asset growth to outpace SG & A growth Maintain prudent credit profile Opportunistic use of leverage to enhance shareholder returns Use low cost SBA leverage to increase NII |
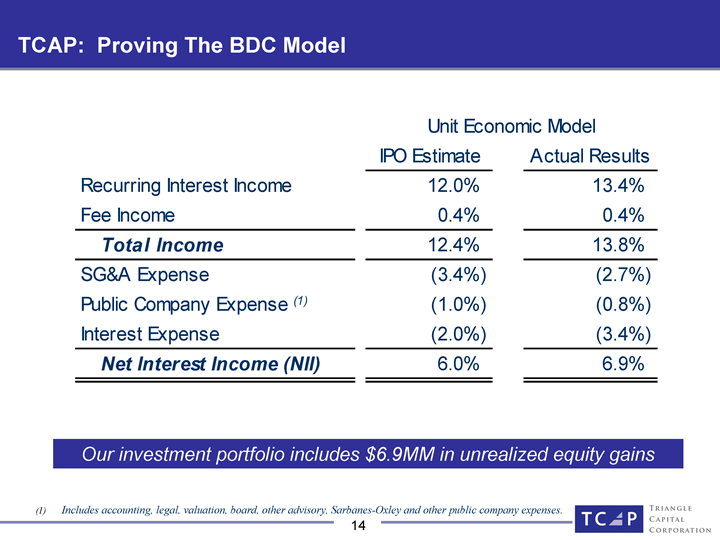
| Includes accounting, legal, valuation, board, other advisory, Sarbanes-Oxley and other public company expenses. TCAP: Proving The BDC Model Our investment portfolio includes $6.9MM in unrealized equity gains |
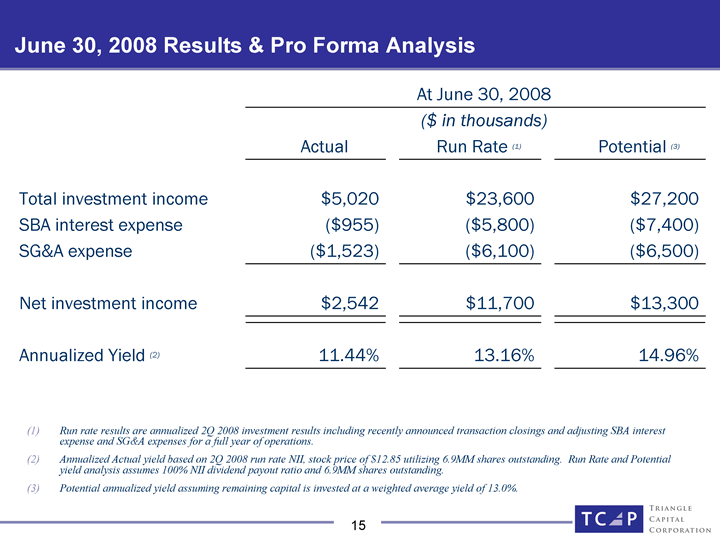
| June 30, 2008 Results & Pro Forma Analysis At June 30, 2008 At June 30, 2008 At June 30, 2008 At June 30, 2008 At June 30, 2008 ($ in thousands) ($ in thousands) ($ in thousands) ($ in thousands) ($ in thousands) Actual Run Rate (1) Potential (3) Total investment income $5,020 $23,600 $27,200 SBA interest expense ($955) ($5,800) ($7,400) SG&A expense ($1,523) ($6,100) ($6,500) Net investment income $2,542 $11,700 $13,300 Annualized Yield (2) 11.44% 13.16% 14.96% Run rate results are annualized 2Q 2008 investment results including recently announced transaction closings and adjusting SBA interest expense and SG&A expenses for a full year of operations. Annualized Actual yield based on 2Q 2008 run rate NII, stock price of $12.85 utilizing 6.9MM shares outstanding. Run Rate and Potential yield analysis assumes 100% NII dividend payout ratio and 6.9MM shares outstanding. Potential annualized yield assuming remaining capital is invested at a weighted average yield of 13.0%. |
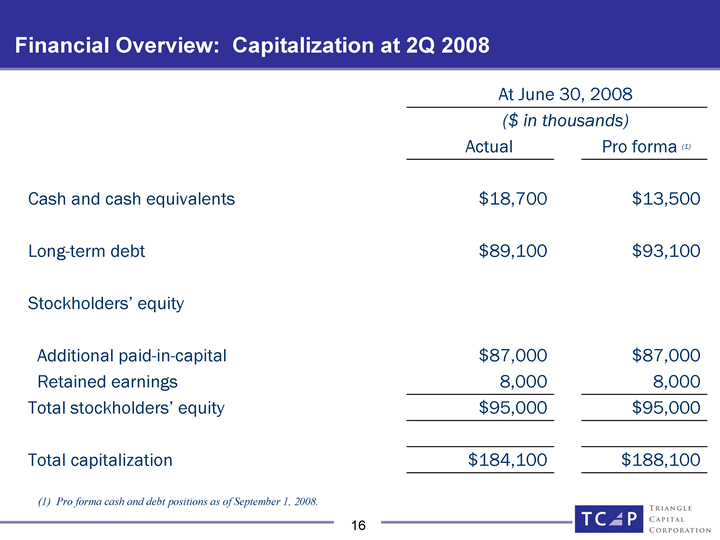
| Financial Overview: Capitalization at 2Q 2008 At June 30, 2008 At June 30, 2008 At June 30, 2008 At June 30, 2008 ($ in thousands) ($ in thousands) ($ in thousands) ($ in thousands) Actual Pro forma (1) Pro forma (1) Cash and cash equivalents $18,700 $13,500 Long-term debt $89,100 $93,100 Stockholders' equity Additional paid-in-capital $87,000 $87,000 Retained earnings 8,000 8,000 Total stockholders' equity $95,000 $95,000 Total capitalization $184,100 $188,100 (1) Pro forma cash and debt positions as of September 1, 2008. |
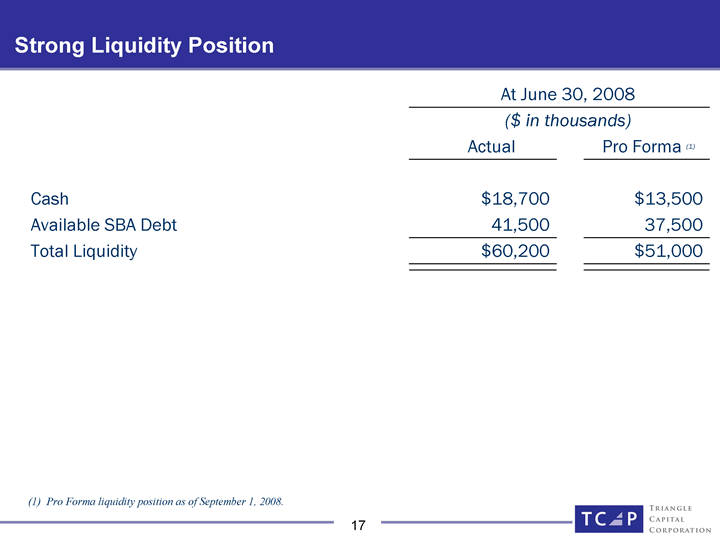
| Strong Liquidity Position At June 30, 2008 At June 30, 2008 At June 30, 2008 At June 30, 2008 ($ in thousands) ($ in thousands) ($ in thousands) ($ in thousands) Actual Pro Forma (1) Pro Forma (1) Cash $18,700 $13,500 Available SBA Debt 41,500 37,500 Total Liquidity $60,200 $51,000 (1) Pro Forma liquidity position as of September 1, 2008. |
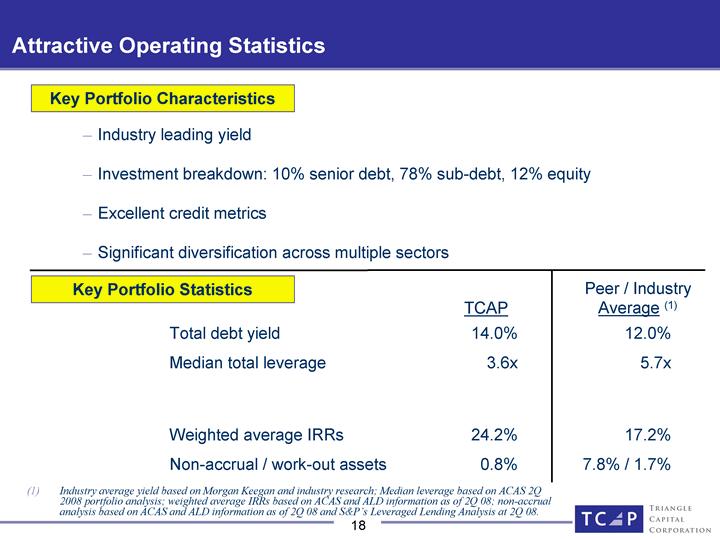
| Attractive Operating Statistics Industry leading yield Investment breakdown: 10% senior debt, 78% sub-debt, 12% equity Excellent credit metrics Significant diversification across multiple sectors Key Portfolio Statistics Total debt yield Median total leverage Weighted average IRRs Non-accrual / work-out assets 14.0% 3.6x 24.2% 0.8% 12.0% 5.7x 17.2% 7.8% / 1.7% TCAP Peer / Industry Average (1) Industry average yield based on Morgan Keegan and industry research; Median leverage based on ACAS 2Q 2008 portfolio analysis; weighted average IRRs based on ACAS and ALD information as of 2Q 08; non-accrual analysis based on ACAS and ALD information as of 2Q 08 and S&P's Leveraged Lending Analysis at 2Q 08. Key Portfolio Characteristics |
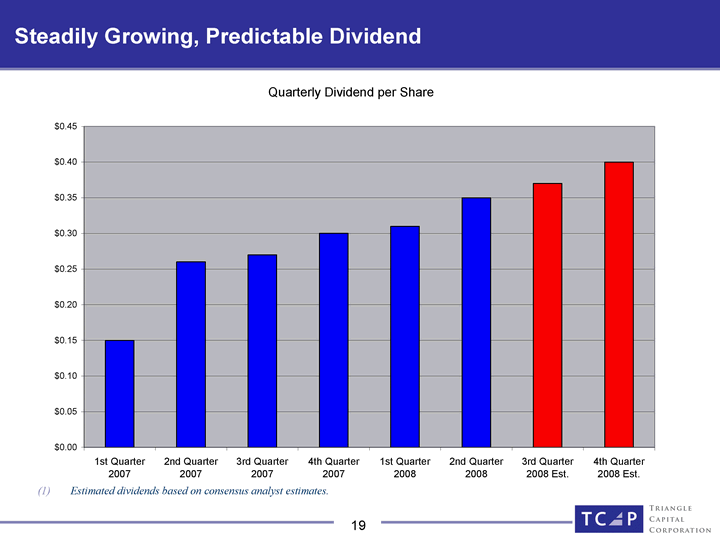
| Steadily Growing, Predictable Dividend Estimated dividends based on consensus analyst estimates. Estimated dividends based on consensus analyst estimates. |
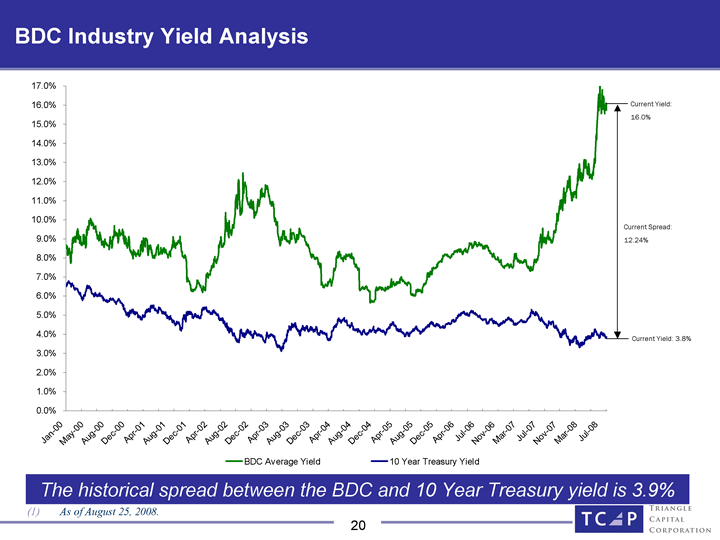
| BDC Industry Yield Analysis As of August 25, 2008. Current Yield: 3.8% Current Spread: 12.24% Current Yield: 16.0% The historical spread between the BDC and 10 Year Treasury yield is 3.9% |
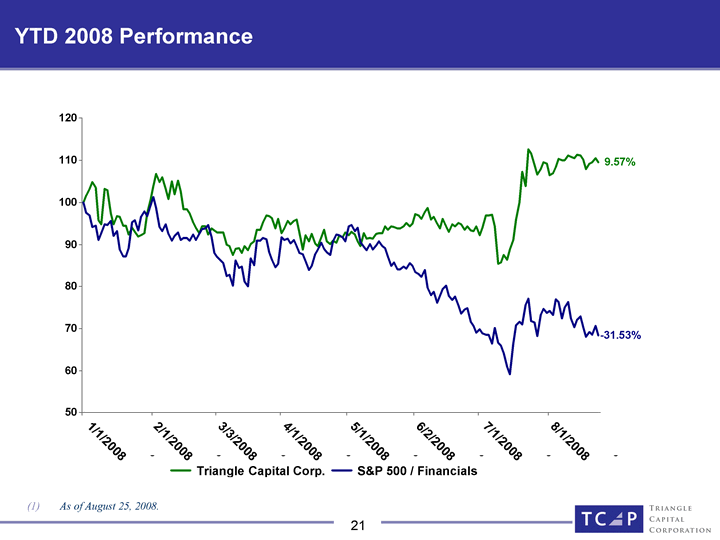
| YTD 2008 Performance As of August 25, 2008. 1/1/2008 2/1/2008 3/3/2008 4/1/2008 5/1/2008 6/2/2008 7/1/2008 8/1/2008 |
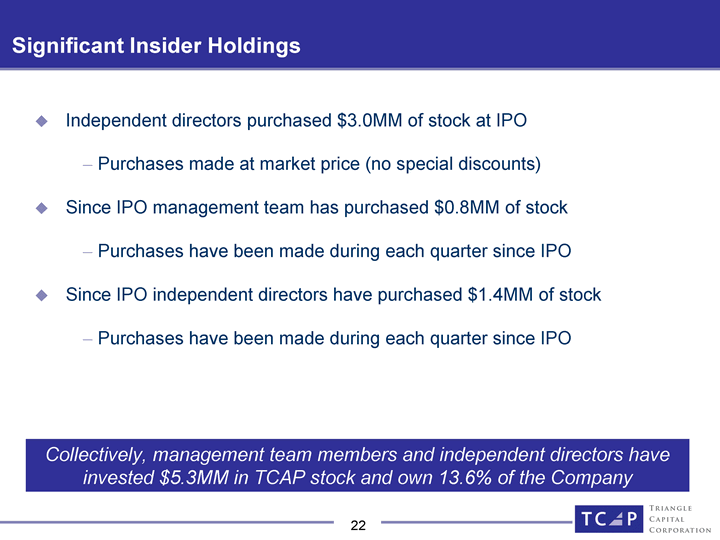
| Significant Insider Holdings Independent directors purchased $3.0MM of stock at IPO Purchases made at market price (no special discounts) Since IPO management team has purchased $0.8MM of stock Purchases have been made during each quarter since IPO Since IPO independent directors have purchased $1.4MM of stock Purchases have been made during each quarter since IPO Collectively, management team members and independent directors have invested $5.3MM in TCAP stock and own 13.6% of the Company |
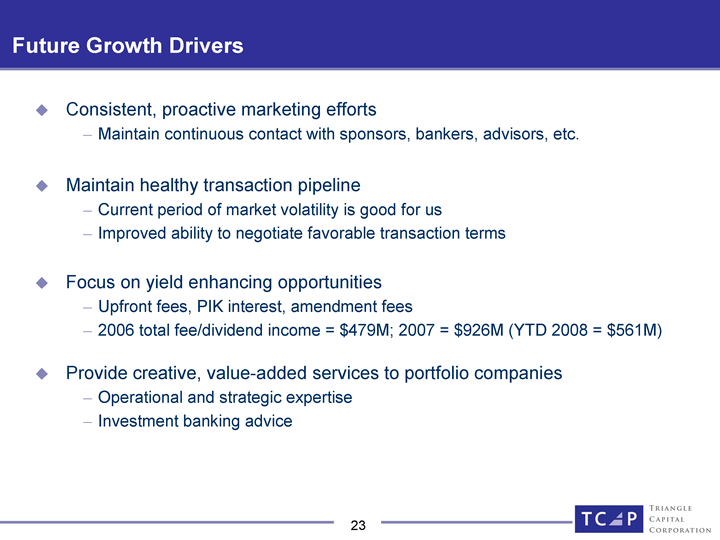
| Future Growth Drivers Consistent, proactive marketing efforts Maintain continuous contact with sponsors, bankers, advisors, etc. Maintain healthy transaction pipeline Current period of market volatility is good for us Improved ability to negotiate favorable transaction terms Focus on yield enhancing opportunities Upfront fees, PIK interest, amendment fees 2006 total fee/dividend income = $479M; 2007 = $926M (YTD 2008 = $561M) Provide creative, value-added services to portfolio companies Operational and strategic expertise Investment banking advice |